
|
ý
|
ANNUAL
REPORT PURSUANT TO SECTION 13 OR 15(d) OF THE
|
|
|
SECURITIES
EXCHANGE ACT OF 1934
|
||
|
For
the fiscal year ended December 31, 2007
|
||
|
OR
|
||
|
o
|
TRANSITION
REPORT PURSUANT TO SECTION 13 OR 15(d) OF THE
|
|
|
SECURITIES
EXCHANGE ACT OF 1934
|
|
Florida
|
0-13358
|
59-2273542
|
||
|
(State
of Incorporation)
|
(Commission
File Number)
|
(IRS
Employer Identification No.)
|
||
|
217
North Monroe Street, Tallahassee, Florida
|
32301
|
|||
|
(Address
of principal executive offices)
|
(Zip
Code)
|
|||
|
Class
|
Outstanding
at February 29, 2008
|
|
|
Common
Stock, $0.01 par value per share
|
17,169,096
shares
|
|
|
PART
I
|
PAGE
|
|||
|
Item
1.
|
4
|
|||
|
Item
1A.
|
14
|
|||
|
Item
1B.
|
20
|
|||
|
Item
2.
|
20
|
|||
|
Item
3.
|
20
|
|||
|
Item
4.
|
20
|
|||
|
PART
II
|
||||
|
Item
5.
|
20
|
|||
|
Item
6.
|
22
|
|||
|
Item
7.
|
23
|
|||
|
Item
7A.
|
50
|
|||
|
Item
8.
|
53
|
|||
|
Item
9.
|
89
|
|||
|
Item
9A.
|
89
|
|||
|
Item
9B.
|
91
|
|||
|
PART
III
|
||||
|
Item
10.
|
91
|
|||
|
Item
11.
|
91
|
|||
|
Item
12.
|
91
|
|||
|
Item
13.
|
92
|
|||
|
Item
14.
|
92
|
|||
|
PART
IV
|
||||
|
Item
15.
|
93
|
|||
|
95
|
||||
|
§
|
the
frequency and magnitude of foreclosure of our
loans;
|
|
§
|
the
effects of our lack of a diversified loan portfolio, including the risks
of geographic and industry
concentrations;
|
|
§
|
the
accuracy of our financial statement estimates and assumptions, including
the estimate for our loan loss
provision;
|
|
§
|
our
ability to integrate the business and operations of companies and banks
that we have acquired, and those we may acquire in the
future;
|
|
§
|
our
need and our ability to incur additional debt or equity
financing;
|
|
§
|
the
strength of the United States economy in general and the strength of the
local economies in which we conduct
operations;
|
|
§
|
the
effects of harsh weather conditions, including
hurricanes;
|
|
§
|
inflation,
interest rate, market and monetary
fluctuations;
|
|
§
|
effect
of changes in the stock market and other capital
markets;
|
|
§
|
legislative
or regulatory changes;
|
|
§
|
our
ability to comply with the extensive laws and regulations to which we are
subject;
|
|
§
|
the
willingness of clients to accept third-party products and services rather
than our products and services and vice
versa;
|
|
§
|
changes
in the securities and real estate
markets;
|
|
§
|
increased
competition and its effect on
pricing;
|
|
§
|
technological
changes;
|
|
§
|
changes
in monetary and fiscal policies of the U.S.
Government;
|
|
§
|
the
effects of security breaches and computer viruses that may affect our
computer systems;
|
|
§
|
changes
in consumer spending and saving
habits;
|
|
§
|
growth
and profitability of our noninterest
income;
|
|
§
|
changes
in accounting principles, policies, practices or
guidelines;
|
|
§
|
the
limited trading activity of our common
stock;
|
|
§
|
the
concentration of ownership of our common
stock;
|
|
§
|
anti-takeover
provisions under federal and state law as well as our Articles of
Incorporation and our Bylaws;
|
|
§
|
other
risks described from time to time in our filings with the Securities and
Exchange Commission; and
|
|
§
|
our
ability to manage the risks involved in the
foregoing.
|
|
§
|
Business Banking – The
Bank provides banking services to corporations and other business
clients. Credit products are available for a wide variety of
general business purposes, including financing for commercial business
properties, equipment, inventories and accounts receivable, as well as
commercial leasing and letters of credit. Treasury management
services and merchant credit card transaction processing services are also
offered.
|
|
§
|
Commercial Real Estate Lending
– The Bank provides a wide range of products to meet the financing
needs of commercial developers and investors, residential builders and
developers, and community
development.
|
|
§
|
Residential Real Estate
Lending – The Bank provides products to help meet the home
financing needs of consumers, including conventional permanent and
construction/permanent (fixed or adjustable rate) financing arrangements,
and FHA/VA loan products. The bank offers both fixed-rate and
adjustable rate residential mortgage (ARM) loans. As of
December 31, 2007, approximately 16% of the Bank’s loan portfolio
consisted of residential ARM loans. A portion of our loans
originated are sold into the secondary
market.
|
|
|
The
Bank offers these products through its existing network of branch
offices. Geographical expansion of the delivery of this product
line has occurred over the past three years through the opening of
mortgage lending offices in Gainesville, Florida (Alachua County) and
Thomasville, Georgia (Thomas
County).
|
|
§
|
Retail Credit – The
Bank provides a full range of loan products to meet the needs of
consumers, including personal loans, automobile loans, boat/RV loans, home
equity loans, and credit card
programs.
|
|
§
|
Institutional Banking –
The
Bank provides banking services to meet the needs of state and local
governments, public schools and colleges, charities, membership and
not-for-profit associations including customized checking and savings
accounts, cash management systems, tax-exempt loans, lines of credit, and
term loans.
|
|
§
|
Retail Banking - The
Bank provides a full range of consumer banking services, including
checking accounts, savings programs, automated teller machines (ATMs),
debit/credit cards, night deposit services, safe deposit facilities, and
PC/Internet banking. Clients can use the Capital City Bank
Direct automated phone system to gain 24-hour access to their deposit and
loan account information, and transfer funds between linked
accounts. The Bank is a member of the “Star” ATM Network that
permits banking clients to access cash at ATMs or point of sale
merchants.
|
|
Market
Share as of June 30,(1)
|
||||||||||
|
2007
|
2006
|
2005
|
||||||||
|
Florida
|
||||||||||
|
Alachua
County(2)
|
4.7
|
%
|
5.6
|
%
|
6.3
|
%
|
||||
|
Bradford
County
|
47.6
|
%
|
44.6
|
%
|
42.6
|
%
|
||||
|
Citrus
County
|
3.0
|
%
|
3.3
|
%
|
3.5
|
%
|
||||
|
Clay
County
|
2.0
|
%
|
2.0
|
%
|
2.2
|
%
|
||||
|
Dixie
County
|
22.9
|
%
|
20.8
|
%
|
17.3
|
%
|
||||
|
Gadsden
County
|
61.0
|
%
|
64.9
|
%
|
68.0
|
%
|
||||
|
Gilchrist
County
|
33.6
|
%
|
47.1
|
%
|
49.5
|
%
|
||||
|
Gulf
County
|
11.7
|
%
|
14.3
|
%
|
19.8
|
%
|
||||
|
Hernando
County
|
1.2
|
%
|
1.5
|
%
|
1.4
|
%
|
||||
|
Jefferson
County
|
22.8
|
%
|
24.6
|
%
|
24.4
|
%
|
||||
|
Leon
County
|
16.2
|
%
|
18.0
|
%
|
17.5
|
%
|
||||
|
Levy
County
|
33.0
|
%
|
34.4
|
%
|
33.8
|
%
|
||||
|
Madison
County
|
13.1
|
%
|
14.9
|
%
|
15.1
|
%
|
||||
|
Pasco
County
|
0.2
|
%
|
0.2
|
%
|
0.3
|
%
|
||||
|
Putnam
County
|
11.1
|
%
|
12.3
|
%
|
12.3
|
%
|
||||
|
St.
Johns County(2)
|
1.2
|
%
|
1.5
|
%
|
2.0
|
%
|
||||
|
Suwannee
County
|
7.7
|
%
|
11.8
|
%
|
7.5
|
%
|
||||
|
Taylor
County
|
30.1
|
%
|
28.6
|
%
|
27.9
|
%
|
||||
|
Wakulla
County(3)
|
2.6
|
%
|
2.9
|
%
|
--
|
|||||
|
Washington
County
|
13.8
|
%
|
17.4
|
%
|
20.3
|
%
|
||||
|
Georgia(4)
|
||||||||||
|
Bibb
County
|
2.5
|
%
|
2.9
|
%
|
2.8
|
%
|
||||
|
Burke
County
|
7.8
|
%
|
9.2
|
%
|
9.3
|
%
|
||||
|
Grady
County
|
18.7
|
%
|
20.0
|
%
|
19.7
|
%
|
||||
|
Laurens
County
|
19.2
|
%
|
23.8
|
%
|
33.1
|
%
|
||||
|
Troup
County
|
6.2
|
%
|
8.2
|
%
|
7.5
|
%
|
||||
|
Alabama
|
||||||||||
|
Chambers
County
|
6.5
|
%
|
4.7
|
%
|
3.9
|
%
|
||||
|
(1)
|
Obtained from the June 30, 2007
FDIC/OTS Summary of Deposits
Report.
|
|
(2)
|
CCB entered market in May
2005.
|
|
(3)
|
CCB entered market in December
2005.
|
|
(4)
|
Does not include Thomas County
where Capital City Bank maintains a residential mortgage lending office
only.
|
|
County
|
Number
of
Commercial
Banks
|
Number
of Commercial
Bank
Offices
|
|
Florida
|
||
|
Alachua
|
13
|
65
|
|
Bradford
|
3
|
3
|
|
Citrus
|
16
|
49
|
|
Clay
|
12
|
29
|
|
Dixie
|
3
|
4
|
|
Gadsden
|
4
|
6
|
|
Gilchrist
|
3
|
6
|
|
Gulf
|
6
|
9
|
|
Hernando
|
13
|
41
|
|
Jefferson
|
2
|
2
|
|
Leon
|
14
|
83
|
|
Levy
|
3
|
13
|
|
Madison
|
6
|
6
|
|
Pasco
|
25
|
114
|
|
Putnam
|
6
|
16
|
|
St.
Johns
|
22
|
63
|
|
Suwannee
|
5
|
8
|
|
Taylor
|
3
|
4
|
|
Wakulla
|
4
|
9
|
|
Washington
|
5
|
5
|
|
Georgia
|
||
|
Bibb
|
11
|
55
|
|
Burke
|
5
|
10
|
|
Grady
|
5
|
8
|
|
Laurens
|
10
|
19
|
|
Troup
|
10
|
24
|
|
Alabama
|
||
|
Chambers
|
5
|
10
|
|
Risk
Factors
|
|
§
|
the
risk characteristics of various classifications of
loans;
|
|
§
|
previous
loan loss experience;
|
|
§
|
specific
loans that have loss potential;
|
|
§
|
delinquency
trends;
|
|
§
|
estimated
fair market value of the
collateral;
|
|
§
|
current
economic conditions; and
|
|
§
|
geographic
and industry loan concentrations.
|
|
§
|
Commercial Real Estate
Loans. Repayment is dependent on income being generated
in amounts sufficient to cover operating expenses and debt
service. These loans also involve greater risk because they are
generally not fully amortizing over a loan period, but rather have a
balloon payment due at maturity. A borrower’s ability to make a
balloon payment typically will depend on being able to either refinance
the loan or timely sell the underlying
property.
|
|
§
|
Commercial
Loans. Repayment is generally dependent upon the
successful operation of the borrower’s business. In addition,
the collateral securing the loans may depreciate over time, be difficult
to appraise, be illiquid, or fluctuate in value based on the success of
the business.
|
|
§
|
Construction
Loans. The risk of loss is largely dependent on our
initial estimate of whether the property’s value at completion equals or
exceeds the cost of property construction and the availability of take-out
financing. During the construction phase, a number of factors can result in delays
or cost overruns. If our estimate is inaccurate or if actual
construction costs exceed estimates, the value of the property securing
our loan may be insufficient to ensure full repayment when completed
through a permanent loan or by seizure of
collateral.
|
|
§
|
Consumer
Loans. Consumer loans
(such as personal lines of credit) are collateralized, if at all, with
assets that may not provide an adequate source of payment of the loan due
to depreciation, damage, or
loss.
|
|
§
|
general
or local economic conditions;
|
|
§
|
neighborhood
values;
|
|
§
|
interest
rates;
|
|
§
|
real
estate tax rates;
|
|
§
|
operating
expenses of the mortgaged
properties;
|
|
§
|
supply
of and demand for rental units or
properties;
|
|
§
|
ability
to obtain and maintain adequate occupancy of the
properties;
|
|
§
|
zoning
laws;
|
|
§
|
governmental
rules, regulations and fiscal policies;
and
|
|
§
|
acts
of God.
|
|
§
|
Supermajority
voting requirements to remove a director from
office;
|
|
§
|
Provisions
regarding the timing and content of shareowner proposals and
nominations;
|
|
§
|
Supermajority
voting requirements to amend Articles of Incorporation unless approval is
received by a majority of “disinterested
directors”;
|
|
§
|
Absence
of cumulative voting; and
|
|
§
|
Inability
for shareowners to take action by written
consent.
|
|
Unresolved
Staff Comments
|
|
Legal
Proceedings
|
|
Submission of Matters to a Vote
of Security Holders
|
|
Market for the Registrant's
Common Equity, Related Shareowner Matters, and Issuer Purchases of Equity
Securities
|
|
2007
|
2006
|
|||||||||||||||||||||||||||||||
|
Fourth
Qtr.
|
Third
Qtr.
|
Second
Qtr.
|
First
Qtr.
|
Fourth
Qtr.
|
Third
Qtr.
|
Second
Qtr.
|
First
Qtr.
|
|||||||||||||||||||||||||
|
Common
stock price:
|
||||||||||||||||||||||||||||||||
|
High
|
$ | 34.00 | $ | 36.40 | $ | 33.69 | $ | 35.91 | $ | 35.98 | $ | 33.25 | $ | 35.39 | $ | 37.97 | ||||||||||||||||
|
Low
|
24.60 | 27.69 | 29.12 | 29.79 | 30.14 | 29.87 | 29.51 | 33.79 | ||||||||||||||||||||||||
|
Close
|
28.22 | 31.20 | 31.34 | 33.30 | 35.30 | 31.10 | 30.20 | 35.55 | ||||||||||||||||||||||||
|
Cash
dividends declared per share
|
.1850 | .1750 | .1750 | .1750 | .1750 | .1625 | .1625 | .1625 | ||||||||||||||||||||||||
|
Period
|
Total
number
of
shares
purchased
|
Average
price
paid
per
share
|
Total
number of
shares
purchased as
part
of our share
repurchase program(1)
|
Maximum
Number
of
shares that
may
yet be purchased
under
our share
repurchase
program
|
|||||
|
October
1, 2007 to
October
31, 2007
|
69,338
|
$29.44
|
1,905,716
|
766,159
|
|||||
|
November
1, 2007 to
November
30, 2007
|
222,004
|
26.86
|
2,119,720
|
552,155
|
|||||
|
December
1, 2007 to
December
31, 2007
|
164,481
|
29.72
|
2,284,201
|
387,674
|
|||||
|
Total
|
455,823
|
$28.28
|
2,284,201
|
387,674
|
|||||
|
(1)
|
This
balance represents the number of shares that were repurchased through the
Capital City Bank Group, Inc. Share Repurchase Program (the “Program”),
which was approved on March 30, 2000, and modified by our Board on January
24, 2002, March 22, 2007, and November 11, 2007 under which we were
authorized to repurchase up to 2,671,875 shares of our common
stock. The Program is flexible and shares are acquired from the
public markets and other sources using free cash flow. There is
no predetermined expiration date for the Program. No shares are
repurchased outside of the Program. In November 2007, 8,000
shares were purchased by an affiliated purchaser that was outside of the
Program.
|
|
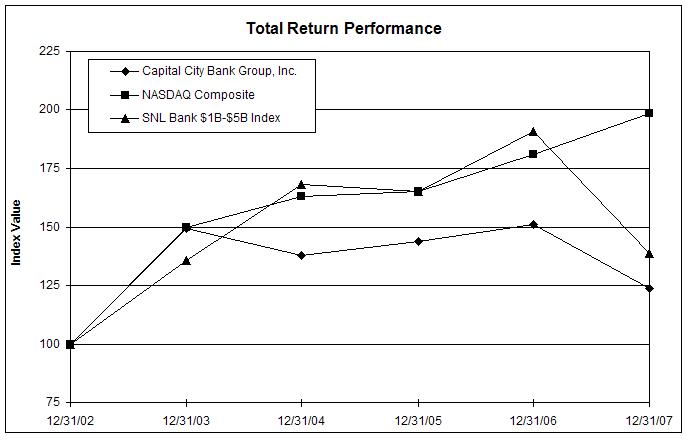
Period
Ending
|
||||||||||||||||||
|
Index
|
12/31/02
|
12/31/03
|
12/31/04
|
12/31/05
|
12/31/06
|
12/31/07
|
||||||||||||
|
Capital
City Bank Group, Inc.
|
$ | 100.00 | $ | 149.36 | $ | 138.15 | $ | 144.18 | $ | 151.39 | $ | 123.89 | ||||||
|
NASDAQ
Composite
|
100.00 | 150.01 | 162.89 | 165.13 | 180.85 | 198.60 | ||||||||||||
|
SNL
$1B-$5B Bank Index
|
100.00 | 135.99 | 167.83 | 164.97 | 190.90 | 139.06 | ||||||||||||
|
Item 6. Selected
Financial Data
|
|
|
For
the Years Ended December 31,
|
||||||||||||||||||||
|
(Dollars in Thousands, Except
Per Share Data)(1)
(3)
|
2007
|
2006
|
2005
|
2004
|
2003
|
|||||||||||||||
|
Interest
Income
|
$ | 165,323 | $ | 165,893 | $ | 140,053 | $ | 101,525 | $ | 94,830 | ||||||||||
|
Net
Interest Income
|
112,241 | 119,136 | 109,990 | 86,084 | 79,991 | |||||||||||||||
|
Provision
for Loan Losses
|
6,163 | 1,959 | 2,507 | 2,141 | 3,436 | |||||||||||||||
|
Net
Income
|
29,683 | 33,265 | 30,281 | 29,371 | 25,193 | |||||||||||||||
|
Per
Common Share:
|
||||||||||||||||||||
|
Basic
Net Income
|
$ | 1.66 | $ | 1.79 | $ | 1.66 | $ | 1.74 | $ | 1.53 | ||||||||||
|
Diluted
Net Income
|
1.66 | 1.79 | 1.66 | 1.74 | 1.52 | |||||||||||||||
|
Cash
Dividends Declared
|
.710 | .663 | .619 | .584 | .525 | |||||||||||||||
|
Book
Value
|
17.03 | 17.01 | 16.39 | 14.51 | 15.27 | |||||||||||||||
|
Key
Performance Ratios:
|
||||||||||||||||||||
|
Return
on Average Assets
|
1.18 | % | 1.29 | % | 1.22 | % | 1.46 | % | 1.40 | % | ||||||||||
|
Return
on Average Equity
|
9.68 | 10.48 | 10.56 | 13.31 | 12.82 | |||||||||||||||
|
Net
Interest Margin (FTE)
|
5.25 | 5.35 | 5.09 | 4.88 | 5.01 | |||||||||||||||
|
Dividend
Pay-Out Ratio
|
42.77 | 37.01 | 37.35 | 33.62 | 34.51 | |||||||||||||||
|
Equity
to Assets Ratio
|
11.19 | 12.15 | 11.65 | 10.86 | 10.98 | |||||||||||||||
|
Asset
Quality:
|
||||||||||||||||||||
|
Allowance
for Loan Losses
|
$ | 18,066 | $ | 17,217 | $ | 17,410 | $ | 16,037 | $ | 12,429 | ||||||||||
|
Allowance
for Loan Losses to Loans
|
0.95 | % | 0.86 | % | 0.84 | % | 0.88 | % | 0.93 | % | ||||||||||
|
Nonperforming
Assets
|
28,163 | 8,731 | 5,550 | 5,271 | 7,301 | |||||||||||||||
|
Nonperforming
Assets to Loans + ORE
|
1.47 | 0.44 | 0.27 | 0.29 | 0.54 | |||||||||||||||
|
Allowance
to Nonperforming Loans
|
71.92 | 214.09 | 331.11 | 345.18 | 529.80 | |||||||||||||||
|
Net
Charge-Offs to Average Loans
|
0.27 | 0.11 | 0.13 | 0.22 | 0.27 | |||||||||||||||
|
Averages
for the Year:
|
||||||||||||||||||||
|
Loans,
Net
|
$ | 1,934,850 | $ | 2,029,397 | $ | 1,968,289 | $ | 1,538,744 | $ | 1,318,080 | ||||||||||
|
Earning
Assets
|
2,183,528 | 2,258,277 | 2,187,672 | 1,789,843 | 1,624,680 | |||||||||||||||
|
Total
Assets
|
2,507,217 | 2,581,078 | 2,486,733 | 2,006,745 | 1,804,895 | |||||||||||||||
|
Deposits
|
1,990,446 | 2,034,931 | 1,954,888 | 1,599,201 | 1,431,808 | |||||||||||||||
|
Subordinated
Notes
|
62,887 | 62,887 | 50,717 | 5,155 | - | |||||||||||||||
|
Long-Term
Borrowings
|
37,936 | 57,260 | 70,216 | 59,462 | 55,594 | |||||||||||||||
|
Shareowners'
Equity
|
306,617 | 317,336 | 286,712 | 220,731 | 196,588 | |||||||||||||||
|
Year-End
Balances:
|
||||||||||||||||||||
|
Loans,
Net
|
$ | 1,915,850 | $ | 1,999,721 | $ | 2,067,494 | $ | 1,828,825 | $ | 1,341,632 | ||||||||||
|
Earning
Assets
|
2,272,829 | 2,270,410 | 2,299,677 | 2,113,571 | 1,648,818 | |||||||||||||||
|
Total
Assets
|
2,616,327 | 2,597,910 | 2,625,462 | 2,364,013 | 1,846,502 | |||||||||||||||
|
Deposits
|
2,142,344 | 2,081,654 | 2,079,346 | 1,894,886 | 1,474,205 | |||||||||||||||
|
Subordinated
Notes
|
62,887 | 62,887 | 62,887 | 30,928 | - | |||||||||||||||
|
Long-Term
Borrowings
|
26,731 | 43,083 | 69,630 | 68,453 | 46,475 | |||||||||||||||
|
Shareowners'
Equity
|
292,675 | 315,770 | 305,776 | 256,800 | 202,809 | |||||||||||||||
|
Other
Data:
|
||||||||||||||||||||
|
Basic
Average Shares Outstanding
|
17,909,396 | 18,584,519 | 18,263,855 | 16,805,696 | 16,528,109 | |||||||||||||||
|
Diluted
Average Shares Outstanding
|
17,911,587 | 18,609,839 | 18,281,243 | 16,810,926 | 16,563,986 | |||||||||||||||
|
Shareowners
of Record(2)
|
1,750 | 1,805 | 1,716 | 1,598 | 1,512 | |||||||||||||||
|
Banking
Locations(2)
|
70 | 69 | 69 | 60 | 57 | |||||||||||||||
|
Full-Time
Equivalent Associates(2)
|
1,097 | 1,056 | 1,013 | 926 | 795 | |||||||||||||||
|
(1)
|
All
share and per share data have been adjusted to reflect the 5-for-4 stock
split effective July 1, 2005, and the 5-for-4 stock split effective June
13, 2003.
|
|
(2)
|
As
of the record date. The record date is on or about March 1st of the
following year.
|
|
(3)
|
The consolidated financial
statements reflect the acquisitions of Quincy State Bank on March 19,
2004, Farmers and Merchants Bank of Dublin on October 15, 2004, and First
Alachua Banking Corporation on May 20,
2005.
|
|
Management's Discussion and
Analysis of Financial Condition and Results of
Operations
|
|
For
the Years Ended December 31,
|
||||||||||||
|
2007
|
2006
|
2005
|
||||||||||
|
Efficiency
ratio
|
70.13 | % | 68.87 | % | 68.46 | % | ||||||
|
Effect
of intangible amortization and merger expenses
|
(3.36 | )% | (3.45 | )% | (3.67 | )% | ||||||
|
Operating
efficiency ratio
|
66.77 | % | 65.42 | % | 64.79 | % | ||||||
|
For
the Years Ended December 31,
|
||||||||||||
|
2007
|
2006
|
2005
|
||||||||||
|
Net
noninterest expense as a percent of average assets
|
2.50 | % | 2.56 | % | 2.44 | % | ||||||
|
Effect
of intangible amortization and merger expenses
|
(0.13 | )% | (0.24 | )% | (0.24 | )% | ||||||
|
Operating
net noninterest expense as a percent of average assets
|
2.37 | % | 2.32 | % | 2.20 | % | ||||||
|
§
|
2007
earnings of $29.7 million, or $1.66 per diluted share, decreases of 10.8%
and 7.3%, respectively, over
2006.
|
|
§
|
Decline
in earnings was attributable to lower net interest income and a higher
loan loss provision, partially offset by an increase in noninterest
income.
|
|
§
|
Tax
equivalent net interest income fell 5.2% over 2006 due to higher interest
expense driven by higher average rates and an unfavorable shift in deposit
mix as clients sought higher yielding deposit products, and a $75.0
million reduction in the level of average earning
assets.
|
|
§
|
Net
interest margin percentage declined 10 basis points from 2006 driven by
both a higher cost of funds and an increase in foregone interest income
associated with a higher level of nonperforming
assets.
|
|
§
|
Noninterest
income grew 6.7% over 2006 due primarily to higher deposit fees, data
processing fees, and card fees.
|
|
§
|
Noninterest
expense was very well controlled during the year and increased only .35%
from 2006, including a litigation reserve accrual of $1.9
million related to lawsuits filed against Visa
U.S.A.
|
|
§
|
Loan
loss provision increased $4.2 million from 2006 due to a higher level of
net charge-offs ($5.3 million, or .27% of average loans in 2007) and a
higher level of required reserves reflective of the current credit
environment that has been impacted by a slowdown in housing and real
estate markets. At year-end 2007, the allowance for loan losses
was .95% of outstanding loans and provided coverage of 72% of
nonperforming loans.
|
|
§
|
Share
repurchase activity continued in 2007 with 1,404,364 shares being
repurchased during the year. We remain well-capitalized with a
risk based capital ratio of 14.05%.
|
|
For
the Years Ended December 31,
|
||||||||||
|
(Dollars in Thousands, Except
Per Share Data)(1)
|
2007
|
2006
|
2005
|
|||||||
|
Interest
Income
|
$
|
165,323
|
$
|
165,893
|
$
|
140,053
|
||||
|
Taxable
Equivalent Adjustments
|
2,420
|
1,812
|
1,222
|
|||||||
|
Total
Interest Income (FTE)
|
167,743
|
167,705
|
141,275
|
|||||||
|
Interest
Expense
|
53,082
|
46,757
|
30,063
|
|||||||
|
Net
Interest Income (FTE)
|
114,661
|
120,948
|
111,212
|
|||||||
|
Provision
for Loan Losses
|
6,163
|
1,959
|
2,507
|
|||||||
|
Taxable
Equivalent Adjustments
|
2,420
|
1,812
|
1,222
|
|||||||
|
Net
Interest Income After Provision for Loan Losses
|
106,078
|
117,177
|
107,483
|
|||||||
|
Noninterest
Income
|
59,300
|
55,577
|
49,198
|
|||||||
|
Noninterest
Expense
|
121,992
|
121,568
|
109,814
|
|||||||
|
Income
Before Income Taxes
|
43,386
|
51,186
|
46,867
|
|||||||
|
Income
Taxes
|
13,703
|
17,921
|
16,586
|
|||||||
|
Net
Income
|
$
|
29,683
|
$
|
33,265
|
$
|
30,281
|
||||
|
Basic
Net Income Per Share
|
$
|
1.66
|
$
|
1.79
|
$
|
1.66
|
||||
|
Diluted
Net Income Per Share
|
$
|
1.66
|
$
|
1.79
|
$
|
1.66
|
||||
|
(1)
|
All share and per share data have
been adjusted to reflect the 5-for-4 stock split effective July 1,
2005.
|
|
2007
|
2006
|
2005
|
||||||||||||||||||||||||||
|
(Taxable
Equivalent Basis - Dollars in Thousands)
|
Balance
|
Interest
|
Rate
|
Balance
|
Interest
|
Rate
|
Balance
|
Interest
|
Rate
|
|||||||||||||||||||
|
ASSETS
|
||||||||||||||||||||||||||||
|
Loans,
Net of Unearned Interest(1)(2)
|
$
|
1,934,850
|
$
|
155,434
|
8.03
|
%
|
$
|
2,029,397
|
$
|
157,227
|
7.75
|
%
|
$
|
1,968,289
|
$
|
133,665
|
6.79
|
%
|
||||||||||
|
Taxable
Investment Securities
|
103,840
|
4,949
|
4.76
|
112,392
|
4,851
|
4.31
|
142,406
|
4,250
|
2.98
|
|||||||||||||||||||
|
Tax-Exempt
Investment Securities(2)
|
84,849
|
4,447
|
5.24
|
74,634
|
3,588
|
4.81
|
49,252
|
2,369
|
4.81
|
|||||||||||||||||||
|
Funds
Sold
|
59,989
|
2,913
|
4.79
|
41,854
|
2,039
|
4.81
|
27,725
|
991
|
3.53
|
|||||||||||||||||||
|
Total
Earning Assets
|
2,183,528
|
167,743
|
7.68
|
%
|
2,258,277
|
167,705
|
7.42
|
%
|
2,187,672
|
141,275
|
6.46
|
%
|
||||||||||||||||
|
Cash
& Due From Banks
|
86,692
|
100,237
|
105,787
|
|||||||||||||||||||||||||
|
Allowance
for Loan Losses
|
(17,535
|
)
|
(17,486
|
)
|
(17,081
|
)
|
||||||||||||||||||||||
|
Other
Assets
|
254,532
|
240,050
|
210,355
|
|||||||||||||||||||||||||
|
TOTAL
ASSETS
|
$
|
2,507,217
|
$
|
2,581,078
|
$
|
2,486,733
|
||||||||||||||||||||||
|
LIABILITIES
|
||||||||||||||||||||||||||||
|
NOW
Accounts
|
$
|
$557,060
|
$
|
10,748
|
1.93
|
%
|
$
|
518,671
|
$
|
7,658
|
1.48
|
%
|
$
|
430,601
|
$
|
2,868
|
.67
|
%
|
||||||||||
|
Money
Market Accounts
|
397,193
|
13,667
|
3.44
|
370,257
|
11,687
|
3.16
|
275,830
|
4,337
|
1.57
|
|||||||||||||||||||
|
Savings
Accounts
|
119,700
|
279
|
0.23
|
134,033
|
278
|
0.21
|
152,890
|
292
|
0.19
|
|||||||||||||||||||
|
Other
Time Deposits
|
474,728
|
19,993
|
4.21
|
507,283
|
17,630
|
3.48
|
550,821
|
13,637
|
2.48
|
|||||||||||||||||||
|
Total
Interest Bearing Deposits
|
1,548,681
|
44,687
|
2.89
|
%
|
1,530,244
|
37,253
|
2.43
|
%
|
1,410,142
|
21,134
|
1.50
|
%
|
||||||||||||||||
|
Short-Term
Borrowings
|
66,397
|
2,871
|
4.31
|
78,700
|
3,074
|
3.89
|
97,863
|
2,854
|
2.92
|
|||||||||||||||||||
|
Subordinated
Notes Payable
|
62,887
|
3,730
|
5.93
|
62,887
|
3,725
|
5.92
|
50,717
|
2,981
|
5.88
|
|||||||||||||||||||
|
Other
Long-Term Borrowings
|
37,936
|
1,794
|
4.73
|
57,260
|
2,705
|
4.72
|
70,216
|
3,094
|
4.41
|
|||||||||||||||||||
|
Total
Interest Bearing Liabilities
|
1,715,901
|
53,082
|
3.09
|
%
|
1,729,091
|
46,757
|
2.70
|
%
|
1,628,938
|
30,063
|
1.85
|
%
|
||||||||||||||||
|
Noninterest
Bearing Deposits
|
441,765
|
504,687
|
544,746
|
|||||||||||||||||||||||||
|
Other
Liabilities
|
42,934
|
29,964
|
26,337
|
|||||||||||||||||||||||||
|
TOTAL
LIABILITIES
|
2,200,600
|
2,263,742
|
2,200,021
|
|||||||||||||||||||||||||
|
SHAREOWNERS'
EQUITY
|
||||||||||||||||||||||||||||
|
TOTAL
SHAREOWNERS' EQUITY
|
306,617
|
317,336
|
286,712
|
|||||||||||||||||||||||||
|
TOTAL
LIABILITIES & EQUITY
|
$
|
2,507,217
|
$
|
2,581,078
|
$
|
2,486,733
|
||||||||||||||||||||||
|
Interest
Rate Spread
|
4.59
|
%
|
4.72
|
%
|
4.61
|
%
|
||||||||||||||||||||||
|
Net
Interest Income
|
$
|
114,661
|
$
|
120,948
|
$
|
111,212
|
||||||||||||||||||||||
|
Net
Interest Margin(3)
|
5.25
|
%
|
5.35
|
%
|
5.09
|
%
|
||||||||||||||||||||||
|
(1)
|
Average
balances include nonaccrual loans. Interest income includes
loan fees of $3.0 million, $3.8 million, and $3.1 million in 2007, 2006,
and 2005, respectively.
|
|
(2)
|
Interest
income includes the effects of taxable equivalent adjustments using a 35%
tax rate.
|
|
(3)
|
Taxable
equivalent net interest income divided by average earning
assets.
|
|
2007
Changes From 2006
|
2006
Changes From 2005
|
||||||||||||||||||
|
Due
to Average
|
Due
to Average
|
||||||||||||||||||
|
(Taxable
Equivalent Basis - Dollars in Thousands)
|
Total
|
Volume
|
Rate
|
Total
|
Volume
|
Rate
|
|||||||||||||
|
Earning
Assets:
|
|||||||||||||||||||
|
Loans,
Net of Unearned Interest (2)
|
$
|
(1,792
|
)
|
$
|
(7,465
|
)
|
$
|
5,673
|
$
|
23,562
|
$
|
5,760
|
$
|
17,802
|
|||||
|
Investment
Securities:
|
|||||||||||||||||||
|
Taxable
|
99
|
(350
|
)
|
449
|
601
|
(689
|
)
|
1,290
|
|||||||||||
|
Tax-Exempt
(2)
|
858
|
491
|
367
|
1,219
|
1,220
|
(1
|
)
|
||||||||||||
|
Funds
Sold
|
873
|
883
|
(10
|
)
|
1,048
|
444
|
604
|
||||||||||||
|
Total
|
38
|
(6,441
|
)
|
6,479
|
26,430
|
6,735
|
19,695
|
||||||||||||
|
Interest
Bearing Liabilities:
|
|||||||||||||||||||
|
NOW
Accounts
|
3,090
|
567
|
2,523
|
4,790
|
586
|
4,204
|
|||||||||||||
|
Money
Market Accounts
|
1,979
|
850
|
1,129
|
7,350
|
1,485
|
5,865
|
|||||||||||||
|
Savings
Accounts
|
2
|
(29
|
)
|
31
|
(14
|
)
|
(36
|
)
|
22
|
||||||||||
|
Time
Deposits
|
2,364
|
(1,131
|
)
|
3,495
|
3,993
|
(1,078
|
)
|
5,071
|
|||||||||||
|
Short-Term
Borrowings
|
(204)
|
(424
|
)
|
220
|
221
|
(586
|
)
|
807
|
|||||||||||
|
Subordinated
Notes Payable
|
5
|
0
|
5
|
744
|
715
|
29
|
|||||||||||||
|
Long-Term
Borrowings
|
(911
|
)
|
(913
|
)
|
2
|
(390
|
)
|
(571
|
)
|
181
|
|||||||||
|
Total
|
6,325
|
(1,080
|
)
|
7,405
|
16,694
|
515
|
16,179
|
||||||||||||
|
Changes
in Net Interest Income
|
$
|
(6,287
|
)
|
$
|
(5,361
|
)
|
$
|
(926
|
)
|
$
|
9,736
|
$
|
6,220
|
$
|
3,516
|
||||
|
(1)
|
This
table shows the change in taxable equivalent net interest income for
comparative periods based on either changes in average volume or changes
in average rates for earning assets and interest bearing liabilities.
Changes which are not solely due to volume changes or solely due to rate
changes have been attributed to rate
changes.
|
|
(2)
|
Interest
income includes the effects of taxable equivalent adjustments using a 35%
tax rate to adjust interest on tax-exempt loans and securities to a
taxable equivalent basis.
|
|
For
the Years Ended December 31,
|
|||||||||
|
(Dollars
in Thousands)
|
2007
|
2006
|
2005
|
||||||
|
Noninterest
Income:
|
|||||||||
|
Service
Charges on Deposit Accounts
|
$ | 26,130 | $ | 24,620 | $ | 20,740 | |||
|
Data
Processing
|
3,133 | 2,723 | 2,610 | ||||||
|
Asset
Management Fees
|
4,700 | 4,600 | 4,419 | ||||||
|
Retail
Brokerage Fees
|
2,510 | 2,091 | 1,322 | ||||||
|
Gain/(Loss)
on Sale/Call of Investment Securities
|
14 | (4 | ) | 9 | |||||
|
Mortgage
Banking Revenues
|
2,596 | 3,235 | 4,072 | ||||||
|
Merchant
Fees(1)
|
7,257 | 6,978 | 6,174 | ||||||
|
Interchange
Fees(1)
|
3,757 | 3,105 | 2,239 | ||||||
|
ATM/Debit
Card Fees(1)
|
2,692 | 2,519 | 2,206 | ||||||
|
Other
|
6,511 | 5,710 | 5,407 | ||||||
|
Total
Noninterest Income
|
$ | 59,300 | $ | 55,577 | $ | 49,198 | |||
|
For
the Years Ended December 31,
|
||||||||||
|
(Dollars
in Thousands)
|
2007
|
2006
|
2005
|
|||||||
|
Noninterest
Expense:
|
||||||||||
|
Salaries
|
$ | 49,206 | $ | 46,604 | $ | 40,978 | ||||
|
Associate
Benefits
|
11,073 | 14,251 | 12,709 | |||||||
|
Total
Compensation
|
60,279 | 60,855 | 53,687 | |||||||
|
Premises
|
9,347 | 9,395 | 8,293 | |||||||
|
Equipment
|
9,890 | 9,911 | 8,970 | |||||||
|
Total
Occupancy
|
19,237 | 19,306 | 17,263 | |||||||
|
Legal
Fees
|
1,739 | 1,734 | 1,827 | |||||||
|
Professional
Fees
|
3,855 | 3,402 | 3,825 | |||||||
|
Processing
Services
|
1,994 | 1,863 | 1,481 | |||||||
|
Advertising
|
3,742 | 4,285 | 4,275 | |||||||
|
Travel
and Entertainment
|
1,470 | 1,664 | 1,414 | |||||||
|
Printing
and Supplies
|
2,124 | 2,472 | 2,372 | |||||||
|
Telephone
|
2,373 | 2,323 | 2,493 | |||||||
|
Postage
|
1,565 | 1,145 | 1,195 | |||||||
|
Intangible
Amortization
|
5,834 | 6,085 | 5,440 | |||||||
|
Merger
Expense
|
- | - | 438 | |||||||
|
Interchange
Fees
|
6,118 | 6,010 | 5,402 | |||||||
|
Courier
Service
|
641 | 1,307 | 1,360 | |||||||
|
Miscellaneous
|
11,021 | 9,117 | 7,342 | |||||||
|
Total
Other
|
42,476 | 41,407 | 38,864 | |||||||
|
Total
Noninterest Expense
|
$ | 121,992 | $ | 121,568 | $ | 109,814 | ||||
|
2006
to
|
Percentage
|
Components
of
|
||||||||||||||||||
|
2007
|
Of
Total
|
Average Earning Assets
|
||||||||||||||||||
|
(Average
Balances – Dollars In Thousands)
|
Change
|
Change
|
2007
|
2006
|
2005
|
|||||||||||||||
|
Loans:
|
||||||||||||||||||||
|
Commercial,
Financial, and Agricultural
|
(12,244 | ) | (16.0 | )% | 9.5 | % | 9.7 | % | 9.5 | % | ||||||||||
|
Real
Estate – Construction
|
(15,711 | ) | (21.0 | )% | 7.3 | % | 7.8 | % | 6.9 | % | ||||||||||
|
Real
Estate – Commercial
|
(29,417 | ) | (39.0 | )% | 29.2 | % | 29.5 | % | 31.4 | % | ||||||||||
|
Real
Estate – Residential
|
(38,282 | ) | (51.0 | )% | 31.5 | % | 32.2 | % | 31.3 | % | ||||||||||
|
Consumer
|
1,107 | 1.0 | % | 11.2 | % | 10.7 | % | 10.9 | % | |||||||||||
|
Total
Loans
|
(94,547 | ) | (126.00 | )% | 88.7 | % | 89.9 | % | 90.0 | % | ||||||||||
|
Investment
Securities:
|
||||||||||||||||||||
|
Taxable
|
(8,552 | ) | (12.0 | )% | 4.8 | % | 5.0 | % | 6.5 | % | ||||||||||
|
Tax-Exempt
|
10,215 | 14.0 | % | 3.8 | % | 3.2 | % | 2.3 | % | |||||||||||
|
Total
Securities
|
1,663 | 2.0 | % | 8.6 | % | 8.2 | % | 8.8 | % | |||||||||||
|
Funds
Sold
|
18,135 | 24.0 | % | 2.7 | % | 1.9 | % | 1.2 | % | |||||||||||
|
Total
Earning Assets
|
$ | (74,749 | ) | 100.0 | % | 100.0 | % | 100.0 | % | 100.0 | % | |||||||||
|
As
of December 31,
|
|||||||||||||||
|
(Dollars
in Thousands)
|
2007
|
2006
|
2005
|
2004
|
2003
|
||||||||||
|
Commercial,
Financial and Agricultural
|
$ | 208,864 | $ | 229,327 | $ | 218,434 | $ | 206,474 | $ | 160,048 | |||||
|
Real
Estate - Construction
|
142,248 | 179,072 | 160,914 | 140,190 | 89,149 | ||||||||||
|
Real
Estate - Commercial
|
634,920 | 643,885 | 718,741 | 655,426 | 391,250 | ||||||||||
|
Real
Estate - Residential
|
680,800 | 709,735 | 723,336 | 600,375 | 467,790 | ||||||||||
|
Consumer
|
249,018 | 237,702 | 246,069 | 226,360 | 233,395 | ||||||||||
|
Total
Loans, Net of Unearned Interest
|
$ | 1,915,850 | $ | 1,999,721 | $ | 2,067,494 | $ | 1,828,825 | $ | 1,341,632 | |||||
|
Maturity
Periods
|
||||||||||||
|
(Dollars
in Thousands)
|
One
Year
or
Less
|
Over
One
Through
Five
Years
|
Over
Five
Years
|
Total
|
||||||||
|
Commercial,
Financial and Agricultural
|
$ | 83,469 | $ | 93,283 | $ | 32,112 | $ | 208,864 | ||||
|
Real
Estate
|
377,077 | 224,994 | 855,897 | 1,457,968 | ||||||||
|
Consumer(1)
|
31,134 | 208,611 | 9,273 | 249,018 | ||||||||
|
Total
|
$ | 491,680 | $ | 526,888 | $ | 897,282 | $ | 1,915,850 | ||||
|
Loans
with Fixed Rates
|
$ | 321,011 | $ | 346,198 | $ | 31,206 | $ | 698,415 | ||||
|
Loans
with Floating or Adjustable Rates
|
170,669 | 180,690 | 866,076 | 1,217,435 | ||||||||
|
Total
|
$ | 491,680 | $ | 526,888 | $ | 897,282 | $ | 1,915,850 | ||||
|
(1)
|
Demand loans and overdrafts are
reported in the category of one year or
less.
|
|
For
the Years Ended December 31,
|
|||||||||||||||||||
|
(Dollars
in Thousands)
|
2007
|
2006
|
2005
|
2004
|
2003
|
||||||||||||||
|
Balance
at Beginning of Year
|
$ | 17,217 | $ | 17,410 | $ | 16,037 | $ | 12,429 | $ | 12,495 | |||||||||
|
Acquired
Reserves
|
- | - | 1,385 | 5,713 | - | ||||||||||||||
|
Reserve
Reversal(1)
|
- | - | - | (800 | ) | - | |||||||||||||
|
Charge-Offs:
|
|||||||||||||||||||
|
Commercial,
Financial and Agricultural
|
1,462 | 841 | 1,287 | 873 | 426 | ||||||||||||||
|
Real
Estate - Construction
|
166 | - | - | - | - | ||||||||||||||
|
Real
Estate - Commercial
|
709 | 346 | 255 | 48 | 91 | ||||||||||||||
|
Real
Estate - Residential
|
1,429 | 280 | 321 | 191 | 228 | ||||||||||||||
|
Consumer
|
3,451 | 2,516 | 2,380 | 3,946 | 3,794 | ||||||||||||||
|
Total
Charge-Offs
|
7,217 | 3,983 | 4,243 | 5,058 | 4,539 | ||||||||||||||
|
Recoveries:
|
|||||||||||||||||||
|
Commercial,
Financial and Agricultural
|
174 | 246 | 180 | 81 | 142 | ||||||||||||||
|
Real
Estate - Construction
|
- | - | - | - | - | ||||||||||||||
|
Real
Estate - Commercial
|
14 | 17 | 3 | 14 | - | ||||||||||||||
|
Real
Estate - Residential
|
36 | 11 | 37 | 188 | 18 | ||||||||||||||
|
Consumer
|
1,679 | 1,557 | 1,504 | 1,329 | 877 | ||||||||||||||
|
Total
Recoveries
|
1,903 | 1,831 | 1,724 | 1,612 | 1,037 | ||||||||||||||
|
Net
Charge-Offs
|
5,314 | 2,152 | 2,519 | 3,446 | 3,502 | ||||||||||||||
|
Provision
for Loan Losses
|
6,163 | 1,959 | 2,507 | 2,141 | 3,436 | ||||||||||||||
|
Balance
at End of Year
|
$ | 18,066 | $ | 17,217 | $ | 17,410 | $ | 16,037 | $ | 12,429 | |||||||||
|
Ratio
of Net Charge-Offs to Average Loans Outstanding
|
.27 | % | .11 | % | .13 | % | .22 | % | .27 | % | |||||||||
|
Allowance
for Loan Losses as a Percent of Loans at End of Year
|
.94 | % | .86 | % | .84 | % | .88 | % | .93 | % | |||||||||
|
Allowance
for Loan Losses as a Multiple of Net Charge-Offs
|
3.40 | x | 8.00 | x | 6.91 | x | 4.65 | x | 3.55 | x | |||||||||
|
(1)
|
Reflects recapture of reserves
allocated to the credit card portfolio sold in August
2004.
|
|
2007
|
2006
|
2005
|
2004
|
2003
|
||||||||||||||||||||||||||
|
(Dollars
in Thousands)
|
Allowance
Amount
|
Percent
of
Loans
in
Each
Category
To
Total
Loans
|
Allowance
Amount
|
Percent
of
Loans
in
Each
Category
To
Total
Loans
|
Allowance
Amount
|
Percent
of
Loans
in
Each
Category
To
Total
Loans
|
Allowance
Amount
|
Percent
of
Loans
in
Each
Category
To
Total
Loans
|
Allowance
Amount
|
Percent
of
Loans
in
Each
Category
To
Total
Loans
|
||||||||||||||||||||
|
Commercial,
Financial and Agricultural
|
$
|
$3,106
|
10.9
|
%
|
$
|
3,900
|
11.5
|
%
|
$
|
3,663
|
10.6
|
%
|
$
|
4,341
|
11.3
|
%
|
$
|
2,824
|
11.9
|
%
|
||||||||||
|
Real
Estate:
|
||||||||||||||||||||||||||||||
|
Construction
|
3,117
|
7.4
|
745
|
9.0
|
762
|
7.8
|
578
|
7.7
|
313
|
6.6
|
||||||||||||||||||||
|
Commercial
|
4,372
|
33.1
|
5,996
|
32.2
|
6,352
|
34.7
|
6,296
|
35.8
|
2,831
|
29.2
|
||||||||||||||||||||
|
Residential
|
3,733
|
35.6
|
1,050
|
35.5
|
1,019
|
35.0
|
705
|
32.8
|
853
|
34.9
|
||||||||||||||||||||
|
Consumer
|
2,790
|
13.0
|
3,081
|
11.8
|
3,105
|
11.9
|
2,966
|
12.4
|
4,169
|
17.4
|
||||||||||||||||||||
|
Not
Allocated
|
948
|
-
|
2,445
|
-
|
2,509
|
-
|
1,151
|
-
|
1,439
|
-
|
||||||||||||||||||||
|
Total
|
$
|
$18,066
|
100.0
|
%
|
$
|
17,217
|
100.0
|
%
|
$
|
17,410
|
100.0
|
%
|
$
|
16,037
|
100.0
|
%
|
$
|
12,429
|
100.0
|
%
|
||||||||||
|
As
of December 31,
|
|||||||||||||||||||
|
(Dollars
in Thousands)
|
2007
|
2006
|
2005
|
2004
|
2003
|
||||||||||||||
|
Nonaccruing
Loans
|
$ | 25,119 | $ | 8,042 | $ | 5,258 | $ | 4,646 | $ | 2,346 | |||||||||
|
Restructured
|
- | - | - | - | - | ||||||||||||||
|
Total
Nonperforming Loans
|
25,119 | 8,042 | 5,258 | 4,646 | 2,346 | ||||||||||||||
|
Other
Real Estate Owned
|
3,043 | 689 | 292 | 625 | 4,955 | ||||||||||||||
|
Total
Nonperforming Assets
|
$ | 28,162 | $ | 8,731 | $ | 5,550 | $ | 5,271 | $ | 7,301 | |||||||||
|
Past
Due 90 Days or More
|
416 | 135 | 309 | $ | 605 | $ | 328 | ||||||||||||
|
Nonperforming
Loans/Loans
|
1.31 | % | .40 | % | .25 | % | .25 | % | .17 | % | |||||||||
|
Nonperforming
Assets/Loans Plus Other Real Estate
|
1.47 | % | .44 | % | .27 | % | .29 | % | .54 | % | |||||||||
|
Nonperforming
Assets/Capital(1)
|
9.06 | % | 2.62 | % | 1.72 | % | 1.93 | % | 3.39 | % | |||||||||
|
Allowance/Nonperforming
Loans
|
71.92 | % | 214.09 | % | 331.11 | % | 345.18 | % | 529.80 | % | |||||||||
|
(1)
|
For computation of this
percentage, "Capital" refers to shareowners' equity plus the allowance for
loan losses.
|
|
As
of December 31,
|
||||||||||||||||||||||||||||
|
2007
|
2006
|
2005
|
||||||||||||||||||||||||||
|
(Dollars
in Thousands)
|
Amortized
Cost
|
Market
Value
|
Weighted(1)
Average
Yield
|
Amortized
Cost
|
Market
Value
|
Weighted(1)
Average
Yield
|
Amortized
Cost
|
Market
Value
|
Weighted(1)
Average
Yield
|
|||||||||||||||||||
|
U.S.
GOVERNMENTS
|
||||||||||||||||||||||||||||
|
Due
in 1 year or less
|
$
|
36,441
|
$
|
36,570
|
4.62
|
%
|
$
|
17,329
|
$
|
17,150
|
3.45
|
%
|
$
|
58,032
|
$
|
57,621
|
2.30
|
%
|
||||||||||
|
Due
over 1 year through 5 years
|
25,264
|
25,493
|
4.46
|
56,388
|
55,978
|
4.64
|
24,296
|
23,662
|
3.52
|
|||||||||||||||||||
|
Due
over 5 years through 10 years
|
-
|
-
|
-
|
-
|
-
|
-
|
1,970
|
1,948
|
3.57
|
|||||||||||||||||||
|
Due
over 10 years
|
-
|
-
|
-
|
-
|
-
|
-
|
-
|
-
|
-
|
|||||||||||||||||||
|
TOTAL
|
61,705
|
62,063
|
4.56%
|
73,717
|
73,128
|
4.36
|
84,298
|
83,231
|
2.68
|
|||||||||||||||||||
|
STATES
& POLITICAL SUBDIVISIONS
|
||||||||||||||||||||||||||||
|
Due
in 1 year or less
|
25,675
|
25,697
|
5.19
|
31,438
|
31,300
|
4.21
|
21,097
|
21,048
|
4.66
|
|||||||||||||||||||
|
Due
over 1 year through 5 years
|
64,339
|
64,304
|
5.38
|
52,183
|
51,922
|
5.25
|
32,130
|
31,702
|
4.11
|
|||||||||||||||||||
|
Due
over 5 years through 10 years
|
-
|
-
|
-
|
-
|
-
|
-
|
384
|
393
|
6.53
|
|||||||||||||||||||
|
Due
over 10 years
|
-
|
-
|
-
|
-
|
-
|
-
|
-
|
-
|
-
|
|||||||||||||||||||
|
TOTAL
|
90,014
|
90,001
|
5.32%
|
83,621
|
83,222
|
4.86
|
53,611
|
53,143
|
4.34
|
|||||||||||||||||||
|
MORTGAGE-BACKED
SECURITIES(2)
|
||||||||||||||||||||||||||||
|
Due
in 1 year or less
|
4,125
|
4,117
|
4.23
|
3,568
|
3,571
|
5.37
|
339
|
337
|
3.97
|
|||||||||||||||||||
|
Due
over 1 year through 5 years
|
15,043
|
15,070
|
4.89
|
14,942
|
14,732
|
4.58
|
14,958
|
14,685
|
4.12
|
|||||||||||||||||||
|
Due
over 5 years through 10 years
|
7,166
|
7,100
|
5.21
|
4,734
|
4,593
|
5.02
|
5,651
|
5,509
|
5.09
|
|||||||||||||||||||
|
Due
over 10 years
|
-
|
-
|
-
|
-
|
-
|
-
|
-
|
-
|
-
|
|||||||||||||||||||
|
TOTAL
|
26,334
|
26,287
|
4.87%
|
23,244
|
22,896
|
4.79
|
20,948
|
20,531
|
4.38
|
|||||||||||||||||||
|
OTHER
SECURITIES
|
||||||||||||||||||||||||||||
|
Due
in 1 year or less
|
-
|
-
|
-
|
-
|
-
|
-
|
-
|
-
|
-
|
|||||||||||||||||||
|
Due
over 1 year through 5 years
|
-
|
-
|
-
|
-
|
-
|
-
|
-
|
-
|
-
|
|||||||||||||||||||
|
Due
over 5 years through 10 years
|
1,000
|
1,061
|
5.00
|
-
|
-
|
-
|
-
|
-
|
-
|
|||||||||||||||||||
|
Due
over 10 years(3)
|
11,307
|
11,307
|
5.90
|
12,648
|
12,648
|
5.78
|
14,114
|
14,114
|
4.75
|
|||||||||||||||||||
|
TOTAL
|
12,307
|
12,368
|
5.90
|
12,648
|
12,648
|
5.78
|
14,114
|
14,114
|
4.75
|
|||||||||||||||||||
|
TOTAL
INVESTMENT SECURITIES
|
$
|
190,360
|
$
|
190,719
|
5.08
|
%
|
$
|
193,230
|
$
|
191,894
|
4.72
|
%
|
$
|
172,971
|
$
|
171,019
|
3.57
|
%
|
||||||||||
|
(1)
|
Weighted
average yields are calculated on the basis of the amortized cost of the
security. The weighted average yields on tax-exempt obligations are
computed on a taxable equivalent basis using a 35% tax
rate.
|
|
(2)
|
Based
on weighted average life.
|
|
(3)
|
Federal
Home Loan Bank Stock and Federal Reserve Bank Stock are included in this
category for weighted average yield, but do not have stated
maturities.
|
|
As
of December 31,
|
|||||||||||
|
(In
Years)
|
2007
|
2006
|
2005
|
||||||||
|
U.S.
Governments
|
1.09 | 1.76 | 1.01 | ||||||||
|
States
and Political Subdivisions
|
1.48 | 1.39 | 1.31 | ||||||||
|
Mortgage-Backed
Securities
|
3.47 | 3.05 | 5.05 | ||||||||
|
Other
Securities
|
- | - | - | ||||||||
|
TOTAL
|
1.63 | 1.75 | 1.65 | ||||||||
|
Moody's
Rating
|
Amortized
Cost
|
Percentage
|
||||||
|
AAA
|
$ | 84,041 | 93.36 | % | ||||
|
AA-1
|
- | - | ||||||
|
AA-2
|
- | - | ||||||
|
AA-3
|
- | - | ||||||
|
AA
|
- | - | ||||||
|
Not
Rated(1)
|
5,973 | 6.64 | ||||||
|
Total
|
$ | 90,014 | 100.00 | % | ||||
|
(1)
|
All of the securities not rated
by Moody's are rated "AA" or higher by
S&P.
|
|
2006 to
|
Percentage
|
Components
of
|
|||||||||
|
2007
|
of
Total
|
Total
Deposits
|
|||||||||
|
(Average
Balances - Dollars in Thousands)
|
Change
|
Change
|
2007
|
2006
|
2005
|
||||||
|
Noninterest
Bearing Deposits
|
$
|
(62,922)
|
(141.4)
|
%
|
22.2
|
%
|
24.8
|
%
|
27.9
|
%
|
|
|
NOW
Accounts
|
38,389
|
86.3
|
28.0
|
25.5
|
22.0
|
||||||
|
Money
Market Accounts
|
26,936
|
60.6
|
20.0
|
18.2
|
14.1
|
||||||
|
Savings
|
(14,333)
|
(32.2)
|
6.0
|
6.6
|
7.8
|
||||||
|
Time
Deposits
|
(32,555)
|
(73.2)
|
23.9
|
24.9
|
28.2
|
||||||
|
Total
Deposits
|
$
|
(44,485)
|
100.0
|
%
|
100.0
|
%
|
100.0
|
%
|
100.0
|
%
|
|
|
December
31, 2007
|
|||||
|
(Dollars
in Thousands)
|
Time
Certificates of Deposit
|
Percent
|
|||
|
Three
months or less
|
$
|
34,043
|
26.24
|
%
|
|
|
Over
three through six months
|
31,235
|
24.07
|
|||
|
Over
six through twelve months
|
52,823
|
40.71
|
|||
|
Over
twelve months
|
11,656
|
8.98
|
|||
|
Total
|
$
|
129,757
|
100.00
|
%
|
|
|
Payments
Due By Period
|
|||||||||||||||
|
(Dollars
in Thousands)
|
<
1 Yr
|
1 –
3 Yrs
|
3 –
5 Yrs
|
>
5 Years
|
Total
|
||||||||||
|
Federal
Home Loan Bank Advances
|
$ | 14,604 | $ | 5,493 | $ | 5,157 | $ | 13,403 | $ | 38,657 | |||||
|
Subordinated
Notes Payable
|
- | - | - | 62,887 | 62,887 | ||||||||||
|
Operating
Lease Obligations
|
1,425 | 2,318 | 1,398 | 5,700 | 10,841 | ||||||||||
|
Time
Deposit Maturities
|
408,041 | 57,101 | 2,231 | - | 467,373 | ||||||||||
|
Liability
for Unrecognized Tax Benefits
|
95 | 179 | 1,502 | 2,031 | 3,807 | ||||||||||
|
Total
Contractual Cash Obligations
|
$ | 424,165 | $ | 65,091 | $ | 10,288 | $ | 84,021 | $ | 583,565 | |||||
|
(Dollars
in Thousands)
|
2007
|
2006
|
2005
|
||||||||
|
Common
Stock
|
172 | 185 | 186 | ||||||||
|
Additional
Paid-in Capital
|
38,243 | 80,654 | 83,304 | ||||||||
|
Retained
Earnings
|
260,325 | 243,242 | 223,532 | ||||||||
|
Subtotal
|
298,740 | 324,081 | 307,022 | ||||||||
|
Accumulated
Other Comprehensive (Loss), Net of Tax
|
(6,065 | ) | (8,311 | ) | (1,246 | ) | |||||
|
Total
Shareowners' Equity
|
$ | 292,675 | $ | 315,770 | $ | 305,776 | |||||
|
§
|
Compliance
with state and federal laws and
regulations;
|
|
§
|
Our
capital position and our ability to meet our financial
obligations;
|
|
§
|
Projected
earnings and asset levels; and
|
|
§
|
The
ability of the Bank and us to fund
dividends.
|
|
Adjustment
|
Description
|
Years
Impacted
|
|||||
|
Operating
Leases
|
$
|
715,000
|
Establish
deferred rent payable due to difference in using straight-line accounting
method for operating leases (required per SFAS 13) versus cash-basis
accounting
|
1990
- 2006
|
|||
|
Supplies
|
$
|
518,000
|
Overstatement
of prepaid supply account due to improper recognition of sales tax and
freight charges when supplies were used
|
1998
- 2006
|
|||
|
Total
|
$
|
1,233,000
|
|||||
|
QUANTITATIVE AND QUALITATIVE
DISCLOSURE ABOUT MARKET RISK
|
|
As
of December 31, 2007
|
||||||||||||||||||||||||||||||||
|
(Dollars
in Thousands)
|
Year
1
|
Year
2
|
Year
3
|
Year
4
|
Year
5
|
Beyond
|
Total
|
Fair
Value(5)
|
||||||||||||||||||||||||
|
Loans
|
||||||||||||||||||||||||||||||||
|
Fixed
Rate
|
$ | 306,159 | $ | 145,265 | $ | 99,036 | $ | 39,048 | $ | 23,130 | $ | 22,374 | $ | 635,012 | $ | 664,241 | ||||||||||||||||
|
Average
Interest Rate
|
6.76 | % | 8.11 | % | 8.05 | % | 8.48 | % | 8.56 | % | 6.68 | % | 7.44 | % | ||||||||||||||||||
|
Floating
Rate(2)
|
1,047,020 | 134,999 | 65,503 | 8,884 | 6,687 | 17,725 | 1,280,818 | 1,336,486 | ||||||||||||||||||||||||
|
Average
Interest Rate
|
7.75 | % | 7.69 | % | 7.70 | % | 7.89 | % | 8.05 | % | 8.14 | % | 7.75 | % | ||||||||||||||||||
|
Investment
Securities(3)
|
||||||||||||||||||||||||||||||||
|
Fixed
Rate
|
96,458 | 49,810 | 33,051 | 4,271 |
2022
|
2,279 | 187,891 | 187,891 | ||||||||||||||||||||||||
|
Average
Interest Rate
|
3.58 | % | 3.96 | % | 3.72 | % | 4.60 | % | 5.15 | % | 5.27 | % | 3.76 | % | ||||||||||||||||||
|
Floating
Rate
|
2,287 | - | - | - | - | - | 2,287 | 2,287 | ||||||||||||||||||||||||
|
Average
Interest Rate
|
5.12 | % | - | - | - | - | - | 5.12 | % | |||||||||||||||||||||||
|
Other
Earning Assets
|
||||||||||||||||||||||||||||||||
|
Floating
Rate
|
166,260 | - | - | - | - | - | 166,260 | 166,260 | ||||||||||||||||||||||||
|
Average
Interest Rate
|
4.24 | % | - | - | - | - | - | 4.24 | % | |||||||||||||||||||||||
|
Total
Financial Assets
|
$ | 1,618,184 | $ | 330,074 | $ | 197,590 | $ | 52,203 | $ | 31,839 | $ | 42,378 | $ | 2,272,268 | $ | 2,357,165 | ||||||||||||||||
|
Average
Interest Rate
|
4.27 | % | 7.31 | % | 7.21 | % | 8.06 | % | 8.23 | % | 7.21 | % | 5.16 | % | ||||||||||||||||||
|
Deposits(4)
|
||||||||||||||||||||||||||||||||
|
Fixed
Rate Deposits
|
$ | 409,537 | $ | 43,005 | $ | 11,476 | $ | 2,619 | $ | 2,073 | $ | 158 | $ | 468,868 | $ | 420,251 | ||||||||||||||||
|
Average
Interest Rate
|
4.31 | % | 4.22 | % | 3.99 | % | 4.05 | % | 3.96 | % | 4.91 | % | 4.29 | % | ||||||||||||||||||
|
Floating
Rate Deposits
|
1,240,914 | - | - | - | - | - | 1,240,914 | 1,240,914 | ||||||||||||||||||||||||
|
Average
Interest Rate
|
2.25 | % | - | - | - | - | - | 2.25 | % | |||||||||||||||||||||||
|
Other
Interest Bearing
|
||||||||||||||||||||||||||||||||
|
Liabilities
|
||||||||||||||||||||||||||||||||
|
Fixed
Rate Debt
|
2,977 | 3,368 | 3,120 | 3,077 | 3,233 | 10,956 | 26,731 | 28,284 | ||||||||||||||||||||||||
|
Average
Interest Rate
|
4.82 | % | 4.84 | % | 4.89 | % | 4.97 | % | 4.97 | % | 4.90 | % | 4.90 | % | ||||||||||||||||||
|
Floating
Rate Debt
|
52,553 | 31,506 | 31,959 | - | - | 116,018 | 116,393 | |||||||||||||||||||||||||
|
Average
Interest Rate
|
3.71 | % | 2.99 | % | 6.07 | % | 6.07 | % | - | - | 3.35 | % | ||||||||||||||||||||
|
Total
Financial Liabilities
|
$ | 1,705,981 | $ | 77,879 | $ | 46,555 | $ | 5,696 | $ | 5,306 | $ | 11,114 | $ | 1,852,531 | $ | 1,805,842 | ||||||||||||||||
|
Average
interest Rate
|
2.80 | % | 2.54 | % | 5.48 | % | 4.55 | % | 4.57 | % | 4.90 | % | 2.88 | % | ||||||||||||||||||
|
(1)
|
Based upon expected cash flows
unless otherwise indicated.
|
|
(2)
|
Based upon a combination of
expected maturities and re-pricing
opportunities.
|
|
(3)
|
Based upon contractual maturity,
except for callable and floating rate securities, which are based on
expected maturity and weighted average life,
respectively.
|
|
(4)
|
Savings,
NOW and money market accounts can be re-priced at any time, therefore, all
such balances are included as floating rate deposits. Time deposit
balances are classified according to
maturity.
|
|
(5)
|
Fair
value of loans does not include a reduction for the allowance for loan
losses.
|
|
|
|
|
2007
|
2006
|
|||||||||||||||||||||||||||||||
|
(Dollars
in Thousands, Except Per Share Data)
|
Fourth
|
Third
|
Second
|
First
|
Fourth
|
Third
|
Second
|
First
|
||||||||||||||||||||||||
|
Summary
of Operations:
|
||||||||||||||||||||||||||||||||
|
Interest
Income
|
$ | 40,786 | $ | 41,299 | $ | 41,724 | $ | 41,514 | $ | 42,600 | $ | 42,512 | $ | 41,369 | $ | 39,412 | ||||||||||||||||
|
Interest
Expense
|
13,241 | 13,389 | 13,263 | 13,189 | 13,003 | 12,289 | 11,182 | 10,282 | ||||||||||||||||||||||||
|
Net
Interest Income
|
27,545 | 27,910 | 28,461 | 28,325 | 29,597 | 30,223 | 30,187 | 29,130 | ||||||||||||||||||||||||
|
Provision
for Loan Losses
|
1,699 | 1,552 | 1,675 | 1,237 | 460 | 711 | 121 | 667 | ||||||||||||||||||||||||
|
Net
Interest Income After
Provision
for Loan Losses
|
25,846 | 26,358 | 26,786 | 27,088 | 29,137 | 29,512 | 30,066 | 28,463 | ||||||||||||||||||||||||
|
Noninterest
Income
|
15,823 | 14,431 | 15,084 | 13,962 | 14,385 | 14,144 | 14,003 | 13,045 | ||||||||||||||||||||||||
|
Noninterest
Expense
|
31,614 | 29,919 | 29,897 | 30,562 | 29,984 | 30,422 | 31,070 | 30,092 | ||||||||||||||||||||||||
|
Income
Before Provision for Income Taxes
|
10,055 | 10,870 | 11,973 | 10,488 | 13,538 | 13,234 | 12,999 | 11,416 | ||||||||||||||||||||||||
|
Provision
for Income Taxes
|
2,391 | 3,699 | 4,082 | 3,531 | 4,688 | 4,554 | 4,684 | 3,995 | ||||||||||||||||||||||||
|
Net
Income
|
$ | 7,664 | $ | 7,171 | $ | 7,891 | $ | 6,957 | $ | 8,850 | $ | 8,680 | $ | 8,315 | $ | 7,421 | ||||||||||||||||
|
Net
Interest Income (FTE)
|
$ | 28,196 | $ | 28,517 | $ | 29,050 | $ | 28,898 | $ | 30,152 | $ | 30,745 | $ | 30,591 | $ | 29,461 | ||||||||||||||||
|
Per
Common Share:
|
||||||||||||||||||||||||||||||||
|
Net
Income Basic
|
$ | 0.44 | $ | 0.41 | $ | 0.43 | $ | 0.38 | $ | 0.48 | $ | 0.47 | $ | 0.44 | $ | 0.40 | ||||||||||||||||
|
Net
Income Diluted
|
0.44 | 0.41 | 0.43 | 0.38 | 0.48 | 0.47 | 0.44 | 0.40 | ||||||||||||||||||||||||
|
Dividends
Declared
|
0.185 | 0.175 | 0.175 | 0.175 | 0.175 | 0.163 | 0.163 | 0.163 | ||||||||||||||||||||||||
|
Diluted
Book Value
|
17.03 | 16.95 | 16.87 | 16.97 | 17.01 | 17.18 | 16.81 | 16.65 | ||||||||||||||||||||||||
|
Market
Price:
|
||||||||||||||||||||||||||||||||
|
High
|
34.00 | 36.40 | 33.69 | 35.91 | 35.98 | 33.25 | 35.39 | 37.97 | ||||||||||||||||||||||||
|
Low
|
24.60 | 27.69 | 29.12 | 29.79 | 30.14 | 29.87 | 29.51 | 33.79 | ||||||||||||||||||||||||
|
Close
|
28.22 | 31.20 | 31.34 | 33.30 | 35.30 | 31.10 | 30.20 | 35.55 | ||||||||||||||||||||||||
|
Selected
Average
|
||||||||||||||||||||||||||||||||
|
Balances:
|
||||||||||||||||||||||||||||||||
|
Loans
|
$ | 1,908,069 | $ | 1,907,235 | $ | 1,944,969 | $ | 1,980,224 | $ | 2,003,719 | $ | 2,025,112 | $ | 2,040,656 | $ | 2,048,642 | ||||||||||||||||
|
Earning
Assets
|
2,191,230 | 2,144,737 | 2,187,236 | 2,211,560 | 2,238,066 | 2,241,158 | 2,278,817 | 2,275,667 | ||||||||||||||||||||||||
|
Assets
|
2,519,682 | 2,467,703 | 2,511,252 | 2,530,790 | 2,557,357 | 2,560,155 | 2,603,090 | 2,604,458 | ||||||||||||||||||||||||
|
Deposits
|
2,016,736 | 1,954,160 | 1,987,418 | 2,003,726 | 2,028,453 | 2,023,523 | 2,047,755 | 2,040,248 | ||||||||||||||||||||||||
|
Shareowners’
Equity
|
299,342 | 301,536 | 309,352 | 316,484 | 323,903 | 318,041 | 315,794 | 311,461 | ||||||||||||||||||||||||
|
Common
Equivalent Average Shares:
|
||||||||||||||||||||||||||||||||
|
Basic
|
17,444 | 17,709 | 18,089 | 18,409 | 18,525 | 18,530 | 18,633 | 18,652 | ||||||||||||||||||||||||
|
Diluted
|
17,445 | 17,719 | 18,089 | 18,420 | 18,569 | 18,565 | 18,653 | 18,665 | ||||||||||||||||||||||||
|
Ratios:
|
||||||||||||||||||||||||||||||||
|
Return
on Assets
|
1.21 | % | 1.15 | % | 1.26 | % | 1.11 | % | 1.37 | % | 1.35 | % | 1.28 | % | 1.16 | % | ||||||||||||||||
|
Return
on Equity
|
10.16 | % | 9.44 | % | 10.23 | % | 8.91 | % | 10.84 | % | 10.83 | % | 10.56 | % | 9.66 | % | ||||||||||||||||
|
Net
Interest Margin (FTE)
|
5.10 | % | 5.27 | % | 5.33 | % | 5.29 | % | 5.35 | % | 5.45 | % | 5.38 | % | 5.25 | % | ||||||||||||||||
|
Efficiency
Ratio
|
68.51 | % | 66.27 | % | 64.44 | % | 67.90 | % | 63.99 | % | 64.35 | % | 66.23 | % | 67.20 | % | ||||||||||||||||
|
PAGE
|
|
|
54
|
|
|
56
|
|
|
57
|
|
|
58
|
|
|
59
|
|
|
60
|
|
As
of December 31,
|
|||||||
|
(Dollars
in Thousands)
|
2007
|
2006
|
|||||
|
ASSETS
|
|||||||
|
Cash
and Due From Banks
|
$ | 93,437 | $ | 98,769 | |||
|
Federal
Funds Sold and Interest Bearing Deposits
|
166,260 | 78,795 | |||||
|
Total
Cash and Cash Equivalents
|
259,697 | 177,564 | |||||
|
Investment
Securities, Available-for-Sale
|
190,719 | 191,894 | |||||
|
Loans,
Net of Unearned Interest
|
1,915,850 | 1,999,721 | |||||
|
Allowance
for Loan Losses
|
(18,066 | ) | (17,217 | ) | |||
|
Loans,
Net
|
1,897,784 | 1,982,504 | |||||
|
Premises
and Equipment, Net
|
98,612 | 86,538 | |||||
|
Goodwill
|
84,811 | 84,811 | |||||
|
Other
Intangible Assets
|
13,757 | 19,591 | |||||
|
Other
Assets
|
70,947 | 55,008 | |||||
|
Total
Assets
|
$ | 2,616,327 | $ | 2,597,910 | |||
|
LIABILITIES
|
|||||||
|
Deposits:
|
|||||||
|
Noninterest
Bearing Deposits
|
$ | 432,659 | $ | 490,014 | |||
|
Interest
Bearing Deposits
|
1,709,685 | 1,591,640 | |||||
|
Total
Deposits
|
2,142,344 | 2,081,654 | |||||
|
Short-Term
Borrowings
|
53,131 | 65,023 | |||||
|
Subordinated
Notes Payable
|
62,887 | 62,887 | |||||
|
Other
Long-Term Borrowings
|
26,731 | 43,083 | |||||
|
Other
Liabilities
|
38,559 | 29,493 | |||||
|
Total
Liabilities
|
2,323,652 | 2,282,140 | |||||
|
SHAREOWNERS'
EQUITY
|
|||||||
|
Preferred
Stock, $.01 par value; 3,000,000 shares authorized; no shares issued and
outstanding
|
- | - | |||||
|
Common
Stock, $.01 par value; 90,000,000 shares authorized; 17,182,553 and
18,518,398 shares issued and outstanding at December 31, 2007 and December
31, 2006, respectively
|
172 | 185 | |||||
|
Additional
Paid-In Capital
|
38,243 | 80,654 | |||||
|
Retained
Earnings
|
260,325 | 243,242 | |||||
|
Accumulated
Other Comprehensive Loss, Net of Tax
|
(6,065 | ) | (8,311 | ) | |||
|
Total
Shareowners' Equity
|
292,675 | 315,770 | |||||
|
Total
Liabilities and Shareowners' Equity
|
$ | 2,616,327 | $ | 2,597,910 | |||
|
For
the Years Ended December 31,
|
|||||||||||
|
(Dollars in Thousands, Except
Per Share Data)(1)
|
2007
|
2006
|
2005
|
||||||||
|
INTEREST
INCOME
|
|||||||||||
|
Interest
and Fees on Loans
|
$ | 154,567 | $ | 156,666 | $ | 133,268 | |||||
|
Investment
Securities:
|
|||||||||||
|
U.S.
Treasury
|
574 | 453 | 412 | ||||||||
|
U.S.
Government Agencies and Corporations
|
3,628 | 3,605 | 3,223 | ||||||||
|
States
and Political Subdivisions
|
2,894 | 2,337 | 1,545 | ||||||||
|
Other
Securities
|
747 | 793 | 614 | ||||||||
|
Funds
Sold
|
2,913 | 2,039 | 991 | ||||||||
|
Total
Interest Income
|
165,323 | 165,893 | 140,053 | ||||||||
|
INTEREST
EXPENSE
|
|||||||||||
|
Deposits
|
44,687 | 37,253 | 21,134 | ||||||||
|
Short-Term
Borrowings
|
2,871 | 3,075 | 2,854 | ||||||||
|
Subordinated
Notes Payable
|
3,730 | 3,725 | 2,981 | ||||||||
|
Other
Long-Term Borrowings
|
1,794 | 2,704 | 3,094 | ||||||||
|
Total
Interest Expense
|
53,082 | 46,757 | 30,063 | ||||||||
|
NET
INTEREST INCOME
|
112,241 | 119,136 | 109,990 | ||||||||
|
Provision
for Loan Losses
|
6,163 | 1,959 | 2,507 | ||||||||
|
Net
Interest Income After
|
|||||||||||
|
Provision
for Loan Losses
|
106,078 | 117,177 | 107,483 | ||||||||
|
NONINTEREST
INCOME
|
|||||||||||
|
Service
Charges on Deposit Accounts
|
26,130 | 24,620 | 20,740 | ||||||||
|
Data
Processing
|
3,133 | 2,723 | 2,610 | ||||||||
|
Asset
Management Fees
|
4,700 | 4,600 | 4,419 | ||||||||
|
Securities
Transactions
|
14 | (4 | ) | 9 | |||||||
|
Mortgage
Banking Revenues
|
2,596 | 3,235 | 4,072 | ||||||||
|
Bank
Card Fees
|
13,706 | 12,602 | 10,619 | ||||||||
|
Other
|
9,021 | 7,801 | 6,729 | ||||||||
|
Total
Noninterest Income
|
59,300 | 55,577 | 49,198 | ||||||||
|
NONINTEREST
EXPENSE
|
|||||||||||
|
Salaries
and Associate Benefits
|
60,279 | 60,855 | 53,687 | ||||||||
|
Occupancy,
Net
|
9,347 | 9,395 | 8,293 | ||||||||
|
Furniture
and Equipment
|
9,890 | 9,911 | 8,970 | ||||||||
|
Intangible
Amortization
|
5,834 | 6,085 | 5,440 | ||||||||
|
Merger
Expense
|
- | - | 438 | ||||||||
|
Other
|
36,642 | 35,322 | 32,986 | ||||||||
|
Total
Noninterest Expense
|
121,992 | 121,568 | 109,814 | ||||||||
|
INCOME
BEFORE INCOME TAXES
|
43,386 | 51,186 | 46,867 | ||||||||
|
Income
Taxes
|
13,703 | 17,921 | 16,586 | ||||||||
|
NET
INCOME
|
$ | 29,683 | $ | 33,265 | $ | 30,281 | |||||
|
BASIC
NET INCOME PER SHARE
|
$ | 1.66 | $ | 1.79 | $ | 1.66 | |||||
|
DILUTED
NET INCOME PER SHARE
|
$ | 1.66 | $ | 1.79 | $ | 1.66 | |||||
|
Average
Basic Common Shares Outstanding
|
17,909 | 18,585 | 18,264 | ||||||||
|
Average
Diluted Common Shares Outstanding
|
17,912 | 18,610 | 18,281 | ||||||||
|
(1)
|
All
share and per share data have been adjusted to reflect the 5-for-4 stock
split effective July 1, 2005.
|
|
(Dollars in Thousands, Except
Per Share Data)(1)
|
Common
Stock
|
Additional
Paid-In
Capital
|
Retained
Earnings
|
Accumulated
Other
Comprehensive
(Loss)
Income,
Net
of Taxes
|
Total
|
||||||||||||||
|
Balance,
December 31, 2004
|
$ | 177 | $ | 52,328 | $ | 204,648 | $ | (353 | $ | 256,800 | |||||||||
|
Comprehensive
Income:
|
|||||||||||||||||||
|
Net
Income
|
- | - | 30,281 | - | - | ||||||||||||||
|
Net
Change in Unrealized Loss On Available-for-Sale Securities (net of
tax)
|
- | - | - | (893 | ) | - | |||||||||||||
|
Total
Comprehensive Income
|
- | - | - | - | 29,388 | ||||||||||||||
|
Cash
Dividends ($.584 per share)
|
- | - | (11,397 | ) | - | (11,397 | ) | ||||||||||||
|
Stock
Performance Plan Compensation
|
- | 968 | - | - | 968 | ||||||||||||||
|
Issuance
of Common Stock
|
9 | 30,008 | - | - | 30,017 | ||||||||||||||
|
Balance,
December 31, 2005
|
186 | 83,304 | 223,532 | (1,246 | ) | 305,776 | |||||||||||||
|
Cumulative
Effect Adjustment upon adoption of SAB No. 108 (net of
tax)
|
- | - | (1,233 | ) | - | (1,233 | ) | ||||||||||||
|
Balance
(adjusted), December 31, 2005
|
186 | 83,304 | 222,299 | (1,246 | ) | 304,543 | |||||||||||||
|
Comprehensive
Income:
|
|||||||||||||||||||
|
Net
Income
|
- | - | 33,265 | - | - | ||||||||||||||
|
Net
Change in Unrealized Loss On Available-for-Sale Securities (net of
tax)
|
- | - | - | 412 | - | ||||||||||||||
|
Total
Comprehensive Income
|
- | - | - | - | 33,677 | ||||||||||||||
|
Establish
Pension Liability upon adoption of SFAS No. 158 (net of
tax)
|
- | - | - | (7,477 | ) | (7,477 | ) | ||||||||||||
|
Cash
Dividends ($.663 per share)
|
- | - | (12,322 | ) | - | (12,322 | ) | ||||||||||||
|
Stock
Performance Plan Compensation
|
- | 1,673 | - | - | 1,673 | ||||||||||||||
|
Issuance
of Common Stock
|
1 | 1,035 | - | - | 1,036 | ||||||||||||||
|
Repurchase
of Common Stock
|
(2 | ) | (5,358 | ) | - | - | (5,360 | ) | |||||||||||
|
Balance,
December 31, 2006
|
185 | 80,654 | 243,242 | (8,311 | ) | 315,770 | |||||||||||||
|
Comprehensive
Income:
|
|||||||||||||||||||
|
Net
Income
|
- | - | 29,683 | - | - | ||||||||||||||
|
Net
Change in Unrealized Loss On Available-for-Sale Securities (net of
tax)
|
- | - | - | 1,080 | |||||||||||||||
|
Net
Change in Funded Status of Defined Pension Plan and SERP Plan (net of
tax)
|
- | - | - | 1,166 | |||||||||||||||
|
Total
Comprehensive Income
|
- | - | - | - | 31,929 | ||||||||||||||
|
Miscellaneous
– Other
|
- | - | 223 | - | 223 | ||||||||||||||
|
Cash
Dividends ($.710 per share)
|
- | - | (12,823 | ) | - | (12,823 | ) | ||||||||||||
|
Stock
Performance Plan Compensation
|
- | 265 | - | - | 265 | ||||||||||||||
|
Issuance
of Common Stock
|
1 | 571 | - | - | 572 | ||||||||||||||
|
Repurchase
of Common Stock
|
(14 | ) | (43,247 | ) | - | - | (43,261 | ) | |||||||||||
|
Balance,
December 31, 2007
|
$ | 172 | $ | 38,243 | $ | 260,325 | $ | (6,065 | ) | $ | 292,675 | ||||||||
|
(1)
|
All
share, per share, and shareowners' equity data have been adjusted to
reflect the 5-for-4 stock split effective July 1
2005.
|
|
For
the Years Ended December 31,
|
|||||||||||
|
(Dollars
in Thousands)
|
2007
|
2006
|
2005
|
||||||||
|
CASH
FLOWS FROM OPERATING ACTIVITIES:
|
|||||||||||
|
Net
Income
|
$ | 29,683 | $ | 33,265 | $ | 30,281 | |||||
|
Adjustments
to Reconcile Net Income to Cash Provided by Operating
Activities:
|
|||||||||||
|
Provision
for Loan Losses
|
6,163 | 1,959 | 2,507 | ||||||||
|
Depreciation
|
6,338 | 6,795 | 5,899 | ||||||||
|
Net
Securities Amortization
|
279 | 582 | 1,454 | ||||||||
|
Amortization
of Intangible Assets
|
5,834 | 6,085 | 5,440 | ||||||||
|
(Gain)Loss
on Securities Transactions
|
(14 | ) | 4 | (9 | ) | ||||||
|
Origination of
Loans Held-for-Sale
|
(158,390 | ) | (190,945 | ) | (219,171 | ) | |||||
|
Proceeds
From Sales of Loans Held-for-Sale
|
162,835 | 194,569 | 227,853 | ||||||||
|
Net
Gain From Sales of Loans Held-for Sale
|
(2,596 | ) | (3,235 | ) | (4,072 | ) | |||||
|
Non-Cash
Compensation
|
265 | 1,673 | 968 | ||||||||
|
Deferred
Income Taxes
|
1,328 | 1,614 | 182 | ||||||||
|
Net
Increase in Other Assets
|
(12,894 | ) | (11,327 | ) | (11,839 | ) | |||||
|
Net
Increase in Other Liabilities
|
8,115 | 5,148 | 9,264 | ||||||||
|
Net
Cash Provided by Operating Activities
|
46,946 | 46,187 | 48,757 | ||||||||
|
CASH
FLOWS FROM INVESTING ACTIVITIES:
|
|||||||||||
|
Securities
Available-for-Sale:
|
|||||||||||
|
Purchases
|
(56,289 | ) | (102,628 | ) | (45,717 | ) | |||||
|
Sales
|
- | 283 | 35,142 | ||||||||
|
Payments,
Maturities, and Calls
|
58,894 | 81,500 | 81,783 | ||||||||
|
Net
Decrease (Increase) in Loans
|
74,058 | 64,213 | (127,715 | ) | |||||||
|
Net
Cash Acquired From Acquisitions
|
- | - | 37,412 | ||||||||
|
Purchase
of Premises & Equipment
|
(18,613 | ) | (20,145 | ) | (18,336 | ) | |||||
|
Proceeds
From Sales of Premises & Equipment
|
203 | 630 | 897 | ||||||||
|
Net
Cash Provided By (Used In) Investing Activities
|
58,253 | 23,853 | (36,534 | ) | |||||||
|
CASH
FLOWS FROM FINANCING ACTIVITIES:
|
|||||||||||
|
Net
Increase (Decrease) in Deposits
|
60,690 | 2,308 | (17,125 | ) | |||||||
|
Net
Decrease in Short-Term Borrowings
|
(12,263 | ) | (31,412 | ) | (33,085 | ) | |||||
|
Proceeds
from Subordinated Notes Payable
|
- | - | 31,959 | ||||||||
|
(Decrease)
Increase in Other Long-Term Borrowings
|
(10,618 | ) | 3,250 | 23,600 | |||||||
|
Repayment
of Other Long-Term Borrowings
|
(5,363 | ) | (16,335 | ) | (2,380 | ) | |||||
|
Dividends
Paid
|
(12,823 | ) | (12,322 | ) | (11,397 | ) | |||||
|
Repurchase
of Common Stock
|
(43,261 | ) | (5,360 | ) | - | ||||||
|
Issuance
of Common Stock
|
572 | 1,036 | 1,019 | ||||||||
|
Net
Cash Used In Financing Activities
|
(23,066 | ) | (58,835 | ) | (7,409 | ) | |||||
|
NET
CHANGE IN CASH AND CASH EQUIVALENTS
|
82,133 | 11,205 | 4,814 | ||||||||
|
Cash
and Cash Equivalents at Beginning of Year
|
177,564 | 166,359 | 161,545 | ||||||||
|
Cash
and Cash Equivalents at End of Year
|
$ | 259,697 | $ | 177,564 | $ | 166,359 | |||||
|
SUPPLEMENTAL
DISCLOSURES:
|
|||||||||||
|
Interest
Paid on Deposits
|
$ | 44,510 | $ | 36,509 | $ | 19,964 | |||||
|
Interest
Paid on Debt
|
$ | 8,463 | $ | 9,688 | $ | 8,754 | |||||
|
Taxes
Paid
|
$ | 12,431 | $ | 16,797 | $ | 15,923 | |||||
|
Loans
Transferred to Other Real Estate
|
$ | 3,494 | $ | 1,018 | $ | 2,689 | |||||
|
Cumulative
Effect Adjustment to Beginning Retained Earnings – SAB
108
|
$ | - | $ | 1,233 | $ | - | |||||
|
Cumulative
Effect Adjustment to Other Comprehensive Income to Record Minimum Pension
Liability – SFAS 158
|
$ | - | $ | 7,477 | $ | - | |||||
|
Issuance
of Common Stock as Non-Cash Compensation
|
$ | 1,160 | $ | 711 | $ | 339 | |||||
|
Transfer
of Current Portion of Long-Term Borrowings
to
Short-Term Borrowings
|
$ | 12,318 | $ | 13,061 | $ | 20,043 | |||||
|
As
Reported
|
Misapplied
|
As
Revised
|
||||||||||
|
Statements
of Changes in Stockholders’ Equity - Comprehensive Income
|
$ | 26,200 | $ | 7,477 | $ | 33,677 | ||||||
|
Note
21 – Comprehensive Income – Net Other Comprehensive Gain
(Loss)
|
$ | (7,065 | ) | $ | 7,477 | $ | 412 | |||||
|
Adjustment
|
Description
|
Years
Impacted
|
|||
|
Operating
Leases
|
$
|
715,000
|
Establish
deferred rent payable due to difference in using straight-line accounting
for operating leases (required per SFAS 13) versus cash-basis
accounting
|
1990
- 2006
|
|
|
Supplies
|
$
|
518,000
|
Overstatement
of prepaid supply account due to improper recognition of sales tax and
freight charges when supplies were used
|
1998
- 2006
|
|
|
Total
|
$
|
1,233,000
|
|||
|
2007
|
|||||||||||||||
|
(Dollars
in Thousands)
|
Amortized
Cost
|
Unrealized
Gains
|
Unrealized
Losses
|
Market
Value
|
|||||||||||
|
U.S.
Treasury
|
$ | 16,216 | $ | 97 | $ | - | $ | 16,313 | |||||||
|
U.S.
Government Agencies and Corporations
|
45,489 | 295 | 34 | 45,750 | |||||||||||
|
States
and Political Subdivisions
|
90,014 | 164 | 177 | 90,001 | |||||||||||
|
Mortgage-Backed
Securities
|
26,334 | 85 | 132 | 26,287 | |||||||||||
|
Other
Securities(1)
|
12,307 | 61 | 0 | 12,368 | |||||||||||
|
Total
Investment Securities
|
$ | 190,360 | $ | 702 | $ | 343 | $ | 190,719 | |||||||
|
2006
|
|||||||||||||||
|
(Dollars
in Thousands)
|
Amortized
Cost
|
Unrealized
Gains
|
Unrealized
Losses
|
Market
Value
|
|||||||||||
|
U.S.
Treasury
|
$ | 12,098 | $ | 16 | $ | 49 | $ | 12,065 | |||||||
|
U.S.
Government Agencies and Corporations
|
61,619 | 37 | 593 | 61,063 | |||||||||||
|
States
and Political Subdivisions
|
83,621 | 16 | 415 | 83,222 | |||||||||||
|
Mortgage-Backed
Securities
|
23,244 | 23 | 371 | 22,896 | |||||||||||
|
Other
Securities(1)
|
12,648 | - | - | 12,648 | |||||||||||
|
Total
Investment Securities
|
$ | 193,230 | $ | 92 | $ | 1,428 | $ | 191,894 | |||||||
|
(1)
|
Includes FHLB and FRB stock
recorded at cost of $6.5 million and $4.8 million, respectively, at
December 31, 2007 and $7.8 million and $4.8 million, respectively, at
December 31, 2006.
|
|
(Dollars
in Thousands)
|
Year
|
Total
Proceeds
|
Gross
Realized
Gains
|
Gross
Realized
Losses
|
|||||||||
|
2007
|
$ | 53,011 | $ | 14 | $ | - | |||||||
|
2006
|
$ | 283 | $ | - | $ | 4 | |||||||
|
2005
|
$ | 35,142 | $ | 9 | $ | - | |||||||
|
(Dollars
in Thousands)
|
Amortized
Cost
|
Market
Value
|
||||
|
Due
in one year or less
|
$
|
66,240
|
$
|
66,384
|
||
|
Due
after one through five years
|
104,647
|
104,867
|
||||
|
Due
after five through ten years
|
8,166
|
8,161
|
||||
|
No
Maturity
|
11,307
|
11,307
|
||||
|
Total
Investment Securities
|
$
|
190,360
|
$
|
190,719
|
||
|
December
31, 2007
|
||||||||||||||||||||||||
|
Less
Than
12
months
|
Greater
Than
12
Months
|
Total
|
||||||||||||||||||||||
|
(Dollars
in Thousands)
|
Market
Value
|
Unrealized
Losses
|
Market
Value
|
Unrealized
Losses
|
Market
Value
|
Unrealized
Losses
|
||||||||||||||||||
|
U.S.
Treasury
|
$ | 12,258 | $ | - | $ | - | $ | - | $ | 12,258 | $ | - | ||||||||||||
|
U.S.
Government Agencies and Corporations
|
39,278 | 16 | 6,471 | 18 | 45,749 | 34 | ||||||||||||||||||
|
States
and Political Subdivisions
|
70,701 | 147 | 13,924 | 30 | 84,625 | 177 | ||||||||||||||||||
|
Mortgage-Backed
Securities
|
14,058 | 4 | 10,376 | 128 | 24,434 | 132 | ||||||||||||||||||
|
Total
Investment Securities
|
$ | 136,295 | $ | 167 | $ | 30,771 | $ | 176 | $ | 167,066 | $ | 343 | ||||||||||||
|
December
31, 2006
|
||||||||||||||||||||||||
|
Less
Than
12
months
|
Greater
Than
12
Months
|
Total
|
||||||||||||||||||||||
|
(Dollars
in Thousands)
|
Market
Value
|
Unrealized
Losses
|
Market
Value
|
Unrealized
Losses
|
Market
Value
|
Unrealized
Losses
|
||||||||||||||||||
|
U.S.
Treasury
|
$ | 12,065 | $ | 49 | $ | - | $ | - | $ | 12,065 | $ | 49 | ||||||||||||
|
U.S.
Government Agencies and Corporations
|
29,308 | 172 | 30,242 | 421 | 59,550 | 593 | ||||||||||||||||||
|
States
and Political Subdivisions
|
46,576 | 219 | 30,087 | 196 | 76,663 | 415 | ||||||||||||||||||
|
Mortgage-Backed
Securities
|
9,156 | 1 | 13,560 | 370 | 22,716 | 371 | ||||||||||||||||||
|
Total
Investment Securities
|
$ | 97,105 | $ | 441 | $ | 73,889 | $ | 987 | $ | 170,994 | $ | 1,428 | ||||||||||||
|
(Dollars
in Thousands)
|
2007
|
2006
|
|||||
|
Commercial,
Financial and Agricultural
|
$ | 208,864 | $ | 229,327 | |||
|
Real
Estate - Construction
|
142,248 | 179,072 | |||||
|
Real
Estate - Commercial Mortgage
|
634,920 | 643,885 | |||||
|
Real
Estate – Residential(1)
|
485,608 | 531,968 | |||||
|
Real
Estate - Home Equity
|
192,428 | 173,597 | |||||
|
Real
Estate - Loans Held-for-Sale
|
2,764 | 4,170 | |||||
|
Consumer
|
249,018 | 237,702 | |||||
|
Total
Loans, Net of Unearned Interest
|
$ | 1,915,850 | $ | 1,999,721 | |||
|
(Dollars
in Thousands)
|
2007
|
2006
|
2005
|
||||||||
|
Balance,
Beginning of Year
|
$ | 17,217 | $ | 17,410 | $ | 16,037 | |||||
|
Acquired
Reserves
|
- | - | 1,385 | ||||||||
|
Provision
for Loan Losses
|
6,163 | 1,959 | 2,507 | ||||||||
|
Recoveries
on Loans Previously Charged-Off
|
1,903 | 1,830 | 1,724 | ||||||||
|
Loans
Charged-Off
|
(7,217 | ) | (3,982 | ) | (4,243 | ) | |||||
|
Balance,
End of Year
|
$ | 18,066 | $ | 17,217 | $ | 17,410 | |||||
|
2007
|
2006
|
|||||||||||||||
|
(Dollars
in Thousands)
|
Valuation
Balance
|
Valuation
Allowance
|
Valuation
Balance
|
Valuation
Allowance
|
||||||||||||
|
Impaired
Loans:
|
||||||||||||||||
|
With
Related Credit Allowance
|
$ | 21,615 | $ | 4,702 | $ | 6,085 | $ | 2,255 | ||||||||
|
Without
Related Credit Allowance
|
15,019 | - | 4,574 | - | ||||||||||||
|
(Dollars
in Thousands)
|
2007
|
2006
|
2005
|
||||||||
|
Average
Recorded Investment in Impaired Loans
|
$ | 23,922 | $ | 12,782 | $ | 9,786 | |||||
|
Interest
Income on Impaired Loans
|
|||||||||||
|
Recognized
|
$ | 761 | $ | 398 | $ | 218 | |||||
|
Collected
in Cash
|
761 | 398 | 218 | ||||||||
|
2007
|
2006
|
||||||||||||||
|
(Dollars
in Thousands)
|
Gross
Amount
|
Accumulated
Amortization
|
Gross
Amount
|
Accumulated
Amortization
|
|||||||||||
|
Core
Deposits Intangibles
|
$ | 47,176 | $ | 34,598 | $ | 47,176 | $ | 28,955 | |||||||
|
Goodwill
|
84,811 | - | 84,811 | - | |||||||||||
|
Customer
Relationship Intangible
|
1,867 | 688 | 1,867 | 497 | |||||||||||
|
Non-Compete
Agreement
|
537 | 537 | 537 | 537 | |||||||||||
|
Total
Intangible Assets
|
$ | 134,391 | $ | 35,823 | $ | 134,391 | $ | 29,989 | |||||||
|
(Dollars
in Thousands)
|
2007
|
2006
|
|||||
|
Land
|
$ | 22,722 | $ | 22,597 | |||
|
Buildings
|
90,335 | 78,676 | |||||
|
Fixtures
and Equipment
|
55,783 | 52,129 | |||||
|
Total
|
168,840 | 153,402 | |||||
|
Accumulated
Depreciation
|
(70,228 | ) | (66,864 | ) | |||
|
Premises
and Equipment, Net
|
$ | 98,612 | $ | 86,538 | |||
|
(Dollars
in Thousands)
|
2007
|
2006
|
|||||
|
NOW
Accounts
|
$ | 744,093 | $ | 599,433 | |||
|
Money
Market Accounts
|
386,619 | 384,568 | |||||
|
Savings
Accounts
|
111,600 | 125,500 | |||||
|
Time
Deposits
|
467,373 | 482,139 | |||||
|
Total
|
$ | 1,709,685 | $ | 1,591,640 | |||
|
(Dollars
in Thousands)
|
|||
|
2008
|
$
|
408,041
|
|
|
2009
|
43,277
|
||
|
2010
|
11,205
|
||
|
2011
|
2,619
|
||
|
2012
and thereafter
|
2,231
|
||
|
Total
|
$
|
467,373
|
|
|
(Dollars
in Thousands)
|
2007
|
2006
|
2005
|
||||||||
|
NOW
Accounts
|
$ | 10,748 | $ | 7,658 | $ | 2,868 | |||||
|
Money
Market Accounts
|
13,666 | 11,687 | 4,337 | ||||||||
|
Savings
Accounts
|
280 | 278 | 292 | ||||||||
|
Time
Deposits < $100,000
|
13,990 | 12,087 | 9,247 | ||||||||
|
Time
Deposits > $100,000
|
6,003 | 5,543 | 4,390 | ||||||||
|
Total
|
$ | 44,687 | $ | 37,253 | $ | 21,134 | |||||
|
(Dollars
in Thousands)
|
Federal
Funds
Purchased
|
Securities
Sold
Under
Repurchase
Agreements
|
Other
Short-Term
Borrowings
|
|||||||
|
2007
|
||||||||||
|
Balance
at December 31,
|
$
|
7,550
|
$
|
32,806
|
$
|
12,775
|
(1)
|
|||
|
Maximum
indebtedness at any month end
|
26,400
|
47,047
|
13,664
|
|||||||
|
Daily
average indebtedness outstanding
|
15,812
|
38,683
|
11,902
|
|||||||
|
Average
rate paid for the year
|
4.89
|
%
|
4.11
|
%
|
4.17
|
%
|
||||
|
Average
rate paid on period-end borrowings
|
2.47
|
%
|
3.32
|
%
|
4.29
|
%
|
||||
|
2006
|
||||||||||
|
Balance
at December 31,
|
$
|
11,950
|
$
|
38,022
|
$
|
15,051
|
(1)
|
|||
|
Maximum
indebtedness at any month end
|
39,225
|
55,321
|
34,738
|
|||||||
|
Daily
average indebtedness outstanding
|
16,645
|
34,335
|
27,720
|
|||||||
|
Average
rate paid for the year
|
4.82
|
%
|
3.79
|
%
|
3.47
|
%
|
||||
|
Average
rate paid on period-end borrowings
|
4.61
|
%
|
3.79
|
%
|
3.90
|
%
|
||||
|
2005
|
||||||||||
|
Balance
at December 31,
|
$
|
11,925
|
$
|
38,702
|
$
|
32,346
|
||||
|
Maximum
indebtedness at any month end
|
26,825
|
65,206
|
67,122
|
|||||||
|
Daily
average indebtedness outstanding
|
31,644
|
39,784
|
26,435
|
|||||||
|
Average
rate paid for the year
|
3.36
|
%
|
2.30
|
%
|
3.32
|
%
|
||||
|
Average
rate paid on period-end borrowings
|
3.88
|
%
|
3.21
|
%
|
3.48
|
%
|
||||
|
(1)
|
Includes
FHLB debt and TT&L (client tax deposits) balance of $12.2 million and
$0.6 million, respectively at December 31, 2007 and $13.0 million and $2.0
million, respectively at December 31,
2006.
|
|
(Dollars
in Thousands)
|
2007
|
2006
|
||||
|
Due
on February 13, 2007, fixed rate of 3.05%(1)
|
- | 3,000 | ||||
|
Due
on April 24, 2007, fixed rate of 7.30%(1)
|
- | 23 | ||||
|
Due
on September 10, 2007, fixed rate of 4.29%(1)
|
- | 10,000 | ||||
|
Due
on May 30, 2008, fixed rate of 2.50%(1)
|
21 | 61 | ||||
|
Due
on June 13, 2008, fixed rate of 5.40%(1)
|
72 | 214 | ||||
|
Due
on September 8, 2008, fixed rate of 4.32%(1)
|
10,000 | 10,000 | ||||
|
Due
on November 10, 2008, fixed rate of 4.12%(1)
|
2,105 | 2,189 | ||||
|
Due
on October 19, 2009, fixed rate of 3.69%
|
302 | 470 | ||||
|
Due
on November 10, 2010, fixed rate of 4.72%
|
695 | 722 | ||||
|
Due
on December 31, 2010, fixed rate of 3.85%
|
524 | 699 | ||||
|
Due
on December 18, 2012, fixed rate of 4.84%
|
542 | 566 | ||||
|
Due
on March 18, 2013, fixed rate of 6.37%
|
499 | 571 | ||||
|
Due
on June 17, 2013, fixed rate of 3.53%
|
692 | 793 | ||||
|
Due
on June 17, 2013, fixed rate of 3.85%
|
85 | 89 | ||||
|
Due
on June 17, 2013, fixed rate of 4.11%
|
1,660 | 1,720 | ||||
|
Due
on September 23, 2013, fixed rate of 5.64%
|
727 | 824 | ||||
|
Due
on January 26, 2014, fixed rate of 5.79%
|
1,131 | |||||
|
Due
on January 27, 2014, fixed rate of 5.79%
|
1,641 | 1,191 | ||||
|
Due
on March 10, 2014, fixed rate of 4.21%
|
505 | 571 | ||||
|
Due
on May 27, 2014, fixed rate of 5.92%
|
386 | 435 | ||||
|
Due
on June 2, 2014, fixed rate of 4.52%
|
2,726 | 3,078 | ||||
|
Due
on July 20, 2016, fixed rate of 6.27%
|
1,016 | 1,134 | ||||
|
Due
on October 3, 2016, fixed rate of 5.41%
|
265 | 295 | ||||
|
Due
on October 31, 2016, fixed rate of 5.16%
|
589 | 656 | ||||
|
Due
on June 27, 2017, fixed rate of 5.53%
|
665 | 735 | ||||
|
Due
on October 31, 2017, fixed rate of 4.79%
|
819 | 903 | ||||
|
Due
on December 11, 2017, fixed rate of 4.78%
|
728 | 802 | ||||
|
Due
on February 26, 2018, fixed rate of 4.36%
|
1,735 | 1,906 | ||||
|
Due
on September 18, 2018, fixed rate of 5.15%
|
516 | 564 | ||||
|
Due
on November 5, 2018, fixed rate of 5.10%
|
3,364 | 3,499 | ||||
|
Due
on December 3, 2018, fixed rate of 4.87%
|
541 | 590 | ||||
|
Due
on December 17, 2018, fixed rate of 6.33%
|
1,401 | 1,486 | ||||
|
Due
on December 24, 2018, fixed rate of 6.29%
|
- | 681 | ||||
|
Due
on February 16, 2021, fixed rate of 3.00%
|
776 | 814 | ||||
|
Due
on January 18, 2022, fixed rate of 5.25%
|
1,033 | 3,250 | ||||
|
Due
on May 30, 2023, fixed rate of 2.50%
|
896 | 933 | ||||
|
Total
Outstanding
|
$ | 38,657 | $ | 55,464 | ||
|
(1)
|
$12.2
million is classified as short-term
borrowings.
|
|
(Dollars
in Thousands)
|
|||
|
2008
|
$
|
14,604
|
(1)
|
|
2009
|
2,465
|
||
|
2010
|
3,028
|
||
|
2011
|
2,322
|
||
|
2012
|
2,835
|
||
|
2013
and thereafter
|
13,403
|
||
|
Total
|
$
|
38,657
|
|
|
(1)
|
$12.2
million is classified as short-term
borrowings.
|
|
(Dollars
in Thousands)
|
2007
|
2006
|
2005
|
||||||||
|
Current:
|
|||||||||||
|
Federal
|
$ | 13,603 | $ | 14,780 | $ | 15,114 | |||||
|
State
|
280 | 1,527 | 1,290 | ||||||||
|
Deferred:
|
|||||||||||
|
Federal
|
(32 | ) | 1,384 | 156 | |||||||
|
State
|
(148 | ) | 230 | 26 | |||||||
|
Total
|
$ | 13,703 | $ | 17,921 | $ | 16,586 | |||||
|
(Dollars
in Thousands)
|
2007
|
2006
|
2005
|
||||||||
|
Tax
Expense at Federal Statutory Rate
|
$ | 15,185 | $ | 17,915 | $ | 16,403 | |||||
|
Increases
(Decreases) Resulting From:
|
|||||||||||
|
Tax-Exempt
Interest Income
|
(1,630 | ) | (1,334 | ) | (1,054 | ) | |||||
|
State
Taxes, Net of Federal Benefit
|
86 | 1,142 | 856 | ||||||||
|
Other
|
62 | 198 | 381 | ||||||||
|
Actual
Tax Expense
|
$ | 13,703 | $ | 17,921 | $ | 16,586 | |||||
|
(Dollars
in Thousands)
|
2007
|
2006
|
|||||
|
Deferred
Tax Assets attributable to:
|
|||||||
|
Allowance
for Loan Losses
|
$ | 7,110 | $ | 6,659 | |||
|
Associate
Benefits
|
510 | 700 | |||||
|
Unrealized
Losses on Investment Securities
|
- | 503 | |||||
|
Accrued
Pension/SERP
|
3,964 | 4,795 | |||||
|
Interest
on Nonperforming Loans
|
603 | 170 | |||||
|
State
Net Operating Loss Carry Forwards
|
511 | 399 | |||||
|
Intangible
Assets
|
95 | 70 | |||||
|
Core
Deposit Intangible
|
1,360 | 278 | |||||
|
Contingency
Reserve
|
746 | - | |||||
|
Accrued
Expense
|
611 | 612 | |||||
|
Leases
|
464 | 449 | |||||
|
Other
|
517 | 386 | |||||
|
Total
Deferred Tax Assets
|
$ | 16,491 | $ | 15,021 | |||
|
Deferred
Tax Liabilities attributable to:
|
|||||||
|
Depreciation
on Premises and Equipment
|
$ | 3,290 | $ | 4,434 | |||
|
Deferred
Loan Fees and Costs
|
3,887 | 2,550 | |||||
|
Unrealized
Gains on Investment Securities
|
113 | - | |||||
|
Intangible
Assets
|
1,619 | 1,319 | |||||
|
Accrued
Pension/SERP
|
4,669 | 2,321 | |||||
|
Securities
Accretion
|
25 | 25 | |||||
|
Market
Value on Loans Held for Sale
|
59 | 122 | |||||
|
Other
|
68 | 223 | |||||
|
Total
Deferred Tax Liabilities
|
13,730 | 10,994 | |||||
|
Net
Deferred Tax Assets
|
$ | 2,761 | $ | 4,027 | |||
|
(Dollars
in Thousands)
|
2007
|
2006
|
|||||
|
Balance
at Beginning of Year
|
$ | 4,027 | $ | 380 | |||
|
Change
in Accounting Method – Adoption of SFAS No. 158 and SAB No.
108
|
- | 5,463 | |||||
|
Income
Tax Expense From Change in Pension Liability
|
(830 | ) | - | ||||
|
Income
Tax Expense From Change in Unrealized Losses on Available-for-Sale
Securities
|
(616 | ) | (202 | ) | |||
|
Deferred
Income Tax Expense on Continuing Operations
|
180 | (1,614 | ) | ||||
|
Balance
at End of Year
|
$ | 2,761 | $ | 4,027 | |||
|
(Dollars
in Thousands)
|
2007
|
|||
|
Balance
at January 1, 2007
|
$
|
2,021
|
||
|
Addition
Based on Tax Positions Related to Prior Years
|
252
|
|||
|
Addition
Based on Tax Positions Related to
Current Years
|
981
|
|||
|
Balance
at December 31, 2007
|
$
|
3,254
|
||
|
Options
|
Shares
|
Weighted-Average
Exercise Price
|
Weighted-Average
Remaining Contractual Term
|
Aggregate
Intrinsic Value
|
||||||||
|
Outstanding
at January 1, 2007
|
60,384 | $ | 32.79 | $ | 7.9 | $ | 151,355 | |||||
|
Granted
|
- | - | - | - | ||||||||
|
Exercised
|
- | - | - | - | ||||||||
|
Forfeited
or expired
|
- | - | - | - | ||||||||
|
Outstanding
at December 31, 2007
|
60,384 | $ | 32.79 | $ | 6.9 | $ | - | |||||
|
Exercisable
at December 31, 2007
|
47,720 | $ | 32.79 | $ | 6.9 | $ | - | |||||
|
2007
|
2006
|
2005
|
||||||||||
|
Dividend
yield
|
2.1 | % | 1.9 | % | 1.9 | % | ||||||
|
Expected
volatility
|
25.5 | % | 23.5 | % | 28.0 | % | ||||||
|
Risk-free
interest rate
|
4.8 | % | 4.5 | % | 2.6 | % | ||||||
|
Expected
life (in years)
|
0.5 | 0.5 | 0.5 | |||||||||
|
(Dollars
in Thousands)
|
2007
|
2006
|
2005
|
||||||||
|
Change
in Projected Benefit Obligation:
|
|||||||||||
|
Benefit
Obligation at Beginning of Year
|
$ | 68,671 | $ | 64,131 | $ | 54,529 | |||||
|
Service
Cost
|
4,903 | 4,930 | 4,352 | ||||||||
|
Interest
Cost
|
3,967 | 3,622 | 3,253 | ||||||||
|
Actuarial
(Gain)/Loss
|
(1,420 | ) | (1,421 | ) | 2,752 | ||||||
|
Benefits
Paid
|
(5,759 | ) | (3,267 | ) | (3,501 | ) | |||||
|
Expenses
Paid
|
(244 | ) | (149 | ) | (75 | ) | |||||
|
Plan
Change
|
- | 825 | - | ||||||||
|
Acquisitions
|
- | - | 2,821 | ||||||||
|
Projected
Benefit Obligation at End of Year
|
$ | 70,118 | $ | 68,671 | $ | 64,131 | |||||
|
Accumulated
Benefit Obligation at End of Year
|
$ | 51,256 | $ | 49,335 | $ | 45,645 | |||||
|
Change
in Plan Assets:
|
|||||||||||
|
Fair
Value of Plan Assets at Beginning of Year
|
$ | 66,554 | $ | 52,277 | $ | 41,125 | |||||
|
Actual
Return on Plan Assets
|
3,602 | 6,342 | 1,737 | ||||||||
|
Employer
Contributions
|
11,500 | 11,350 | 10,500 | ||||||||
|
Benefits
Paid
|
(5,759 | ) | (3,267 | ) | (3,501 | ) | |||||
|
Expenses
Paid
|
(244 | ) | (149 | ) | (75 | ) | |||||
|
Acquisitions
|
- | - | 2,491 | ||||||||
|
Fair
Value of Plan Assets at End of Year
|
$ | 75,653 | $ | 66,553 | $ | 52,277 | |||||
|
Reconciliation
of Funded Status:
|
|||||||||||
|
Funded
Status
|
$ | * | $ | * | $ | (11,853 | ) | ||||
|
Unrecognized
Net Actuarial Losses
|
* | * | 14,823 | ||||||||
|
Unrecognized
Prior Service Cost
|
* | * | 1,302 | ||||||||
|
Prepaid
(Accrued) Benefit Cost
|
$ | * | $ | * | $ | 4,272 | |||||
|
Amounts
Recognized in the Consolidated Statements of Financial
Condition:
|
|||||||||||
|
Other
Assets
|
$ | 5,535 | $ | - | $ | * | |||||
|
Other
Liabilities
|
- | 2,117 | * | ||||||||
|
Amounts
(Pre-Tax) Recognized in Accumulated Other Comprehensive
Income:
|
|||||||||||
|
Net
Actuarial Losses
|
$ | 8,622 | $ | 9,601 | $ | * | |||||
|
Prior
Service Cost
|
1,611 | 1,912 | * | ||||||||
|
*Not Applicable due to adoption
of SFAS No. 158
effective 12/31/2006
|
|||||||||||
|
Components
of Net Periodic Benefit Costs:
|
|||||||||||
|
Service
Cost
|
$ | 4,903 | $ | 4,930 | $ | 4,352 | |||||
|
Interest
Cost
|
3,967 | 3,622 | 3,410 | ||||||||
|
Expected
Return on Plan Assets
|
(5,083 | ) | (4,046 | ) | (3,373 | ) | |||||
|
Amortization
of Prior Service Costs
|
301 | 215 | 215 | ||||||||
|
Transition
Obligation Recognition
|
- | - | 11 | ||||||||
|
Recognized
Net Actuarial Loss
|
1,039 | 1,598 | 1,324 | ||||||||
|
Net
Periodic Benefit Cost
|
$ | 5,127 | $ | 6,319 | $ | 5,939 | |||||
|
Assumptions:
|
|||||||||||
|
Weighted-average
used to determine benefit obligations:
|
|||||||||||
|
Discount
Rate
|
6.25 | % | 6.00 | % | 5.75 | % | |||||
|
Expected
Return on Plan Assets
|
8.00 | % | 8.00 | % | 8.00 | % | |||||
|
Rate
of Compensation Increase
|
5.50 | % | 5.50 | % | 5.50 | % | |||||
|
Measurement
Date
|
12/31/07
|
12/31/06
|
12/31/05
|
||||||||
|
Weighted-average
used to determine net cost:
|
|||||||||||
|
Discount
Rate
|
6.00 | % | 5.75 | % | 6.00 | % | |||||
|
Expected
Return on Plan Assets
|
8.00 | % | 8.00 | % | 8.00 | % | |||||
|
Rate
of Compensation Increase
|
5.50 | % | 5.50 | % | 5.50 | % | |||||
|
Actuarial
Loss
|
$ | 890 | ||
|
Prior
Service Cost
|
301 | |||
| $ | 1,191 |
|
Target
Allocation
|
Percentage
of Plan
Assets
at Year-End(1)
|
||||||||||
|
2008
|
2007
|
2006
|
|||||||||
|
Equity
Securities
|
65 | % | 58 | % | 55 | % | |||||
|
Debt
Securities
|
30 | % | 27 | % | 18 | % | |||||
|
Real
Estate
|
- | - | 1 | % | |||||||
|
Cash
Equivalent
|
5 | % | 15 | % | 26 | % | |||||
|
Total
|
100 | % | 100 | % | 100 | % | |||||
|
(1)
|
Represents asset allocation at
year-end which may differ from the average target allocation for the year
due to the year-end cash contribution to the
plan.
|
|
2008
|
$ | 3,803,091 | ||
|
2009
|
3,776,819 | |||
|
2010
|
3,715,534 | |||
|
2011
|
4,563,901 | |||
|
2012
|
5,547,476 | |||
|
2013
through 2017
|
36,465,818 | |||
| $ | 57,872,639 |
|
2007
|
2006
|
Expected
2008(1)
|
|||
|
Actual
Contributions
|
$
11,500,000
|
$
11,350,000
|
$
10,000,000
|
|
(Dollars
in Thousands)
|
2007
|
2006
|
2005
|
||||||||
|
Change
in Projected Benefit Obligation:
|
|||||||||||
|
Benefit
Obligation at Beginning of Year
|
$ | 4,018 | $ | 3,878 | $ | 3,601 | |||||
|
Service
Cost
|
83 | 123 | 133 | ||||||||
|
Interest
Cost
|
208 | 230 | 207 | ||||||||
|
Actuarial
(Gain) Loss
|
(603 | ) | 62 | (63 | ) | ||||||
|
Plan
Change
|
- | (274 | ) | - | |||||||
|
Projected
Benefit Obligation at End of Year
|
$ | 3,706 | $ | 4,019 | $ | 3,878 | |||||
|
Accumulated
Benefit Obligation at End of Year
|
$ | 2,603 | $ | 2,252 | $ | 2,295 | |||||
|
Reconciliation
of Funded Status:
|
|||||||||||
|
Unfunded
Status
|
$ | * | $ | * | $ | (3,878 | ) | ||||
|
Unrecognized
Net Actuarial Loss
|
* | * | 734 | ||||||||
|
Unrecognized
Prior Service Cost
|
* | * | 388 | ||||||||
|
Accrued
Benefit Cost
|
* | * | $ | (2,756 | ) | ||||||
|
Amounts
Recognized in the Consolidated Statements of Financial
Condition:
|
|||||||||||
|
Other
Liabilities
|
$ | 3,706 | $ | 4,019 | $ | * | |||||
|
Amounts
(Pre-Tax) Recognized in Accumulated Other Comprehensive
Income:
|
|||||||||||
|
Net
Actuarial (Gain) Loss
|
$ | 3 | $ | 608 | $ | * | |||||
|
Prior
Service Cost
|
44 | 52 | * | ||||||||
|
*
Not Applicable due to adoption of SFAS No. 158 effective
12/31/2006
|
|||||||||||
|
Components
of Net Periodic Benefit Costs:
|
|||||||||||
|
Service
Cost
|
$ | 83 | $ | 123 | $ | 133 | |||||
|
Interest
Cost
|
208 | 230 | 207 | ||||||||
|
Amortization
of Prior Service Cost
|
7 | 61 | 61 | ||||||||
|
Recognized
Net Actuarial Loss
|
8 | 100 | 77 | ||||||||
|
Net
Periodic Benefit Cost
|
$ | 306 | $ | 514 | $ | 478 | |||||
|
Assumptions:
|
|||||||||||
|
Weighted-average
used to determine the benefit obligations:
|
|||||||||||
|
Discount
Rate
|
6.25 | % | 6.00 | % | 5.75 | % | |||||
|
Rate
of Compensation Increase
|
5.50 | % | 5.50 | % | 5.50 | % | |||||
|
Measurement
Date
|
12/31/07
|
12/31/06
|
12/31/05
|
||||||||
|
Weighted-average
used to determine the net cost:
|
|||||||||||
|
Discount
Rate
|
6.00 | % | 5.75 | % | 6.00 | % | |||||
|
Rate
of Compensation Increase
|
5.50 | % | 5.50 | % | 5.50 | % | |||||
|
2008
|
$ | 87,468 | ||
|
2009
|
187,469 | |||
|
2010
|
230,238 | |||
|
2011
|
300,865 | |||
|
2012
|
366,840 | |||
|
2013
through 2017
|
2,950,973 | |||
| $ | 4,123,853 |
|
(Dollars
in Thousands, Except Per Share Data)
|
2007
|
2006
|
2005
|
||||||||
|
Numerator:
|
|||||||||||
|
Net
Income
|
$ | 29,683 | $ | 33,265 | $ | 30,281 | |||||
|
Denominator:
|
|||||||||||
|
Denominator
for Basic Earnings Per Share Weighted-Average Shares
|
17,909,396 | 18,584,519 | 18,263,855 | ||||||||
|
Effects
of Dilutive Securities Stock Compensation Plans
|
2,191 | 25,320 | 17,388 | ||||||||
|
Denominator
for Diluted Earnings Per Share Adjusted Weighted-Average Shares and
Assumed Conversions
|
17,911,587 | 18,609,839 | 18,281,243 | ||||||||
|
Basic
Earnings Per Share
|
$ | 1.66 | $ | 1.79 | $ | 1.66 | |||||
|
Diluted
Earnings per Share
|
$ | 1.66 | $ | 1.79 | $ | 1.66 | |||||
|
Actual
|
Required
For
Capital
Adequacy
Purposes
|
To
Be Well-
Capitalized
Under
Prompt
Corrective
Action
Provisions
|
|||||||||||||||||
|
(Dollars in Thousands)
|
Amount
|
Ratio
|
Amount
|
Ratio
|
Amount
|
Ratio
|
|||||||||||||
|
As of December 31, 2007:
|
|||||||||||||||||||
|
Tier
I Capital:
|
|||||||||||||||||||
|
CCBG
|
$
|
261,172
|
13.05
|
%
|
$
|
80,047
|
4.00
|
%
|
*
|
*
|
|||||||||
|
CCB
|
260,720
|
13.05
|
%
|
79,934
|
4.00
|
%
|
119,901
|
6.00
|
%
|
||||||||||
|
Total
Capital:
|
|||||||||||||||||||
|
CCBG
|
281,125
|
14.05
|
%
|
160,094
|
8.00
|
%
|
*
|
*
|
|||||||||||
|
CCB
|
278,787
|
13.95
|
%
|
159,868
|
8.00
|
%
|
199,835
|
10.00
|
%
|
||||||||||
|
Tier
I Leverage:
|
|||||||||||||||||||
|
CCBG
|
261,172
|
10.41
|
%
|
80,047
|
4.00
|
%
|
*
|
*
|
|||||||||||
|
CCB
|
260,720
|
10.42
|
%
|
79,934
|
4.00
|
%
|
99,917
|
5.00
|
%
|
||||||||||
|
As of December 31,
2006:
|
|||||||||||||||||||
|
Tier
I Capital:
|
|||||||||||||||||||
|
CCBG
|
$
|
280,679
|
14.00
|
%
|
$
|
80,191
|
4.00
|
%
|
*
|
*
|
|||||||||
|
CCB
|
273,425
|
13.66
|
%
|
80,055
|
4.00
|
%
|
120,082
|
6.00
|
%
|
||||||||||
|
Total
Capital:
|
|||||||||||||||||||
|
CCBG
|
299,783
|
14.95
|
%
|
160,382
|
8.00
|
%
|
*
|
*
|
|||||||||||
|
CCB
|
290,642
|
14.52
|
%
|
160,109
|
8.00
|
%
|
200,137
|
10.00
|
%
|
||||||||||
|
Tier
I Leverage:
|
|||||||||||||||||||
|
CCBG
|
280,679
|
11.30
|
%
|
80,191
|
4.00
|
%
|
*
|
*
|
|||||||||||
|
CCB
|
273,425
|
11.03
|
%
|
80,055
|
4.00
|
%
|
100,068
|
5.00
|
%
|
||||||||||
|
(Dollars
in Thousands)
|
2007
|
2006
|
2005
|
|||||||
|
Noninterest
Income:
|
||||||||||
|
Merchant
Fee Income
|
$
|
7,257
|
$
|
6,978
|
$
|
6,174
|
||||
|
Interchange
Commission Fees
|
3,757
|
3,105
|
2,239
|
|||||||
|
ATM/Debit
Card Fees
|
2,692
|
2,519
|
2,206
|
(1)
|
||||||
|
Noninterest
Expense:
|
||||||||||
|
Professional
Fees
|
3,855
|
3,402
|
3,825
|
|||||||
|
Interchange
Service Fees
|
6,118
|
6,010
|
5,402
|
|||||||
|
Telephone
|
2,373
|
2,323
|
2,493
|
|||||||
|
Advertising
|
3,742
|
4,285
|
4,275
|
|||||||
|
Printing
& Supplies
|
2,124
|
(1)
|
2,472
|
2,372
|
||||||
|
(1)
|
<1% of appropriate
threshold.
|
|
(Dollars
in Thousands)
|
Amount
|
||
|
Commitments
to Extend Credit(1)
|
$
|
437,806
|
|
|
Standby
Letters of Credit
|
$
|
17,385
|
|
|
(1)
|
Commitments include unfunded
loans, revolving lines of credit, and other unused
commitments.
|
|
At
December 31,
|
|||||||||||||||
|
2007
|
2006
|
||||||||||||||
|
(Dollars
in Thousands)
|
Carrying
Value
|
Estimated
Fair
Value
|
Carrying
Value
|
Estimated
Fair
Value
|
|||||||||||
|
Financial
Assets:
|
|||||||||||||||
|
Cash
|
$ | 93,437 | $ | 93,437 | $ | 98,769 | $ | 98,769 | |||||||
|
Short-Term
Investments
|
166,260 | 166,260 | 78,795 | 78,795 | |||||||||||
|
Investment
Securities
|
190,719 | 190,719 | 191,894 | 191,894 | |||||||||||
|
Loans,
Net of Allowance for Loan Losses
|
1,897,784 | 1,982,661 | 1,982,504 | 1,992,025 | |||||||||||
|
Total
Financial Assets
|
$ | 2,348,200 | $ | 2,433,077 | $ | 2,351,962 | $ | 2,361,483 | |||||||
|
Financial
Liabilities:
|
|||||||||||||||
|
Deposits
|
$ | 2,142,344 | $ | 2,089,550 | $ | 2,081,654 | $ | 2,007,308 | |||||||
|
Short-Term
Borrowings
|
53,131 | 53,022 | 65,023 | 64,970 | |||||||||||
|
Subordinated
Notes Payable
|
62,887 | 63,371 | 62,887 | 63,013 | |||||||||||
|
Long-Term
Borrowings
|
26,731 | 28,284 | 43,083 | 42,256 | |||||||||||
|
Total
Financial Liabilities
|
$ | 2,285,093 | $ | 2,234,227 | $ | 2,252,647 | $ | 2,177,547 | |||||||
|
(Dollars
in Thousands)
|
2007
|
2006
|
2005
|
||||||||
|
OPERATING
INCOME
|
|||||||||||
|
Income
Received from Subsidiary Bank:
|
|||||||||||
|
Dividends
|
$ | 49,207 | $ | 20,166 | $ | 10,597 | |||||
|
Overhead
Fees
|
3,532 | 3,524 | 2,716 | ||||||||
|
Other
Income
|
164 | 112 | 87 | ||||||||
|
Total
Operating Income
|
52,903 | 23,802 | 13,400 | ||||||||
|
OPERATING
EXPENSE
|
|||||||||||
|
Salaries
and Associate Benefits
|
1,812 | 2,360 | 2,191 | ||||||||
|
Interest
on Subordinated Notes Payable
|
3,730 | 3,725 | 2,981 | ||||||||
|
Professional
Fees
|
787 | 741 | 1,399 | ||||||||
|
Advertising
|
260 | 403 | 467 | ||||||||
|
Legal
Fees
|
375 | 604 | 701 | ||||||||
|
Other
|
621 | 649 | 471 | ||||||||
|
Total
Operating Expense
|
7,585 | 8,482 | 8,210 | ||||||||
|
Income
Before Income Taxes and Equity in Undistributed Earnings of Subsidiary
Bank
|
45,318 | 15,320 | 5,190 | ||||||||
|
Income
Tax Benefit
|
(1,429 | ) | (1,835 | ) | (2,060 | ) | |||||
|
Income
Before Equity in Undistributed Earnings of Subsidiary
Bank
|
46,747 | 17,155 | 7,250 | ||||||||
|
Equity
in Undistributed Earnings of Subsidiary Bank
|
(17,064 | ) | 16,110 | 23,031 | |||||||
|
Net
Income
|
$ | 29,683 | $ | 33,265 | $ | 30,281 | |||||
|
(Dollars in Thousands, Except
Per Share Data)(1)
|
2007
|
2006
|
|||||
|
ASSETS
|
|||||||
|
Cash
and Due From Subsidiary Bank
|
$ | 958 | $ | 8,921 | |||
|
Investment
in Subsidiary Bank
|
357,093 | 373,278 | |||||
|
Other
Assets
|
2,826 | 1,550 | |||||
|
Total
Assets
|
$ | 360,877 | $ | 383,749 | |||
|
LIABILITIES
|
|||||||
|
Subordinated
Notes Payable
|
$ | 62,887 | $ | 62,887 | |||
|
Other
Liabilities
|
5,315 | 5,092 | |||||
|
Total
Liabilities
|
$ | 68,202 | $ | 67,979 | |||
|
SHAREOWNERS'
EQUITY
|
|||||||
|
Preferred
Stock, $.01 par value, 3,000,000 shares authorized; no shares issued and
outstanding
|
- | - | |||||
|
Common
Stock, $.01 par value; 90,000,000 shares authorized; 17,182,553 and
18,518,398 shares issued and outstanding at December 31, 2007 and
December 31, 2006, respectively
|
172 | 185 | |||||
|
Additional
Paid-In Capital
|
38,243 | 80,654 | |||||
|
Retained
Earnings
|
260,325 | 243,242 | |||||
|
Accumulated
Other Comprehensive Loss, Net of Tax
|
(6,065 | ) | (8,311 | ) | |||
|
Total
Shareowners' Equity
|
292,675 | 315,770 | |||||
|
Total
Liabilities and Shareowners' Equity
|
$ | 360,877 | $ | 383,749 | |||
|
(1)
|
All share and per share data have
been adjusted to reflect the 5-for-4 stock split effective July 1,
2005.
|
|
2007
|
2006
|
2005
|
|||||||||
|
CASH
FLOWS FROM OPERATING ACTIVITIES:
|
|||||||||||
|
Net
Income
|
$ | 29,683 | $ | 33,265 | $ | 30,281 | |||||
|
Adjustments
to Reconcile Net Income to Net Cash Provided by Operating
Activities:
|
|||||||||||
|
Equity
in Undistributed Earnings of Subsidiary Bank
|
17,064 | (16,110 | ) | (23,031 | ) | ||||||
|
Non-Cash
Compensation
|
238 | 1,673 | 110 | ||||||||
|
Increase
in Other Assets
|
(152 | ) | (670 | ) | 131 | ||||||
|
Increase
in Other Liabilities
|
222 | 1,976 | 381 | ||||||||
|
Net
Cash Provided by Operating Activities
|
47,055 | 20,134 | 7,872 | ||||||||
|
CASH
FLOWS FROM INVESTING ACTIVITIES:
|
|||||||||||
|
Cash
Paid for Investment in:
|
|||||||||||
|
Purchase
of held-to-maturity and available-for-sale
securities
|
(1,000 | ) | - | - | |||||||
|
CCBG
Capital Trust I and CCBG Capital Trust II
|
- | - | (959 | ) | |||||||
|
Cash
Paid for Acquisitions
|
- | - | (29,953 | ) | |||||||
|
Increase
in Investment in Bank Subsidiary
|
1,466 | - | - | ||||||||
|
Net
Cash Used in Investing Activities
|
466 | - | (30,912 | ) | |||||||
|
CASH
FROM FINANCING ACTIVITIES:
|
|||||||||||
|
Proceeds
from Subordinated Notes
|
- | - | 31,959 | ||||||||
|
Payment
of Dividends
|
(12,823 | ) | (12,322 | ) | (11,397 | ) | |||||
|
Repurchase
of Common Stock
|
(43.233 | ) | (5,360 | ) | - | ||||||
|
Issuance
of Common Stock
|
572 | 1,035 | 1,019 | ||||||||
|
Net
Cash (Used in) Provided by Financing Activities
|
(55,484 | ) | (16,647 | ) | 21,581 | ||||||
|
Net
Increase (Decrease) in Cash
|
(7,963 | ) | 3,487 | (1,459 | ) | ||||||
|
Cash
at Beginning of Period
|
8,921 | 5,434 | 6,893 | ||||||||
|
Cash
at End of Period
|
$ | 958 | $ | 8,921 | $ | 5,434 | |||||
|
(Dollars in
Thousands)
|
2007
|
2006
|
2005
|
|||||||||
|
Other
Comprehensive Income (Loss):
|
||||||||||||
|
Securities available for sale:
|
||||||||||||
|
Change
in net unrealized gain (loss), net of tax expense (benefit) of $616, $202,
and $(502)
|
$ | 1,080 | $ | 412 | $ | (893 | ) | |||||
|
Retirement plans:
|
||||||||||||
|
Change
in funded status of defined benefit pension plan and SERP plan, net of tax
expense of $830
|
1,166 | - | - | |||||||||
|
Net
Other Comprehensive Gain (Loss)
|
$ | 2,246 | $ | 412 | $ | (893 | ) | |||||
|
The
components of accumulated other comprehensive income, net of tax, as of
year-end were as follows:
|
||||||||||||
|
Net unrealized gain (loss) on securities available for
sale
|
$ | 246 | $ | (834 | ) | $ | (1,246 | ) | ||||
|
Net unfunded liability for defined benefit pension plan and SERP
plan
|
(6,311 | ) | (7,477 | ) | - | |||||||
| $ | (6,065 | ) | $ | (8,311 | ) | $ | (1,246 | ) | ||||
|
Changes in and Disagreements with
Accountants on Accounting and Financial
Disclosure
|
|
Controls and
Procedures
|
|
Other
Information
|
|
Directors, Executive Officers,
and Corporate Governance
|
|
Executive
Compensation
|
|
Security Ownership of Certain
Beneficial Owners and Management and Related Shareowners
Matters
|
|
Plan
Category
|
Number
of securities to be issued upon exercise of
outstanding
options, warrants and rights
|
Weighted-average
exercise price
of
outstanding options, warrants and rights
|
Number
of securities remaining available
for
future issuance under equity
compensation
plans (excluding
securities
reflected in column (a))
|
|||
|
(a)
|
(b)
|
(c)
|
||||
|
Equity
Compensation Plans Approved by Securities Holders
|
60,384(1)
|
$32.83
|
1,410,930(2)
|
|||
|
Equity
Compensation Plans Not Approved by Securities
Holders
|
-
|
-
|
-
|
|||
|
Total
|
60,384
|
$
32.83
|
1,410,930
|
|
(1)
|
Includes 60,384 shares that may
be issued upon exercise of outstanding options under the terminated 1996
Associate Incentive Plan.
|
|
(2)
|
Consists of 814,108 shares available for issuance
under our 2005 Associate Incentive Plan, 533,938 shares available for issuance
under our 2005 Associate Stock Purchase Plan, and 62,884 shares available for issuance
under our 2005 Director Stock Purchase Plan. Of these plans, the only plan
under which options may be granted in the future is our 2005 Associate
Incentive Plan.
|
|
Item
13.
|
Certain Relationships and Related Transactions, and
Director Independence
|
|
Principal Accountant Fees and
Services
|
|
|
The
following documents are filed as part of this
report
|
|
|
2.1
|
Agreement
and Plan of Merger, dated as of February 3, 2005, by and among Capital
City Bank Group, Inc., First Alachua Banking Corporation, and First
National Bank of Alachua (the schedules and exhibits have been omitted
pursuant to Item 601(b)(2) of Regulation S-K) - incorporated herein by
reference to the Registrant’s Form 8-K (filed 2/9/05) (No.
0-13358).
|
|
|
3.1
|
Amended
and Restated Articles of Incorporation - incorporated herein by reference
to Exhibit 3 of the Registrant’s 1996 Proxy Statement (filed 4/11/96) (No.
0-13358).
|
|
|
3.2
|
Amended
and Restated Bylaws - incorporated herein by reference to Exhibit 3.2 of
the Registrant’s Form 8-K (filed 11/30/07) (No.
0-13358).
|
|
|
4.1
|
See
Exhibits 3.1, and 3.2 for provisions of Amended and Restated Articles of
Incorporation and Amended and Restated Bylaws, which define the rights of
its shareowners.
|
|
|
4.2
|
Capital
City Bank Group, Inc. 2005 Director Stock Purchase Plan - incorporated
herein by reference to Exhibit 4.3 of the Registrant’s Form S-8
(filed 11/5/04) (No. 333-120242).
|
|
|
4.3
|
Capital
City Bank Group, Inc. 2005 Associate Stock Purchase Plan - incorporated
herein by reference to Exhibit 4.4 of the Registrant’s Form S-8
(filed 11/5/04) (No. 333-120242).
|
|
|
4.4
|
Capital
City Bank Group, Inc. 2005 Associate Incentive Plan - incorporated herein
by reference to Exhibit 4.5 of the Registrant’s Form S-8 (filed
11/5/04) (No. 333-120242).
|
|
|
4.5
|
In
accordance with Regulation S-K, Item 601(b)(4)(iii)(A) certain
instruments defining the rights of holders of long-term debt of Capital
City Bank Group, Inc. not exceeding 10% of the total assets of Capital
City Bank Group, Inc. and its consolidated subsidiaries have been omitted;
the Registrant agrees to furnish a copy of any such instruments to the
Commission upon request.
|
|
|
10.1
|
Capital
City Bank Group, Inc. 1996 Dividend Reinvestment and Optional Stock
Purchase Plan - incorporated herein by reference to Exhibit 10 of the
Registrant’s Form S-3 (filed 01/30/97) (No.
333-20683).
|
|
|
10.2
|
Capital
City Bank Group, Inc. Supplemental Executive Retirement Plan -
incorporated herein by reference to Exhibit 10(d) of the Registrant’s Form
10-K (filed 3/27/03) (No. 0-13358).
|
|
|
10.3
|
Capital
City Bank Group, Inc. 401(k) Profit Sharing Plan – incorporated herein by
reference to Exhibit 4.3 of Registrant’s Form S-8 (filed 09/30/97) (No.
333-36693).
|
|
|
10.4
|
2005
Stock Option Agreement by and between Capital City Bank Group, Inc. and
William G. Smith, Jr., dated March 24, 2005 – incorporated herein by
reference to Exhibit 10.1 of the Registrant’s Form 8-K (filed 3/31/05)
(No. 0-13358).
|
|
|
10.5
|
2006
Stock Option Agreement by and between Capital City Bank Group, Inc. and
William G. Smith, Jr., dated March 23, 2006 – incorporated herein by
reference to Exhibit 10.1 of the Registrant’s Form 8-K (filed 3/29/06)
(No. 0-13358).
|
|
|
10.6
|
Capital
City Bank Group, Inc. Non-Employee Director Plan, as amended –
incorporated herein by reference to Exhibit 10.2 of the Registrant’s Form
8-K (filed 3/29/06) (No. 0-13358).
|
|
|
10.7
|
Form
of Participant Agreement for the Capital City Bank Group, Inc. Long-Term
Incentive Plan – incorporated herein by reference to Exhibit 10.1 of the
Registrant’s Form 10-Q (filed 8/10/06) (No.
0-13358).
|
|
|
11
|
Statement
re Computation of Per Share
Earnings.*
|
|
|
14
|
Capital
City Bank Group, Inc. Code of Ethics for the Chief Financial Officer and
Senior Financial Officers - incorporated herein by reference to Exhibit 14
of the Registrant’s Form 8-K (filed 3/11/05) (No.
0-13358).
|
|
*
|
Information
required to be presented in Exhibit 11 is provided in Note 13 to the
consolidated financial statements under Part II, Item 8 of this Form 10-K
in accordance with the provisions of FASB Statement of Financial
Accounting Standards (SFAS) No. 128, Earnings Per
Share.
|
|
**
|
Filed
electronically herewith.
|
|
Directors:
|
||
|
/s/
Dubose Ausley
|
/s/
L. McGrath Keen, Jr.
|
|
|
DuBose
Ausley
|
L.
McGrath Keen, Jr.
|
|
|
/s/
Thomas A. Barron
|
/s/
Lina S. Knox
|
|
|
Thomas
A. Barron
|
Lina S.
Knox
|
|
|
/s/
Frederick Carroll, III
|
/s/
Ruth A. Knox
|
|
|
Frederick
Carroll, III
|
Ruth A.
Knox
|
|
|
/s/
Cader B. Cox, III
|
/s/
Henry Lewis III
|
|
|
Cader
B. Cox, III
|
Henry
Lewis III
|
|
|
/s/
J. Everitt Drew
|
/s/
William G. Smith, Jr.
|
|
|
J.
Everitt Drew
|
William
G. Smith, Jr.
|
|
|
/s/
John K. Humphress
|
||
|
John
K. Humphress
|