UNITED STATES
SECURITIES AND EXCHANGE COMMISSION
WASHINGTON, DC 20549
____________________
FORM 10-K
|
[X]
|
|
ANNUAL REPORT PURSUANT TO SECTION 13 OR 15(d) OF THE
|
|
|
|
SECURITIES EXCHANGE
ACT OF 1934
|
|
|
|
For the fiscal year
ended December 31, 2017
|
|
|
|
OR
|
|
[ ]
|
|
TRANSITION REPORT PURSUANT TO SECTION 13 OR 15(d) OF
THE
|
|
|
|
SECURITIES EXCHANGE ACT OF 1934
|
For the transition period from ____________ to
____________

(Exact name of Registrant as specified in its charter)
|
|
|
|
|
|
|
(State of Incorporation)
|
|
(Commission File Number)
|
|
(IRS Employer Identification No.)
|
217 North Monroe
Street, Tallahassee, Florida
|
|
|
|
(Address of principal executive offices)
|
|
(Zip Code)
|
(850) 402-7821
(Registrant’s telephone number, including area code)
Securities registered pursuant to Section 12(b) of the
Act:
Title
of Each Class Name
of Each Exchange on Which Registered
Common Stock, $0.01 par
value The Nasdaq Stock Market LLC
Securities registered pursuant to Section 12(g) of the
Act: None
Indicate by check mark
if the registrant is a well-known seasoned issuer, as defined in Rule 405 of
the Securities Act. Yes [ ] No [ X ]
Indicate by check mark if the registrant is
not required to file reports pursuant to Section 13 or Section 15(d) of the
Exchange Act. Yes [ ] No [ X ]
Indicate by check mark whether the
registrant (1) has filed all reports required to be filed by Section 13 or
15(d) of the Securities Exchange Act of 1934 during the preceding 12 months (or
for such shorter period that the registrant was required to file such reports),
and (2) has been subject to such filing requirements for the past 90 days. Yes
[ X ] No [ ]
Indicate by check mark whether the
registrant has submitted electronically and posted on its corporate Web site,
if any, every Interactive Data File required to be submitted and posted
pursuant to Rule 405 of Regulation S-T (§232.405 of this chapter) during the
preceding 12 months (or for such shorter period that the registrant was
required to submit and post such files). Yes [ X ] No [ ]
Indicate by check
mark if disclosure of delinquent filers pursuant to Item 405 of Regulation S-K
is not contained herein, and will not be contained, to the best of registrant’s
knowledge, in definitive proxy or information statements incorporated by
reference in Part III of this Form 10-K or any amendment to this Form 10-K. [ X
]
Indicate
by check mark whether the registrant is a large accelerated filer, an
accelerated filer, a non-accelerated filer, or a smaller reporting company. See
definition of “large accelerated filer,” “accelerated filer,” and “smaller
reporting company” in Rule 12b-2 of the Exchange Act
Large
accelerated filer [ ] Accelerated filer [ X ] Non-accelerated
filer [ ] Smaller reporting company [ ]
Indicate by check mark whether the
registrant is a shell company (as defined in Rule 12b-2 of the Exchange Act).
Yes [ ] No [ X ]
The aggregate market value of
the registrant’s common stock, $0.01 par value per share, held by
non-affiliates of the registrant on June 30, 2017, the last business
day of the registrant’s most recently completed second fiscal quarter, was
approximately $224,913,203 (based on the closing sales price of the
registrant’s common stock on that date). Shares of the registrant’s common stock
held by each officer and director and each person known to the registrant to
own 10% or more of the outstanding voting power of the registrant have been
excluded in that such persons may be deemed to be affiliates. This
determination of affiliate status is not a determination for other purposes.
Indicate the number of shares outstanding
of each of the issuer’s classes of common stock, as of the latest practicable
date.
|
Class
|
|
Outstanding at February 28, 2018
|
|
Common Stock, $0.01 par value per share
|
|
17,038,859
|
|
|
|
|
DOCUMENTS INCORPORATED BY REFERENCE
Portions of our Proxy Statement for the
Annual Meeting of Shareowners to be held on April 24, 2018, are incorporated by
reference in Part III.
CAPITAL
CITY BANK GROUP, INC.
ANNUAL REPORT FOR 2017 ON FORM 10-K
TABLE OF CONTENTS
|
PART
I
|
|
|
|
PAGE
|
|
|
|
|
|
|
|
Item
1.
|
|
Business
|
|
4
|
|
Item
1A.
|
|
Risk
Factors
|
|
20
|
|
Item
1B.
|
|
Unresolved
Staff Comments
|
|
27
|
|
Item
2.
|
|
Properties
|
|
27
|
|
Item
3.
|
|
Legal
Proceedings
|
|
27
|
|
Item
4.
|
|
Mine
Safety Disclosure
|
|
27
|
|
|
|
|
|
|
|
PART
II
|
|
|
|
|
|
|
|
|
|
|
|
Item
5.
|
|
Market
for the Registrant’s Common Equity, Related Shareowner Matters, and Issuer
Purchases of Equity Securities
|
|
28
|
|
Item
6.
|
|
Selected
Financial Data
|
|
30
|
|
Item
7.
|
|
Management's
Discussion and Analysis of Financial Condition and Results of Operations
|
|
32
|
|
Item
7A.
|
|
Quantitative
and Qualitative Disclosure About Market Risk
|
|
62
|
|
Item
8.
|
|
Financial
Statements and Supplementary Data
|
|
63
|
|
Item
9.
|
|
Changes
in and Disagreements with Accountants on Accounting and Financial Disclosure
|
|
109
|
|
Item
9A.
|
|
Controls
and Procedures
|
|
109
|
|
Item
9B.
|
|
Other
Information
|
|
109
|
|
|
|
|
|
|
|
PART
III
|
|
|
|
|
|
|
|
|
|
|
|
Item
10.
|
|
Directors,
Executive Officers, and Corporate Governance
|
|
111
|
|
Item
11.
|
|
Executive
Compensation
|
|
111
|
|
Item
12.
|
|
Security
Ownership of Certain Beneficial Owners and Management and Related Shareowner
Matters
|
|
111
|
|
Item
13.
|
|
Certain
Relationships and Related Transactions, and Director Independence
|
|
111
|
|
Item
14.
|
|
Principal
Accountant Fees and Services
|
|
111
|
|
|
|
|
|
|
|
PART
IV
|
|
|
|
|
|
|
|
|
|
|
|
Item
15.
|
|
Exhibits
and Financial Statement Schedules
|
|
112
|
|
Item
16.
|
|
Form
10-K Summary
|
|
113
|
|
|
|
|
|
|
|
Signatures
|
|
114
|
INTRODUCTORY NOTE
This Annual Report on Form 10-K
contains “forward-looking statements” within the meaning of the Private
Securities Litigation Reform Act of 1995. These forward-looking statements
include, among others, statements about our beliefs, plans, objectives, goals,
expectations, estimates and intentions that are subject to significant risks
and uncertainties and are subject to change based on various factors, many of
which are beyond our control. The words “may,” “could,” “should,” “would,”
“believe,” “anticipate,” “estimate,” “expect,” “intend,” “plan,” “target,” “vision,”
“goal,” and similar expressions are intended to identify forward-looking
statements.
All forward-looking statements,
by their nature, are subject to risks and uncertainties. Our actual future results
may differ materially from those set forth in our forward-looking statements.
In addition to those risks
discussed in this Annual Report under Item 1A Risk Factors, factors that could
cause our actual results to differ materially from
those in the forward-looking statements, include, without limitation:
·
our
ability to successfully manage interest rate risk, liquidity risk, and other
risks inherent to our industry;
·
legislative
or regulatory changes, including the Dodd-Frank Act, Basel III, and the ability
to repay and qualified mortgage standards;
·
the
effects of security breaches and computer viruses that may affect our computer
systems or fraud related to our debit card products;
·
the
accuracy of our financial statement estimates and assumptions, including the
estimates used for our loan loss reserve and deferred tax asset valuation
allowance and pension plan;
·
the
frequency and magnitude of foreclosure of our loans;
·
the
effects of our lack of a diversified loan portfolio, including the risks of geographic
and industry concentrations;
·
the
strength of the United States economy in general and the strength of the local
economies in which we conduct operations;
·
our
ability to declare and pay dividends, the payment of which is subject to our capital
requirements;
·
changes
in the securities and real estate markets;
·
changes
in monetary and fiscal policies of the U.S. Government;
·
inflation,
interest rate, market and monetary fluctuations;
·
the
effects of harsh weather conditions, including hurricanes, and man-made
disasters;
·
our
ability to comply with the extensive laws and regulations to which we are
subject, including the laws for each jurisdiction where we operate;
·
the
willingness of clients to accept third-party products and services rather than
our products and services and vice versa;
·
increased
competition and its effect on pricing;
·
technological
changes;
·
negative
publicity and the impact on our reputation;
·
changes
in consumer spending and saving habits;
·
growth
and profitability of our noninterest income;
·
changes
in accounting principles, policies, practices or guidelines;
·
the
limited trading activity of our common stock;
·
the
concentration of ownership of our common stock;
·
anti-takeover
provisions under federal and state law as well as our Articles of Incorporation
and our Bylaws;
·
other
risks described from time to time in our filings with the Securities and
Exchange Commission; and
·
our
ability to manage the risks involved in the foregoing.
However, other factors besides those listed in Item 1A Risk Factors
or discussed in this Annual Report also could adversely affect our results, and
you should not consider any such list of factors to be a complete set of all
potential risks or uncertainties. Any forward-looking statements made by us or
on our behalf speak only as of the date they are made. We do not undertake to
update any forward-looking statement, except as required by applicable law.
PART I
Item
1. Business
About Us
General
Capital City Bank Group, Inc.
(“CCBG”) is a financial holding company headquartered in Tallahassee, Florida.
CCBG was incorporated under Florida law on December 13, 1982, to acquire five
national banks and one state bank that all subsequently became part of CCBG’s
bank subsidiary, Capital City Bank (“CCB” or the “Bank”). The Bank commenced
operations in 1895. In this report, the terms “Company,” “we,” “us,” or “our”
mean CCBG and all subsidiaries included in our consolidated financial
statements.
We provide traditional deposit
and credit services, asset management, trust, mortgage banking, merchant
services, bank cards, data processing, and securities brokerage services
through 59 banking offices in Florida, Georgia, and Alabama operated by CCB.
The majority of our revenue, approximately 88%, is derived from our Florida
market areas while approximately 11% and 1% of our revenue is derived from our
Georgia and Alabama market areas, respectively.
Below is a summary of our financial condition and
results of operations for the past three years. Our financial condition and
results of operations are more fully discussed in our management discussion and
analysis on page 32 and our consolidated financial statements on page 66.
|
Dollars in millions
|
|
|
|
|
|
Year Ended December 31,
|
Assets
|
Deposits
|
Shareowners’ Equity
|
Revenue(1)
|
Net Income
|
|
2017
|
$2,898.8
|
$2,469.9
|
$284.2
|
$138.7
|
$10.9
|
|
2016
|
$2,845.2
|
$2,412.3
|
$275.2
|
$134.8
|
$11.7
|
|
2015
|
$2,797.9
|
$2,302.8
|
$274.4
|
$133.7
|
$9.1
|
|
(1)Revenue
represents interest income plus noninterest income
|
|
|
Dividends and management fees
received from the Bank are CCBG’s primary source of income. Dividend payments
by the Bank to CCBG depend on the capitalization, earnings and projected growth
of the Bank, and are limited by various regulatory restrictions, including
compliance with a minimum Common Equity Tier 1 Capital conservation buffer.
See the section entitled “Regulatory Matters” in this Item 1 and
Note 14 in the Notes to Consolidated Financial Statements for a discussion of
the restrictions.
We had a total of 825
associates at March 1, 2018. Item 6 contains other financial and statistical
information about us.
Subsidiaries of CCBG
CCBG’s
principal asset is the capital stock of CCB, our wholly owned banking
subsidiary, which accounted for nearly 100% of consolidated assets at December
31, 2017, and approximately 100% of consolidated net income for the year ended
December 31, 2017. In addition to our banking subsidiary, CCB has three
primary wholly owned subsidiaries, Capital City Trust Company, Capital City
Banc Investments, Inc., and Capital City Services Company. The nature of these
subsidiaries is provided below.
Operating
Segment
We
have one reportable segment with four principal services: Banking Services (CCB),
Data Processing Services (Capital City Services Company), Trust and Asset
Management Services (Capital City Trust Company), and Brokerage Services
(Capital City Banc Investments, Inc.). Revenues from each of these principal
services for the year ended 2017 totaled approximately 93.6%, 0.5%, 3.6%, and 2.3% of
our total revenue, respectively. In 2016 and 2015, Banking Services (CCB)
revenue was approximately 93.7% and 93.8% of our total revenue for each
respective year.
Capital City Bank
CCB is a Florida-chartered
full-service bank engaged in the commercial and retail banking business.
Significant services offered by the Bank include:
·
Business Banking – We provide banking services to corporations and
other business clients. Credit products are available for a wide variety of general
business purposes, including financing for commercial business properties,
equipment, inventories and accounts receivable, as well as commercial leasing
and letters of credit. We also provide treasury management services, and,
through a marketing alliance with Elavon, Inc., merchant credit card
transaction processing services.
·
Commercial Real Estate Lending – We provide a wide range of products to meet the
financing needs of commercial developers and investors, residential builders
and developers, and community development. Credit products are available to
purchase land and build structures for business use and for investors who are
developing residential or commercial property.
·
Residential Real Estate Lending – We provide products to help meet the home financing
needs of consumers, including conventional permanent and construction/
permanent (fixed, adjustable, or variable rate) financing arrangements, and
FHA/VA loan products. We offer both fixed-rate and adjustable rate residential
mortgage (ARM) loans. A portion of our loans originated are sold into the
secondary market. We offer these products through its existing network of
banking offices. We do not originate subprime residential real estate loans.
·
Retail Credit – We provide a full-range of loan products to meet
the needs of consumers, including personal loans, automobile loans, boat/RV
loans, home equity loans, and through a marketing alliance with ELAN, we offer
credit card programs.
·
Institutional Banking – We provide banking services to meet the needs of state
and local governments, public schools and colleges, charities, membership and
not-for-profit associations including customized checking and savings accounts,
cash management systems, tax-exempt loans, lines of credit, and term loans.
·
Retail Banking – We provide a full-range of consumer banking
services, including checking accounts, savings programs, automated teller
machines (ATMs), debit/credit cards, night deposit services, safe deposit
facilities, online banking, and mobile banking. Our clients can use Capital
City Bank Direct, which offers a “live” call center between the hours of 8 a.m.
to 6 p.m., Monday through Friday, and from 9 a.m. to 12 noon on Saturday. The
call center can also be accessed via live chat through the internet between the
hours of 7 a.m. to 10 p.m., Monday through Friday, and from 9 a.m. to 12 noon
on Saturday. Capital City Bank Direct also offers an automated phone system
offering 24-hour access to client deposit and loan account information and
transfer of funds between linked accounts. We are a member of the “Star”,
“Plus” and “Presto” ATM Networks that permit banking clients to access cash at
ATMs or “point-of-sale” merchants.
Capital City Trust
Company
Capital City Trust Company (the
“Trust Company”) is the investment management arm of CCB. The Trust Company
provides asset management for individuals through agency, personal trust, IRA,
and personal investment management accounts. Associations, endowments, and
other nonprofit entities hire the Trust Company to manage their investment
portfolios. Additionally, a staff of well-trained professionals serves
individuals requiring the services of a trustee, personal representative, or a
guardian. The market value of trust assets under discretionary management exceeded
$805.5 million
as of December 31, 2017, with total assets under administration exceeding $869.9
million.
Capital City Banc
Investments, Inc.
Capital
City Banc Investments, Inc. formerly offered our customers access to retail
investment products through INVEST Financial Corporation, a member of FINRA and
SIPC. CCB recently entered into an agreement with LPL Financial pursuant to
which retail investment products would be offered through LPL. LPL offers a
full line of retail securities products, including U.S. Government bonds,
tax-free municipal bonds, stocks, mutual funds, unit investment trusts,
annuities, life insurance and long-term health care. Non-deposit investment and
insurance products are: (i) not FDIC insured; (ii) not deposits, obligations, or
guarantees by any bank; and (iii) subject to investment risk, including the
possible loss of principal amount invested. We are not an affiliate of LPL
Financial.
Capital City Services
Company
Until
recently, Capital City Services Company (the “Services Company”) provided data
processing services to financial institutions (including CCB), government
agencies, and commercial clients located in North Florida and South Georgia.
The Services Company’s last remaining client discontinued services in the fourth
quarter of 2017.
Underwriting Standards
One of our core goals is to support the communities in
which we operate. We seek loans from within our primary market area, which is
defined as the counties in which our banking offices are located. We will also
originate loans within our secondary market area, defined as counties adjacent
to those in which we have banking offices. There may also be occasions when we
will have opportunities to make loans that are out of both the primary and
secondary market areas, including participation loans. These loans are
generally only approved if the applicant is known to us, underwriting is
consistent with our criteria, and the applicant’s primary business is in or
near our primary or secondary market area. Approval of all loans is subject to
our policies and standards described in more detail below.
We
have adopted comprehensive lending policies, underwriting standards and loan
review procedures. Management and our Board of Directors reviews and approves
these policies and procedures on a regular basis (at least annually).
Management
has also implemented reporting systems designed to monitor loan originations,
loan quality, concentrations of credit, loan delinquencies, nonperforming
loans, and potential problem loans. Our management and the Credit Risk
Oversight Committee periodically review our lines of business to monitor asset
quality trends and the appropriateness of credit policies. In addition, total
borrower exposure limits are established and concentration risk is monitored.
As part of this process, the overall composition of the portfolio is reviewed
to gauge diversification of risk, client concentrations, industry group, loan
type, geographic area, or other relevant classifications of loans. Specific
segments of the portfolio are monitored and reported to our Board on a
quarterly basis and we have strategic plans in place to supplement Board
approved credit policies governing exposure limits and underwriting standards.
We recognize that exceptions to the below-listed policy guidelines may
occasionally occur and has established procedures for approving exceptions to
these policy guidelines.
Residential Real Estate
Loans
We
originate 1-4 family, owner-occupied residential real estate loans in its
Residential Real Estate line of business. Our policy is to underwrite these
loans in accordance with secondary market guidelines in effect at the time of
origination, including loan-to-value (“LTV”) and documentation requirements. We
originate fixed-rate, adjustable-rate and variable- rate residential real
estate loans. Over the past five years, the vast majority of residential loan
originations have been fixed-rate loans which are sold in the secondary market
on a non-recourse basis with related servicing rights (i.e., we generally do
not service sold loans). Adjustable rate mortgage (“ARM”) loans with an
initial fixed interest rate period greater than five years are also sold in the
secondary market on a non-recourse basis.
We
also originate certain residential real estate loans throughout its banking
office network that are generally not eligible for sale into the secondary
market due to not meeting a specific secondary market underwriting requirement.
This includes our variable rate 3/1 and 5/1 ARM loans which typically have a
maximum term of 30 years and maximum LTV of 80%.
Residential
real estate loans also include home equity lines of credit (“HELOCs”) and home
equity loans. Our home equity portfolio includes revolving open-ended equity
loans with interest-only or minimal monthly principal payments and closed-end
amortizing loans. Open-ended equity loans typically have an interest only
10-year draw period followed by a five year repayment period of 0.75% of
principal balance monthly and balloon payment at maturity. As of December 31,
2017, approximately 66% of our residential home equity loan portfolio consisted
of first mortgages. Interest rates may be fixed or adjustable.
Adjustable-rate loans are tied to the Prime Rate with a typical margin of 1.0%
or more.
Commercial Loans
Our
policy sets forth guidelines for debt service coverage ratios, LTV ratios and
documentation standards. Commercial loans are primarily made based on
identified cash flows of the borrower with consideration given to underlying
collateral and personal or other guarantees. We have established debt service
coverage ratio limits that require a borrower’s cash flow to be sufficient to
cover principal and interest payments on all new and existing debt. The
majority of our commercial loans are secured by the assets being financed or
other business assets such as accounts receivable or inventory. Many of the
loans in the commercial portfolio have variable interest rates tied to the
Prime Rate or U.S. Treasury indices.
Commercial Real Estate
Loans
We
have adopted guidelines for debt service coverage ratios, LTV ratios and
documentation standards for commercial real estate loans. These loans are
primarily made based on identified cash flows of the borrower with
consideration given to underlying real estate collateral and personal
guarantees. Our policy establishes a maximum LTV specific to property type and
minimum debt service coverage ratio limits that require a borrower’s cash flow
to be sufficient to cover principal and interest payments on all new and
existing debt. Commercial real estate loans may be fixed or variable-rate loans
with interest rates tied to the Prime Rate or U.S. Treasury indices. We require
appraisals for loans in excess of $250,000 that are secured by real property.
Consumer Loans
Our consumer loan portfolio includes personal
installment loans, direct and indirect automobile financing, and overdraft
lines of credit. The majority of the consumer loan portfolio consists of
indirect and direct automobile loans. The majority of our consumer loans are
short-term and have fixed rates of interest that are priced based on current
market interest rates and the financial strength of the borrower. Our policy
establishes maximum debt-to-income ratios, minimum credit scores, and includes
guidelines for verification of applicants’ income and receipt of credit reports.
Lending Limits and Extensions of Additional Credit
We
have established an internal lending limit of $10.0 million for the total
aggregate amount of credit that will be extended to a client and any related
entities within its Board approved policies. This compares to our legal lending
limit of approximately $81 million. In practice, we seek to maintain an internal
lending limit of $10 million (aggregate exposure to one borrowing relationship)
which we believe helps us maintain a well-diversified loan portfolio.
Loan
Modification and Restructuring
In
the normal course of business, we receive requests from our clients to renew,
extend, refinance, or otherwise modify their current loan obligations. In most
cases, this may be the result of a balloon maturity that is common in most
commercial loan agreements, a request to refinance to obtain current market
rates of interest, competitive reasons, or the conversion of a construction
loan to a permanent financing structure at the completion or stabilization of
the property. In these cases, the request is held to the normal underwriting
standards and pricing strategies as any other loan request, whether new or
renewal.
In other cases, we may modify a loan because of a reduction in debt
service capacity experienced by the client (i.e., a potentially troubled loan
whereby the client may be experiencing financial difficulties). To maximize the
collection of loan balances, we evaluate troubled loans on a case-by-case basis
to determine if a loan modification would be appropriate. We pursue loan
modifications when there is a reasonable chance that an appropriate
modification would allow our client to continue servicing the debt.
Expansion of
Business
Our
philosophy is to build long-term client relationships based on quality service,
high ethical standards, and safe and sound banking practices. We maintain a
locally oriented, community-based focus, which is augmented by experienced,
centralized support in select specialized areas. Our local market orientation
is reflected in our network of banking office locations, experienced community
executives with a dedicated President for each market, and community boards
which support our focus on responding to local banking needs. We strive to
offer a broad array of sophisticated products and to provide quality service by
empowering associates to make decisions in their local markets.
We have sought to build a franchise in small-to medium-sized, less
competitive markets, located on the outskirts of the larger metropolitan
markets where we are positioned as a market leader. Many of our markets are on
the outskirts of these larger markets in close proximity to major interstate
thoroughfares such as Interstates I-10 and I-75. Our three largest markets are
Tallahassee (Leon-Florida), Gainesville (Alachua-Florida), and Macon
(Bibb-Georgia). In 13 of 19 markets in Florida and two of four markets in
Georgia, we rank within the top four banks in terms of market share.
Furthermore, in the counties in which we operate, we maintain a 9.82% market
share in the Florida counties and 5.57% in the Georgia counties, suggesting
that there is significant opportunity to grow market share within these
geographic areas. The larger employers in many of our markets are state and
local governments, healthcare providers, educational institutions, and small
businesses. While we realize that the markets in our footprint do not provide
for a level of potential growth that the larger metropolitan markets may
provide, our markets do provide good growth dynamics and have historically
grown in excess of the national average The value of these markets stems from
the fact they are stable and less competitive, secondary markets. We strive to
provide value added services to our clients by being not just their bank, but
their banker. This element of our strategy distinguishes Capital City Bank
from our competitors.
Our long-term vision remains to profitably expand our franchise
through a combination of organic growth in existing markets and acquisitions.
We have long understood that our core deposit funding base is a predominant
driver of our profitability and overall franchise value, and have focused
extensively on this component of our organic growth efforts in recent years.
While we have not been an active acquirer of banks since 2005, this component
of our strategy is still in place. When evaluating potential acquisition
opportunities, we will continue to weigh the value of organic growth
initiatives versus potential acquisition returns and pursue the strategies that
we believe provide the best overall return to our shareowners.
Potential acquisition
opportunities will continue to be focused on Florida, Georgia, and Alabama with
a particular focus on financial institutions located on the outskirts of
larger, metropolitan areas. Five markets have been identified, four in Florida
and one in Georgia, in which management intends to proactively pursue expansion
opportunities. These markets include Alachua, Marion, Hernando/Pasco counties
in Florida, the western panhandle of Florida, and Bibb and surrounding counties
in central Georgia. Our focus on some of these markets may change as we
continue to evaluate our strategy and the economic conditions and demographics
of any individual market. We will also continue to evaluate de novo expansion
opportunities in attractive new markets in the event that acquisition
opportunities are not feasible. Other expansion opportunities that will be
evaluated include asset management, mortgage banking, and other financial
businesses that are closely aligned with the business of banking. Embedded in
our acquisition strategy is our desire to partner with institutions that are
culturally similar, have experienced management and possess either established
market presence or have potential for improved profitability through growth,
economies of scale, or expanded services. Generally, these target institutions
will range in asset size from $100 million to $500 million.
Competition
We operate in a highly
competitive environment, especially with respect to services and pricing. In
addition, the banking business is experiencing enormous changes. Since January
1, 2009, over 500 financial institutions have failed in the U.S., including 85
in Georgia and 70 in Florida. Nearly all of the failed banks were community
banks. The assets and deposits of many of these failed community banks were
acquired mostly by larger financial institutions. The market has stabilized
since the downturn in 2008. In late 2016, the first de novo bank charter in
Florida since 2009 was approved and opened for business in the third quarter of
2017. However, we expect consolidation to continue during 2018, substantially
through traditional merger and acquisition activity. We believe that the larger
financial institutions acquiring banks in our market areas are less familiar
with the markets in which we operate and typically target a different client
base. We believe clients who bank at community banks tend to prefer the
relationship style service of community banks compared to larger banks.
As a result, we expect to be
able to effectively compete in our markets with larger financial institutions
through providing superior customer service and leveraging our knowledge and
experience in providing banking products and services in our market areas.
Thus, a further reduction of the number of community banks could continue to
enhance our competitive position and opportunities in many of our markets.
However, larger financial institutions can benefit from economies of scale.
Therefore, these larger institutions may be able to offer banking products and
services at more competitive prices than us. Additionally, these larger financial
institutions may offer financial products that we do not offer.
Our primary market area
consists of 20 counties in Florida, four counties in Georgia, and one county in
Alabama. In these markets, we compete against a wide range of banking and
nonbanking institutions including banks, savings and loan associations, credit
unions, money market funds, mutual fund advisory companies, mortgage banking
companies, investment banking companies, finance companies and other types of
financial institutions. Most of Florida’s major banking concerns have a
presence in Leon County, where our main office is located. Our Leon County
deposits totaled $967.2 million, or 39.2% of our consolidated deposits at
December 31, 2017.
|
The table below depicts our market share
percentage within each county, based on commercial bank deposits within the
county.
|
|
|
|
|
|
|
|
|
|
Market Share as of June 30,(1)
|
|
County
|
2017
|
|
2016
|
|
2015
|
|
Florida
|
|
|
|
|
|
|
Alachua
|
4.9%
|
|
4.9%
|
|
4.7%
|
|
Bradford
|
42.5%
|
|
46.1%
|
|
49.9%
|
|
Citrus
|
3.5%
|
|
3.5%
|
|
3.5%
|
|
Clay
|
2.2%
|
|
1.9%
|
|
1.9%
|
|
Dixie
|
22.1%
|
|
15.2%
|
|
15.8%
|
|
Gadsden
|
78.9%
|
|
77.7%
|
|
77.4%
|
|
Gilchrist
|
44.4%
|
|
46.8%
|
|
45.5%
|
|
Gulf
|
16.4%
|
|
15.5%
|
|
13.9%
|
|
Hernando
|
2.3%
|
|
2.1%
|
|
1.9%
|
|
Jefferson
|
21.9%
|
|
22.5%
|
|
21.9%
|
|
Leon
|
12.5%
|
|
13.9%
|
|
13.2%
|
|
Levy
|
28.3%
|
|
29.2%
|
|
27.1%
|
|
Madison
|
14.9%
|
|
14.2%
|
|
13.2%
|
|
Putnam
|
20.8%
|
|
21.3%
|
|
19.6%
|
|
St. Johns
|
0.7%
|
|
0.8%
|
|
0.8%
|
|
Suwannee
|
7.8%
|
|
7.6%
|
|
8.2%
|
|
Taylor
|
19.7%
|
|
18.0%
|
|
19.0%
|
|
Wakulla
|
14.2%
|
|
14.5%
|
|
14.8%
|
|
Washington
|
14.1%
|
|
14.2%
|
|
12.9%
|
|
Georgia
|
|
|
|
|
|
|
Bibb
|
3.2%
|
|
3.2%
|
|
3.4%
|
|
Grady
|
13.7%
|
|
13.4%
|
|
14.1%
|
|
Laurens
|
9.3%
|
|
9.3%
|
|
9.6%
|
|
Troup
|
5.9%
|
|
5.4%
|
|
6.1%
|
|
Alabama
|
|
|
|
|
|
|
Chambers
|
9.1%
|
|
9.2%
|
|
8.6%
|
|
|
|
|
|
|
|
|
(1)
Obtained from the FDIC Summary of Deposits Report for the year indicated.
|
|
|
|
|
|
|
The following table sets forth the
number of commercial banks and offices, including our offices and our
competitor's offices, within
|
|
each of the respective counties.
|
|
|
|
|
|
|
|
|
|
County
|
Number of Commercial Banks
|
|
Number of Commercial Bank Offices
|
|
Florida
|
|
|
|
|
Alachua
|
18
|
|
62
|
|
Bradford
|
3
|
|
3
|
|
Citrus
|
12
|
|
40
|
|
Clay
|
13
|
|
31
|
|
Dixie
|
3
|
|
4
|
|
Gadsden
|
2
|
|
3
|
|
Gilchrist
|
4
|
|
6
|
|
Gulf
|
3
|
|
4
|
|
Hernando
|
13
|
|
35
|
|
Jefferson
|
2
|
|
2
|
|
Leon
|
16
|
|
75
|
|
Levy
|
2
|
|
11
|
|
Madison
|
3
|
|
3
|
|
Pasco
|
20
|
|
99
|
|
Putnam
|
6
|
|
11
|
|
St. Johns
|
22
|
|
66
|
|
Suwannee
|
5
|
|
8
|
|
Taylor
|
3
|
|
4
|
|
Wakulla
|
4
|
|
4
|
|
Washington
|
6
|
|
6
|
|
Georgia
|
|
|
|
|
Bibb
|
12
|
|
43
|
|
Grady
|
5
|
|
7
|
|
Laurens
|
10
|
|
20
|
|
Troup
|
11
|
|
20
|
|
Alabama
|
|
|
|
|
Chambers
|
6
|
|
9
|
|
|
|
|
|
|
Data obtained from the FDIC June 30, 2017 Summary of
Deposits Report.
|
|
|
|
Seasonality
We believe our commercial banking operations are not
generally seasonal in nature; however, public deposits tend to increase with
tax collections in the fourth and first quarters of each year and decline with
spending thereafter.
Regulatory Considerations
We must comply with state and federal
banking laws and regulations that control virtually all aspects of our
operations. These laws and regulations generally aim to protect our depositors,
not necessarily our shareowners or our creditors. Any changes in applicable
laws or regulations may materially affect our business and prospects. Proposed
legislative or regulatory changes may also affect our operations. The following
description summarizes some of the laws and regulations to which we are
subject. References to applicable statutes and regulations are brief summaries,
do not purport to be complete, and are qualified in their entirety by reference
to such statutes and regulations.
The Company
We are registered with the Board of Governors of the Federal
Reserve as a financial holding company under the Bank Holding Company Act of
1956. As a result, we are subject to supervisory regulation and examination by
the Federal Reserve. The Gramm-Leach-Bliley Act, the Bank Holding Company Act,
and other federal laws subject financial holding companies to particular
restrictions on the types of activities in which they may engage, and to a
range of supervisory requirements and activities, including regulatory
enforcement actions for violations of laws and regulations.
Permitted Activities
The Gramm-Leach-Bliley Act modernized the U.S. banking system by:
(i) allowing bank holding companies that qualify as “financial holding
companies,” such as CCBG, to engage in a broad range of financial and related
activities; (ii) allowing insurers and other financial service companies to
acquire banks; (iii) removing restrictions that applied to bank holding company
ownership of securities firms and mutual fund advisory companies; and (iv) establishing
the overall regulatory scheme applicable to bank holding companies that also
engage in insurance and securities operations. The general effect of the law
was to establish a comprehensive framework to permit affiliations among
commercial banks, insurance companies, securities firms, and other financial
service providers. Activities that are financial in nature are broadly defined
to include not only banking, insurance, and securities activities, but also
merchant banking and additional activities that the Federal Reserve, in
consultation with the Secretary of the Treasury, determines to be financial in
nature, incidental to such financial activities, or complementary activities
that do not pose a substantial risk to the safety and soundness of depository
institutions or the financial system generally.
In contrast to financial holding
companies, bank holding companies are limited to managing or controlling banks,
furnishing services to or performing services for its subsidiaries, and
engaging in other activities that the Federal Reserve determines by regulation
or order to be so closely related to banking or managing or controlling banks
as to be a proper incident thereto. In determining whether a particular
activity is permissible, the Federal Reserve must consider whether the
performance of such an activity reasonably can be expected to produce benefits
to the public that outweigh possible adverse effects. Possible benefits include
greater convenience, increased competition, and gains in efficiency. Possible
adverse effects include undue concentration of resources, decreased or unfair
competition, conflicts of interest, and unsound banking practices. Despite
prior approval, the Federal Reserve may order a bank holding company or its
subsidiaries to terminate any activity or to terminate ownership or control of
any subsidiary when the Federal Reserve has reasonable cause to believe that a
serious risk to the financial safety, soundness or stability of any bank
subsidiary of that bank holding company may result from such an activity.
Changes in Control
Subject to certain exceptions, the Bank Holding Company Act and
the Change in Bank Control Act, together with the applicable regulations,
require Federal Reserve approval (or, depending on the circumstances, no notice
of disapproval) prior to any person or company acquiring “control” of a bank or
bank holding company. A conclusive presumption of control exists if an
individual or company acquires the power, directly or indirectly, to direct the
management or policies of an insured depository institution or to vote 25% or
more of any class of voting securities of any insured depository institution. A
rebuttable presumption of control exists if a person or company acquires 10% or
more but less than 25% of any class of voting securities of an insured
depository institution and either the institution has registered securities
under Section 12 of the Securities Exchange Act of 1934, which we will refer to
as the Exchange Act, or no other person will own a greater percentage of that
class of voting securities immediately after the acquisition. Our common stock
is registered under Section 12 of the Exchange Act.
The Federal Reserve Board maintains a policy statement on minority
equity investments in banks and bank holding companies, that generally permits
investors to (i) acquire up to 33% of the total equity of a target bank or
bank holding company, subject to certain conditions, including (but not limited
to) that the investing firm does not acquire 15% or more of any class of voting
securities, and (ii) designate at least one director, without triggering
the various regulatory requirements associated with control.
As a financial holding company, we are
required to obtain prior approval from the Federal Reserve before (i) acquiring
all or substantially all of the assets of a bank or bank holding company, (ii)
acquiring direct or indirect ownership or control of more than 5% of the
outstanding voting stock of any bank or bank holding company (unless we own a
majority of such bank’s voting shares), or (iii) merging or consolidating with
any other bank or bank holding company. In determining whether to approve a
proposed bank acquisition, federal bank regulators will consider, among other
factors, the effect of the acquisition on competition, the public benefits
expected to be received from the acquisition, the projected capital ratios and
levels on a post-acquisition basis, and the acquiring institution’s record of
addressing the credit needs of the communities it serves, including the needs
of low and moderate income neighborhoods, consistent with the safe and sound
operation of the bank, under the Community Reinvestment Act of 1977.
Under Florida law, a person or entity proposing to directly or indirectly
acquire control of a Florida bank must also obtain permission from the Florida
Office of Financial Regulation. Florida statutes define “control” as either (i)
indirectly or directly owning, controlling or having power to vote 25% or more
of the voting securities of a bank; (ii) controlling the election of a majority
of directors of a bank; (iii) owning, controlling, or having power to vote 10%
or more of the voting securities as well as directly or indirectly exercising a
controlling influence over management or policies of a bank; or (iv) as
determined by the Florida Office of Financial Regulation. These requirements
will affect us because CCB is chartered under Florida law and changes in
control of CCBG are indirect changes in control of CCB.
Tying
Financial holding companies and their affiliates are prohibited
from tying the provision of certain services, such as extending credit, to
other services or products offered by the holding company or its affiliates,
such as deposit products.
Capital; Dividends; Source of Strength
The Federal Reserve imposes certain
capital requirements on financial holding companies under the Bank Holding
Company Act, including a minimum leverage ratio and a minimum ratio of
“qualifying” capital to risk-weighted assets. These requirements are described
below under “Capital Regulations.” Subject to its capital requirements and
certain other restrictions, we are generally able to borrow money to make a
capital contribution to CCB, and such loans may be repaid from dividends paid
from CCB to us. We are also able to raise capital for contributions to CCB by
issuing securities without having to receive regulatory approval, subject to
compliance with federal and state securities laws.
In accordance with Federal Reserve policy, which has been codified
by the Dodd-Frank Act, we are expected to act as a source of financial strength
to CCB and to commit resources to support CCB in circumstances in which we
might not otherwise do so. In furtherance of this policy, the Federal Reserve
may require a financial holding company to terminate any activity or relinquish
control of a nonbank subsidiary (other than a nonbank subsidiary of a bank)
upon the Federal Reserve’s determination that such activity or control constitutes
a serious risk to the financial soundness or stability of any subsidiary
depository institution of the financial holding company. Further, federal bank
regulatory authorities have additional discretion to require a financial
holding company to divest itself of any bank or nonbank subsidiary if the
agency determines that divestiture may aid the depository institution’s
financial condition.
Capital City Bank
Capital City Bank is a state-chartered
commercial banking institution that is chartered by and headquartered in the
State of Florida, and is subject to supervision and regulation by the Florida
Office of Financial Regulation. The Florida Office of Financial Regulation
supervises and regulates all areas of our operations including, without
limitation, the making of loans, the issuance of securities, the conduct of our
corporate affairs, the satisfaction of capital adequacy requirements, the
payment of dividends, and the establishment or closing of banking centers. We
are also a member bank of the Federal Reserve System, which makes our
operations subject to broad federal regulation and oversight by the Federal
Reserve. In addition, our deposit accounts are insured by the FDIC up to the
maximum extent permitted by law, and the FDIC has certain enforcement powers
over us.
As a state-chartered bank in the State of
Florida, we are empowered by statute, subject to the limitations contained in
those statutes, to take and pay interest on, savings and time deposits, to
accept demand deposits, to make loans on residential and other real estate, to
make consumer and commercial loans, to invest, with certain limitations, in
equity securities and in debt obligations of banks and corporations and to
provide various other banking services for the benefit of our clients. Various
consumer laws and regulations also affect our operations, including state usury
laws, laws relating to fiduciaries, consumer credit and equal credit
opportunity laws, and fair credit reporting. In addition, the Federal Deposit
Insurance Corporation Improvement Act of 1991 (“FDICIA”) prohibits insured
state chartered institutions from conducting activities as principal that are
not permitted for national banks. A bank, however, may engage in an otherwise
prohibited activity if it meets its minimum capital requirements and the FDIC
determines that the activity does not present a significant risk to the Deposit
Insurance Fund.
Reserves
The Federal Reserve requires all
depository institutions to maintain reserves against transaction accounts
(noninterest bearing and NOW checking accounts). The balances maintained to
meet the reserve requirements imposed by the Federal Reserve may be used to
satisfy liquidity requirements. An institution may borrow from the Federal
Reserve Bank “discount window” as a secondary source of funds, provided that
the institution meets the Federal Reserve Bank’s credit standards.
Dividends
CCB is subject to legal limitations on the
frequency and amount of dividends that can be paid to CCBG. The Federal Reserve
may restrict the ability of CCB to pay dividends if such payments would
constitute an unsafe or unsound banking practice. Additionally, as of January
1, 2018, financial institutions are being required to maintain a capital
conservation buffer of at least 1.875% of risk-weighted assets in order to
avoid restrictions on capital distributions and other payments. If a financial
institution’s capital conservation buffer falls below the minimum requirement,
its maximum payout amount for capital distributions and discretionary payments
declines to a set percentage of eligible retained income based on the size of the
buffer. See “Capital Regulations,” below for additional details on this new
capital requirement.
In addition, Florida law and Federal regulation also places
restrictions on the declaration of dividends from state chartered banks to
their holding companies. Pursuant to the Florida Financial Institutions Code,
the board of directors of state-chartered banks, after charging off bad debts,
depreciation and other worthless assets, if any, and making provisions for
reasonably anticipated future losses on loans and other assets, may quarterly,
semi-annually or annually declare a dividend of up to the aggregate net profits
of that period combined with the bank’s retained net profits for the preceding
two years and, with the approval of the Florida Office of Financial Regulation
and Federal Reserve, declare a dividend from retained net profits which accrued
prior to the preceding two years. Before declaring such dividends, 20% of the
net profits for the preceding period as is covered by the dividend must be
transferred to the surplus fund of the bank until this fund becomes equal to
the amount of the bank’s common stock then issued and outstanding. A
state-chartered bank may not declare any dividend if (i) its net income (loss)
from the current year combined with the retained net income (loss) for the
preceding two years aggregates a loss or (ii) the payment of such dividend
would cause the capital account of the bank to fall below the minimum amount
required by law, regulation, order or any written agreement with the Florida
Office of Financial Regulation or a federal regulatory agency.
Insurance of Accounts and Other Assessments
Our deposit accounts are currently insured by the Deposit
Insurance Fund generally up to a maximum of $250,000 per separately insured
depositor. We pay deposit insurance assessments to the Deposit Insurance Fund,
which are determined through a risk-based assessment system.
Under the current system, deposit insurance assessments are based
on a bank’s assessment base, which is defined as average total assets minus
average tangible equity. The FDIC assigns an institution to one of two
categories based on asset size. We fall into the Established Small
Institution category. This category has three sub categories based on
supervisory ratings (its “CAMELS ratings”) designed to measure risk. In
determining the applicable assessment rate, the initial base assessment is determined
based on the risk-based sub category into which the bank falls. The applicable
sub category is determined based on the institution’s most recent supervisory
and capital evaluations. The total base assessment rate is then determined by
adjusting the initial base assessment rate by an unsecured debt adjustment and
brokered deposit adjustment, if applicable, and the deposit insurance
assessment is calculated by multiplying the bank’s assessment base by the total
base assessment rate.
In addition, all FDIC-insured institutions are required to pay
assessments to the FDIC at a current annual rate of approximately five tenths
of a basis point of its assessment base to fund interest payments on bonds
issued by the Financing Corporation, an agency of the federal government
established to recapitalize the predecessor to the Savings Association
Insurance Fund. The Financing Corporation assessment rate is adjusted quarterly
to reflect changes in the assessment base as determined from the quarterly Call
Report submissions. These assessments will continue until the Financing
Corporation bonds mature in 2017 through 2019.
Under the Federal Deposit Insurance Act, or FDIA, the FDIC may
terminate deposit insurance upon a finding that the institution has engaged in
unsafe and unsound practices, is in an unsafe or unsound condition to continue
operations, or has violated any applicable law, regulation, rule, order or
condition imposed by the FDIC.
Transactions
With Affiliates
Pursuant to Sections 23A and 23B of the
Federal Reserve Act and Regulation W, the authority of CCB to engage in
transactions with related parties or “affiliates” or to make loans to insiders
is limited. Loan transactions with an affiliate generally must be
collateralized and certain transactions between CCB and its affiliates,
including the sale of assets, the payment of money or the provision of
services, must be on terms and conditions that are substantially the same, or
at least as favorable to CCB, as those prevailing for comparable nonaffiliated
transactions. In addition, CCB generally may not purchase securities issued or
underwritten by affiliates.
Loans to executive officers, directors or to any person who
directly or indirectly, or acting through or in concert with one or more
persons, owns, controls or has the power to vote more than 10% of any class of
voting securities of a bank, which we refer to as “10% Shareowners,” or to any
political or campaign committee the funds or services of which will benefit
those executive officers, directors, or 10% Shareowners or which is controlled
by those executive officers, directors or 10% Shareowners, are subject to
Sections 22(g) and 22(h) of the Federal Reserve Act and their corresponding
regulations (Regulation O) and Section 13(k) of the Exchange Act relating to
the prohibition on personal loans to executives (which exempts financial
institutions in compliance with the insider lending restrictions of Section
22(h) of the Federal Reserve Act). Among other things, these loans must be made
on terms substantially the same as those prevailing on transactions made to
unaffiliated individuals and certain extensions of credit to those persons must
first be approved in advance by a disinterested majority of the entire board of
directors. Section 22(h) of the Federal Reserve Act prohibits loans to any of
those individuals where the aggregate amount exceeds an amount equal to 15% of
an institution’s unimpaired capital and surplus plus an additional 10% of unimpaired
capital and surplus in the case of loans that are fully secured by readily
marketable collateral, or when the aggregate amount on all of the extensions of
credit outstanding to all of these persons would exceed our unimpaired capital
and unimpaired surplus. Section 22(g) identifies limited circumstances in which
we are permitted to extend credit to executive officers.
Community Reinvestment Act
The Community Reinvestment Act and its corresponding regulations
are intended to encourage banks to help meet the credit needs of the
communities they serve, including low and moderate income neighborhoods,
consistent with safe and sound banking practices. These regulations provide for
regulatory assessment of a bank’s record in meeting the credit needs of its
market area. Federal banking agencies are required to publicly disclose each
bank’s rating under the Community Reinvestment Act. The Federal Reserve considers
a bank’s Community Reinvestment Act rating when the bank submits an application
to establish bank branches, merge with another bank, or acquire the assets and
assume the liabilities of another bank. In the case of a financial holding
company, the Community Reinvestment Act performance record of all banks
involved in a merger or acquisition are reviewed in connection with the
application to acquire ownership or control of shares or assets of a bank or to
merge with another bank or bank holding company. An unsatisfactory record can
substantially delay or block the transaction. We received a satisfactory rating
on its most recent Community Reinvestment Act assessment.
Capital Regulations
The federal banking regulators have adopted risk-based, capital
adequacy guidelines for financial holding companies and their subsidiary banks
based on the Basel III standards. Under these guidelines, assets and
off-balance sheet items are assigned to specific risk categories each with
designated risk weightings. The new risk-based capital guidelines are designed
to make regulatory capital requirements more sensitive to differences in risk
profiles among banks and bank holding companies, to account for off-balance
sheet exposure, to minimize disincentives for holding liquid assets, and to achieve
greater consistency in evaluating the capital adequacy of major banks
throughout the world. The resulting capital ratios represent capital as a
percentage of total risk-weighted assets and off-balance sheet items. Final
rules implementing the capital adequacy guidelines became effective January 1,
2015 for community banks. These final rules represent a significant change to
the prior general risk-based capital rules and are designed to substantially
conform to the Basel III international standards.
In computing total risk-weighted assets, bank and bank holding
company assets are given risk-weights of 0%, 20%, 50%, 100% and 150%. In
addition, certain off-balance sheet items are given similar credit conversion
factors to convert them to asset equivalent amounts to which an appropriate
risk-weight will apply. Most loans will be assigned to the 100% risk category,
except for performing first mortgage loans fully secured by 1- to 4-family and
certain multi-family residential property, which carry a 50% risk rating. Most
investment securities (including, primarily, general obligation claims on
states or other political subdivisions of the United States) will be assigned
to the 20% category, except for municipal or state revenue bonds, which have a
50% risk-weight, and direct obligations of the U.S. Treasury or obligations
backed by the full faith and credit of the U.S. Government, which have a 0%
risk-weight. In covering off-balance sheet items, direct credit substitutes,
including general guarantees and standby letters of credit backing financial
obligations, are given a 100% conversion factor. Transaction-related
contingencies such as bid bonds, standby letters of credit backing nonfinancial
obligations, and undrawn commitments (including commercial credit lines with an
initial maturity of more than one year) have a 50% conversion factor.
Short-term commercial letters of credit are converted at 20% and certain
short-term unconditionally cancelable commitments have a 0% factor.
Under the final rules, minimum
requirements increased for both the quality and quantity of capital held by
banking organizations. In this respect, the final rules implement strict
eligibility criteria for regulatory capital instruments and improves the
methodology for calculating risk-weighted assets to enhance risk sensitivity.
Consistent with the international Basel III framework, the rules include a new
minimum ratio of Common Equity Tier 1 Capital to Risk-Weighted Assets of 4.5%
and a Common Equity Tier 1 Capital conservation buffer of 2.5% of risk-weighted
assets. The rules also raise the minimum ratio of Tier 1 Capital to
Risk-Weighted Assets from 4% to 6% and include a minimum leverage ratio of 4%
for all banking organizations. The implementation of the
capital conservation buffer began on January 1, 2016 at the 0.625% level and
will be phased in over a three-year period (increasing by 0.625% on each
subsequent January 1, until it reaches 2.5% on January 1, 2019). If a financial institution’s capital
conservation buffer falls below the minimum, capital distributions and
discretionary payments will be limited or prohibited based on the size of the
institution’s buffer. The types of payments subject to this limitation include
dividends, share buybacks, discretionary payments on Tier 1 instruments, and
discretionary bonus payments.
The new capital regulations may also impact the treatment of
accumulated other comprehensive income (“AOCI”) for regulatory capital
purposes. Under the new rules, AOCI generally flows through to regulatory
capital, however, community banks and their holding companies may make a
one-time irrevocable opt-out election to continue to treat AOCI the same as
under the old regulations for regulatory capital purposes. This election was
required to be made on the first call report or bank holding company annual
report (on form FR Y-9C) filed after January 1, 2015. We made the opt-out
election. Additionally, the new rules also permit community banks with less
than $15 billion in total assets to continue to count certain non-qualifying
capital instruments issued prior to May 19, 2010 as Tier 1 capital, including
trust preferred securities and cumulative perpetual preferred stock (subject to
a limit of 25% of Tier 1 capital). However, non-qualifying capital instruments
issued on or after May 19, 2010 do not qualify for Tier 1 capital treatment.
Federal law and regulations establish a capital-based regulatory
scheme designed to promote early intervention for troubled banks and require
the FDIC to choose the least expensive resolution of bank failures. The capital-based
regulatory framework contains five categories of compliance with regulatory
capital requirements, including “well capitalized,” “adequately capitalized,”
“undercapitalized,” “significantly undercapitalized,” and “critically
undercapitalized.” To qualify as a “well-capitalized” institution under the new
rules in effect as of January 1, 2015, a bank must have a leverage ratio of not
less than 5%, a Tier 1 Common Equity ratio of not less than 6.5%, a Tier 1
Capital ratio of not less than 8%, and a total risk-based capital ratio of not
less than 10%, and the bank must not be under any order or directive from the
appropriate regulatory agency to meet and maintain a specific capital level.
Under the regulations, the applicable agency can treat an
institution as if it were in the next lower category if the agency determines
(after notice and an opportunity for hearing) that the institution is in an
unsafe or unsound condition or is engaging in an unsafe or unsound practice.
The degree of regulatory scrutiny of a financial institution will increase, and
the permissible activities of the institution will decrease, as it moves
downward through the capital categories. Institutions that fall into one of the
three undercapitalized categories may be required to (i) submit a capital
restoration plan; (ii) raise additional capital; (iii) restrict their growth,
deposit interest rates, and other activities; (iv) improve their management; (v)
eliminate management fees; or (vi) divest themselves of all or a part of their
operations. It should be noted that the minimum ratios referred to above are
merely guidelines and the bank regulators possess the discretionary authority
to require higher capital ratios.
As of December 31, 2017, we exceeded the requirements contained in
the applicable regulations, policies and directives pertaining to capital
adequacy to be classified as “well capitalized” and are unaware of any material
violation or alleged violation of these regulations, policies or directives
(see table below). Rapid growth, poor loan portfolio performance, or poor
earnings performance, or a combination of these factors, could change our
capital position in a relatively short period of time, making additional
capital infusions necessary.
|
|
Actual
|
|
Required For Capital Adequacy Purposes
|
|
To Be Well-Capitalized Under Prompt
Corrective Action Provisions
|
|
(Dollars in thousands)
|
Amount
|
|
Ratio
|
|
Amount
|
|
Ratio
|
|
Amount
|
|
Ratio
|
|
As of December 31, 2017:
|
|
|
|
|
|
|
|
|
|
|
|
|
|
|
Common Equity Tier 1 Capital:
|
|
|
|
|
|
|
|
|
|
|
|
|
|
|
CCBG
|
$
|
234,477
|
|
13.42%
|
|
$
|
78,648
|
|
4.50%
|
|
*
|
|
*
|
|
CCB
|
|
275,796
|
|
15.83%
|
|
|
78,418
|
|
4.50%
|
|
113,270
|
|
6.50%
|
|
|
|
|
|
|
|
|
|
|
|
|
|
|
|
|
Tier 1 Capital:
|
|
|
|
|
|
|
|
|
|
|
|
|
|
|
CCBG
|
$
|
285,477
|
|
16.33%
|
|
$
|
104,864
|
|
6.00%
|
|
*
|
|
*
|
|
CCB
|
|
275,796
|
|
15.83%
|
|
|
104,557
|
|
6.00%
|
|
139,410
|
|
8.00%
|
|
|
|
|
|
|
|
|
|
|
|
|
|
|
|
|
Total Capital:
|
|
|
|
|
|
|
|
|
|
|
|
|
|
|
CCBG
|
$
|
298,784
|
|
17.10%
|
|
$
|
139,819
|
|
8.00%
|
|
*
|
|
*
|
|
CCB
|
|
289,103
|
|
16.59%
|
|
|
139,410
|
|
8.00%
|
|
174,262
|
|
10.00%
|
|
|
|
|
|
|
|
|
|
|
|
|
|
|
|
|
Tier 1 Leverage:
|
|
|
|
|
|
|
|
|
|
|
|
|
|
|
CCBG
|
$
|
285,477
|
|
10.47%
|
|
$
|
109,082
|
|
4.00%
|
|
*
|
|
*
|
|
CCB
|
|
275,796
|
|
10.14%
|
|
|
108,764
|
|
4.00%
|
|
135,956
|
|
5.00%
|
|
|
|
|
|
|
|
|
|
|
|
|
|
|
|
|
* Not applicable to bank holding companies.
|
|
|
|
|
|
|
|
|
|
|
Prompt Corrective Action
Immediately upon becoming
undercapitalized, a depository institution becomes subject to the provisions of
Section 38 of the Federal Deposit Insurance Act, which: (i) restrict
payment of capital distributions and management fees; (ii) require that
the appropriate federal banking agency monitor the condition of the institution
and its efforts to restore its capital; (iii) require submission of a
capital restoration plan; (iv) restrict the growth of the institution’s
assets; and (v) require prior approval of certain expansion proposals. The
appropriate federal banking agency for an undercapitalized institution also may
take any number of discretionary supervisory actions if the agency determines
that any of these actions is necessary to resolve the problems of the
institution at the least possible long-term cost to the deposit insurance fund,
subject in certain cases to specified procedures. These discretionary
supervisory actions include: (i) requiring the institution to raise
additional capital; (ii) restricting transactions with affiliates;
(iii) requiring divestiture of the institution or the sale of the
institution to a willing purchaser; and (iv) any other supervisory action
that the agency deems appropriate. These and additional mandatory and permissive
supervisory actions may be taken with respect to significantly undercapitalized
and critically undercapitalized institutions.
Interstate Banking and
Branching
The Bank Holding Company Act,
amended by the Interstate Banking Act, provides that adequately capitalized and
managed financial and bank holding companies are permitted to acquire banks in
any state. State laws prohibiting interstate banking or discriminating against
out-of-state banks are preempted. States are not permitted to enact laws opting
out of this provision; however, states are allowed to adopt a minimum age
restriction requiring that target banks located within the state be in
existence for a period of time, up to a maximum of five years, before a bank
may be subject to the Interstate Banking Act. Also, the Dodd-Frank Act, added
deposit caps, which prohibit acquisitions that result in the acquiring company
controlling 30% or more of the deposits of insured banks and thrift
institutions held in the state in which the target maintains a branch or 10% or
more of the deposits nationwide. States have the authority to waive the 30%
deposit cap. State-level deposit caps are not preempted as long as they do not
discriminate against out-of-state institutions, and the federal deposit caps
apply only to initial entry acquisitions.
As a result of the Dodd-Frank
Act, national banks and state banks are able to establish branches in any state
if that state would permit the establishment of the branch by a state bank
chartered in that state. Florida law permits a state bank to establish a branch
of the bank anywhere in the state. Accordingly, a bank with its headquarters
outside the State of Florida may establish branches anywhere within the state.
Anti-money Laundering
The
Uniting and Strengthening America by Providing Appropriate Tools Required to
Intercept and Obstruct Terrorism Act of 2001 (“USA PATRIOT Act”), provides the
federal government with additional powers to address terrorist threats through
enhanced domestic security measures, expanded surveillance powers, increased
information sharing and broadened anti-money laundering requirements. By way of
amendments to the Bank Secrecy Act (“BSA”), the USA PATRIOT Act puts in place
measures intended to encourage information sharing among bank regulatory and
law enforcement agencies. In addition, certain provisions of the USA PATRIOT
Act impose affirmative obligations on a broad range of financial institutions.
The USA PATRIOT Act and the
related Federal Reserve regulations require banks to establish anti-money
laundering programs that include, at a minimum:
·
internal policies, procedures and
controls designed to implement and maintain the savings association’s
compliance with all of the requirements of the USA PATRIOT Act, the BSA and
related laws and regulations;
·
systems and procedures for
monitoring and reporting of suspicious transactions and activities;
·
a designated compliance officer;
·
employee training;
·
an independent audit function to
test the anti-money laundering program;
·
procedures to verify the identity
of each client upon the opening of accounts; and
·
heightened due diligence policies,
procedures and controls applicable to certain foreign accounts and
relationships.
Additionally, the USA PATRIOT
Act requires each financial institution to develop a customer identification
program (“CIP”) as part of its anti-money laundering program. The key
components of the CIP are identification, verification, government list
comparison, notice and record retention. The purpose of the CIP is to enable
the financial institution to determine the true identity and anticipated
account activity of each customer. To make this determination, among other
things, the financial institution must collect certain information from
customers at the time they enter into the customer relationship with the
financial institution. This information must be verified within a reasonable
time through documentary and non-documentary methods. Furthermore, all
customers must be screened against any CIP-related government lists of known or
suspected terrorists. We and our affiliates have adopted policies, procedures
and controls designed to comply with the BSA and the USA PATRIOT Act.
Regulatory Enforcement
Authority
Federal and state banking laws
grant substantial regulatory authority and enforcement powers to federal and
state banking regulators. This authority permits bank regulatory agencies to
assess civil money penalties, to issue cease and desist or removal orders, and
to initiate injunctive actions against banking organizations and institution-affiliated
parties. In general, these enforcement actions may be initiated for either
violations of laws or regulations or for unsafe or unsound practices. Other
actions or inactions may provide the basis for enforcement action, including
misleading or untimely reports filed with regulatory authorities.
Federal Home Loan Bank
System
CCB is a member of the Federal
Home Loan Bank of Atlanta, which is one of 12 regional Federal Home Loan Banks.
Each FHLB serves as a quasi-reserve bank for its members within its assigned
region. It is funded primarily from funds deposited by member institutions and
proceeds from the sale of consolidated obligations of the FHLB system. Each
FHLB makes loans to members (i.e., advances) in accordance with policies and
procedures established by the board of trustees of the FHLB.
As a member of the FHLB of
Atlanta, CCB is required to own capital stock in the FHLB in an amount at least
equal to 0.09% (or 9 basis points), which is subject to annual adjustments, of
CCB’s total assets at the end of each calendar year (up to a maximum of $15
million), plus 4.25% of its outstanding advances (borrowings) from the FHLB of
Atlanta under the activity-based stock ownership requirement. As of
December 31, 2017, CCB was in compliance with this requirement.
Privacy
Under the Gramm-Leach-Bliley
Act, federal banking regulators adopted rules limiting the ability of banks and
other financial institutions to disclose nonpublic information about consumers
to nonaffiliated third parties. The rules require disclosure of privacy
policies to consumers and, in some circumstances, allow consumers to prevent
disclosure of certain personal information to nonaffiliated third parties.
Overdraft Fee Regulation
The
Electronic Fund Transfer Act prohibits financial institutions from
charging consumers fees for paying overdrafts on automated teller machines
(“ATM”) and one-time debit card transactions, unless a consumer consents, or
opts in, to the overdraft service for those type of transactions. If a consumer
does not opt in, any ATM transaction or debit that overdraws the consumer’s
account will be denied. Overdrafts on the payment of checks and regular
electronic bill payments are not covered by this new rule. Before opting in,
the consumer must be provided a notice that explains the financial
institution’s overdraft services, including the fees associated with the
service, and the consumer’s choices. Financial institutions must provide
consumers who do not opt in with the same account terms, conditions and
features (including pricing) that they provide to consumers who do opt in.
Consumer Laws and
Regulations
CCB is also subject to other
federal and state consumer laws and regulations that are designed to protect
consumers in transactions with banks. While the list set forth below is not
exhaustive, these laws and regulations include the Truth in Lending Act, the
Truth in Savings Act, the Electronic Funds Transfer Act, the Expedited Funds
Availability Act, the Check Clearing for the 21st Century Act, the Fair Credit
Reporting Act, the Fair Debt Collection Practices Act, the Equal Credit
Opportunity Act, the Fair Housing Act, the Home Mortgage Disclosure Act, the
Fair and Accurate Credit Transactions Act, the Mortgage Disclosure Improvement
Act, and the Real Estate Settlement Procedures Act, among others. These laws
and regulations mandate certain disclosure requirements and regulate the manner
in which financial institutions must deal with customers when taking deposits
or making loans to such customers. CCB must comply with the applicable
provisions of these consumer protection laws and regulations as part of its
ongoing customer relations.
In addition, the Consumer
Financial Protection Bureau issues regulations and standards under these
federal consumer protection laws that affect our consumer businesses. These
include regulations setting “ability to repay” standards for residential
mortgage loans and mortgage loan servicing and originator compensation
standards, which generally require creditors to make a reasonable, good faith
determination of a consumer’s ability to repay any consumer credit transaction
secured by a dwelling (excluding an open-end credit plan, timeshare plan,
reverse mortgage, or temporary loan) and establishes certain protections from
liability under this requirement for loans that meet the requirements of the
“qualified mortgage” safe harbor. In addition, on October 3, 2015, the new
TILA-RESPA Integrated Disclosure (TRID) rules for mortgage closings took effect
for new loan applications. The new TRID rules were further amended in 2017.
These new loan forms may have the effect of lengthening the time it takes to
approve mortgage loans in the short-term following implementation of the rule.
The Volcker Rule
Section 619 of the Dodd-Frank
Act, commonly known as the Volcker Rule, prohibits us from owning, sponsoring,
or having certain relationships with any hedge funds or private equity funds,
subject to certain exemptions. The Volcker Rule directed the federal banking,
securities and commodities and futures regulatory agencies to undertake a
coordinated rulemaking effort to create rules implementing the Volcker Rule.
The final interagency rules implementing the Volcker Rule, which were issued in
December 2013 and became effective on April 1, 2014, afford financial
institutions a two-year conformance period during which they can wind-down,
sell, or otherwise conform their respective activities, investments and
relationships to the requirements of the Volcker Rule and its implementing regulations. We
do not believe that the Volcker Rule or the final interagency rules
implementing the Volcker Rule will have a material impact on our investment
activities since we do not engage in transactions covered by the regulation.
Future Legislative
Developments
Various legislative acts are from time to time introduced in Congress
and the Florida legislature. This legislation may change banking statutes and
the environment in which our banking subsidiary and we operate in substantial
and unpredictable ways. We cannot determine the ultimate effect that potential
legislation, if enacted, or implementing regulations with respect thereto,
would have upon our financial condition or results of operations or that of our
banking subsidiary.
Effect
of Governmental Monetary Policies
The commercial banking business
is affected not only by general economic conditions, but also by the monetary
policies of the Federal Reserve. Changes in the discount rate on member bank
borrowing, availability of borrowing at the “discount window,” open market
operations, changes in the Fed Funds target interest rate, the imposition of
changes in reserve requirements against member banks’ deposits and assets of
foreign banking centers and the imposition of and changes in reserve
requirements against certain borrowings by banks and their affiliates are some
of the instruments of monetary policy available to the Federal Reserve. These
monetary policies are used in varying combinations to influence overall growth and
distributions of bank loans, investments and deposits, which may affect
interest rates charged on loans or paid on deposits. The monetary policies of
the Federal Reserve have had a significant effect on the operating results of
commercial banks and are expected to continue to do so in the future. The
Federal Reserve’s policies are primarily influenced by its dual mandate of
price stability and full employment, and to a lesser degree by short-term and
long-term changes in the international trade balance and in the fiscal policies
of the U.S. Government. Future changes in monetary policy and the effect of
such changes on our business and earnings in the future cannot be predicted.
Income
Taxes
We
are subject to income taxes at the federal level and subject to state taxation
based on the laws of each state in which we operate. We file a consolidated
federal tax return with a fiscal year ending on December 31. On December 22,
2017, the United States enacted tax reform legislation known as the H.R.1, commonly
referred to as the “Tax Cuts and Jobs Act,” resulting in significant
modifications to existing law. We completed the accounting for the effects of
the new law during this period. Our financial statements for the year ended
December 31, 2017, reflect certain effects of the new law, which includes a
reduction in the corporate tax rate from 35% to 21%, as well as other changes.
As a result of the changes to tax laws and tax rates under the Act, we incurred
an increase in income tax expense during the year ended December 31, 2017, due
to a write-down of our net deferred tax asset by $4.1 million in the fourth
quarter of 2017 as a result of the reduction to the federal corporate income
tax rate. While the new tax law negatively impacted earnings in the fourth quarter
of 2017, the lower corporate tax rate is expected to be a significant ongoing
benefit to us in future periods. Absent future discrete events, we
anticipate that our effective tax in future periods will be approximately 24%
due to a lower federal corporate income tax rate.
Website
Access to Company’s Reports
Our Internet website is
www.ccbg.com. Our annual reports on Form 10-K, quarterly reports on Form 10-Q,
current reports on Form 8-K, including any amendments to those reports filed or
furnished pursuant to section 13(a) or 15(d), and reports filed pursuant to
Section 16, 13(d), and 13(g) of the Exchange Act are available free of charge
through our website as soon as reasonably practicable after they are
electronically filed with, or furnished to, the Securities and Exchange
Commission. The information on our website is not incorporated by reference
into this report.
Item 1A. Risk Factors
An investment in
our common stock contains a high degree of risk. You should consider carefully
the following risk factors before deciding whether to invest in our common
stock. Our business, including our operating results and financial condition,
could be harmed by any of these risks. Additional risks and uncertainties not
currently known to us or that we currently deem to be immaterial also may
materially and adversely affect our business. The trading price of our common
stock could decline due to any of these risks, and you may lose all or part of
your investment. In assessing these risks, you should also refer to the other
information contained in our filings with the SEC, including our financial
statements and related notes.
Risks Related to Our Business
We may incur
losses if we are unable to successfully manage interest rate risk.
Our profitability
depends to a large extent on Capital City Bank’s net interest income, which is
the difference between income on interest-earning assets, such as loans and
investment securities, and expense on interest-bearing liabilities such as
deposits and borrowings. We are unable to predict changes in market interest
rates, which are affected by many factors beyond our control, including
inflation, recession, unemployment, federal funds target rate, money supply,
domestic and international events and changes in the United States and other
financial markets. Our net interest income may be reduced if: (i) more
interest-earning assets than interest-bearing liabilities reprice or mature
during a time when interest rates are declining or (ii) more interest-bearing
liabilities than interest-earning assets reprice or mature during a time when
interest rates are rising.
Changes in the
difference between short-term and long-term interest rates may also harm our
business. We generally use short-term deposits to fund longer-term assets. When
interest rates change, assets and liabilities with shorter terms reprice more
quickly than those with longer terms, which could have a material adverse
effect on our net interest margin. If market interest rates rise rapidly,
interest rate adjustment caps may also limit increases in the interest rates on
adjustable rate loans, which could further reduce our net interest income.
Additionally, we believe that due to the recent historical low interest rate
environment, the effects of the repeal of Regulation Q, which previously had
prohibited the payment of interest on demand deposits by member banks of the
Federal Reserve System, has not been realized. The increased price competition
for deposits that may result upon the return to a historically normal interest
rate environment could adversely affect net interest margins of community
banks.
Although we
continuously monitor interest rates and have a number of tools to manage our
interest rate risk exposure, changes in market assumptions regarding future
interest rates could significantly impact our interest rate risk strategy, our
financial position and results of operations. If we do not properly monitor our
interest rate risk management strategies, these activities may not effectively
mitigate our interest rate sensitivity or have the desired impact on our
results of operations or financial condition.
Our loan
portfolio includes loans with a higher risk of loss which could lead to higher
loan losses and nonperforming assets.
We originate
commercial real estate loans, commercial loans, construction loans, vacant land
loans, consumer loans, and residential mortgage loans primarily within our market
area. Commercial real estate, commercial, construction, vacant land, and
consumer loans may expose a lender to greater credit risk than traditional
fixed-rate fully amortizing loans secured by single-family residential real
estate because the collateral securing these loans may not be sold as easily as
single-family residential real estate. In addition, these loan types tend to
involve larger loan balances to a single borrower or groups of related
borrowers and are more susceptible to a risk of loss during a downturn in the
business cycle. These loans also have historically had greater credit risk than
other loans for the following reasons:
·
Commercial Real Estate Loans. Repayment is dependent on income being generated in
amounts sufficient to cover operating expenses and debt service. These loans
also involve greater risk because they are generally not fully amortizing over
the loan period, but rather have a balloon payment due at maturity. A
borrower’s ability to make a balloon payment typically will depend on the
borrower’s ability to either refinance the loan or timely sell the underlying
property. As of December 31, 2017, commercial mortgage loans comprised approximately
32.3% of our total loan portfolio.
·
Commercial Loans. Repayment is generally dependent upon the successful
operation of the borrower’s business. In addition, the collateral securing the
loans may depreciate over time, be difficult to appraise, be illiquid, or
fluctuate in value based on the success of the business. As of December 31,
2017, commercial loans comprised approximately 13.2% of our total loan
portfolio.
·
Construction Loans. The risk of loss is largely dependent on our initial
estimate of whether the property’s value at completion equals or exceeds the
cost of property construction and the availability of take-out financing.
During the construction phase, a number of factors can result in delays or cost
overruns. If our estimate is inaccurate or if actual construction costs exceed
estimates, the value of the property securing our loan may be insufficient to
ensure full repayment when completed through a permanent loan, sale of the
property, or by seizure of collateral. As of December 31, 2017, construction
loans comprised approximately 4.7% of our total loan portfolio.
·
Vacant Land Loans. Because vacant or unimproved land is generally held
by the borrower for investment purposes or future use, payments on loans
secured by vacant or unimproved land will typically rank lower in priority to
the borrower than a loan the borrower may have on their primary residence or
business. These loans are susceptible to adverse conditions in the real estate
market and local economy. As of December 31, 2017, vacant land loans comprised approximately
3.2% of our total loan portfolio.
·
HELOCs. Our open-ended home equity loans have an
interest-only draw period followed by a five-year repayment period of 0.75% of
the principal balance monthly and a balloon payment at maturity. Upon the
commencement of the repayment period, the monthly payment can increase
significantly, thus, there is a heightened risk that the borrower will be
unable to pay the increased payment. Further, these loans also involve greater
risk because they are generally not fully amortizing over the loan period, but
rather have a balloon payment due at maturity. A borrower’s ability to make a
balloon payment may depend on the borrower’s ability to either refinance the
loan or timely sell the underlying property. As of December 31, 2017, HELOCs
comprised approximately 13.8% of our total loan portfolio.
·
Consumer Loans. Consumer loans (such as automobile loans and
personal lines of credit) are collateralized, if at all, with assets that may
not provide an adequate source of payment of the loan due to depreciation,
damage, or loss. As of December 31, 2017, consumer loans comprised
approximately 16.9% of our total loan portfolio, with indirect auto loans
making up a majority of this portfolio at approximately 87% of the total
balance.
The increased risks
associated with these types of loans result in a correspondingly higher
probability of default on such loans (as compared to fixed-rate fully
amortizing single-family real estate loans). Loan defaults would likely
increase our loan losses and nonperforming assets and could adversely affect
our allowance for loan losses and our results of operations.
We process,
maintain, and transmit confidential client information through our information
technology systems, such as our online banking service. Cybersecurity issues,
such as security breaches and computer viruses, affecting our information
technology systems or fraud related to our debit card products could disrupt
our business, result in the unintended disclosure or misuse of confidential or
proprietary information, damage our reputation, increase our costs, and cause
losses.
We collect and
store sensitive data, including our proprietary business information and that
of our clients, and personally identifiable information of our clients and
employees, in our information technology systems. We also provide our clients
the ability to bank online. The secure processing, maintenance, and
transmission of this information is critical to our operations. Our network,
or those of our clients, could be vulnerable to unauthorized access, computer
viruses, phishing schemes and other security problems. Financial institutions
and companies engaged in data processing have increasingly reported breaches in
the security of their websites or other systems, some of which have involved
sophisticated and targeted attacks intended to obtain unauthorized access to
confidential information, destroy data, disrupt or degrade service, sabotage
systems or cause other damage.
We may be required
to spend significant capital and other resources to protect against the threat
of security breaches and computer viruses or to alleviate problems caused by
security breaches or viruses. Security breaches and viruses could expose us to
claims, litigation and other possible liabilities. Any inability to prevent
security breaches or computer viruses could also cause existing clients to lose
confidence in our systems and could adversely affect our reputation and our
ability to generate deposits.
Additionally, fraud
losses related to debit and credit cards have risen in recent years due in
large part to growing and evolving schemes to illegally use cards or steal
consumer credit card information despite risk management practices employed by
the debit and credit card industries. Many issuers of debit and credit cards
have suffered significant losses in recent years due to the theft of cardholder
data that has been illegally exploited for personal gain.
The potential for
debit and credit card fraud against us or our clients and our third party
service providers is a serious issue. Debit and credit card fraud is pervasive
and the risks of cybercrime are complex and continue to evolve. In view of the
recent high-profile retail data breaches involving client personal and
financial information, the potential impact on us and any exposure to consumer
losses and the cost of technology investments to improve security could cause
losses to us or our clients, damage to our brand, and an increase in our costs.
An inadequate allowance for loan losses would reduce our earnings.
We are exposed to
the risk that our clients may be unable to repay their loans according to their
terms and that any collateral securing the payment of their loans may not be
sufficient to assure full repayment. This could result in credit losses that
are inherent in the lending business. We evaluate the collectability of our
loan portfolio and provide an allowance for loan losses that we believe is
adequate based upon such factors as:
·
the risk characteristics of
various classifications of loans;
·
previous loan loss experience;
·
specific loans that have loss
potential;
·
delinquency trends;
·
estimated fair market value of the
collateral;
·
current economic conditions; and
·
geographic and industry loan
concentrations.
As of December 31,
2017, our allowance for loan losses was $13.3
million, which represented approximately 0.80% of our total loans. We had $7.2 million in nonaccruing loans as of December 31, 2017. The
allowance is based on management’s reasonable estimate and may not prove
sufficient to cover future loan losses. Although management uses the best
information available to make determinations with respect to the allowance for
loan losses, future adjustments may be necessary if economic conditions differ
substantially from the assumptions used or adverse developments arise with
respect to our nonperforming or performing loans. In addition, regulatory
agencies, as an integral part of their examination process, periodically review
our estimated losses on loans. Our regulators may require us to recognize
additional losses based on their judgments about information available to them
at the time of their examination. Accordingly, the allowance for loan losses
may not be adequate to cover all future loan losses and significant increases
to the allowance may be required in the future if, for example, economic
conditions worsen. A material increase in our allowance for loan losses would
adversely impact our net income and capital in future periods, while having the
effect of overstating our current period earnings.
We may incur
significant costs associated with the ownership of real property as a result of
foreclosures, which could reduce our net income.
Since we originate
loans secured by real estate, we may have to foreclose on the collateral property
to protect our investment and may thereafter own and operate such property, in
which case we would be exposed to the risks inherent in the ownership of real
estate.
The amount that we,
as a mortgagee, may realize after a foreclosure is dependent upon factors
outside of our control, including, but not limited to:
·
general or local economic
conditions;
·
environmental cleanup liability;
·
neighborhood values;
·
interest rates;
·
real estate tax rates;
·
operating expenses of the
mortgaged properties;
·
supply of and demand for rental
units or properties;
·
ability to obtain and maintain
adequate occupancy of the properties;
·
zoning laws;
·
governmental rules, regulations
and fiscal policies; and
·
acts of God.
Certain
expenditures associated with the ownership of real estate, including real
estate taxes, insurance and maintenance costs, may adversely affect the income
from the real estate. Furthermore, we may need to advance funds to continue to
operate or to protect these assets. As a result, the cost of operating real
property assets may exceed the rental income earned from such properties or we
may be required to dispose of the real property at a loss.
Liquidity risk could impair our ability to
fund operations and jeopardize our financial condition.
Effective liquidity management is essential for the operation of
our business. We require sufficient liquidity to meet client loan requests,
client deposit maturities and withdrawals, payments on our debt obligations as
they come due and other cash commitments under both normal operating conditions
and other unpredictable circumstances causing industry or general financial
market stress. If we are unable to raise funds through deposits, borrowings,
earnings and other sources, it could have a substantial negative effect on our
liquidity. In particular, a majority of our liabilities during 2017 were
checking accounts and other liquid deposits, which are generally payable on
demand or upon short notice. By comparison, a substantial majority of our
assets were loans, which cannot generally be called or sold in the same time
frame. Although we have historically been able to replace maturing deposits and
advances as necessary, we might not be able to replace such funds in the
future, especially if a large number of our depositors seek to withdraw their
accounts at the same time, regardless of the reason. Our access to funding
sources in amounts adequate to finance our activities on terms that are
acceptable to us could be impaired by factors that affect us specifically or
the financial services industry or economy in general. Factors that could
negatively impact our access to liquidity sources include a decrease in the
level of our business activity as a result of a downturn in the markets in
which our loans are concentrated, adverse regulatory action against us, or our
inability to attract and retain deposits. Our ability to borrow could also be
impaired by factors that are not specific to us, such a disruption in the
financial markets or negative views and expectations about the prospects for
the financial services industry. If we are unable to maintain adequate
liquidity, it could materially and adversely affect our business, results of
operations or financial condition.
Our future
success is dependent on our ability to compete effectively in the highly
competitive banking industry.
We face vigorous
competition for deposits, loans and other financial services in our market area
from other banks and financial institutions, including savings and loan
associations, savings banks, finance companies and credit unions. A number of
our competitors are significantly larger than we are and have greater access to
capital and other resources. Many of our competitors also have higher lending
limits, more expansive branch networks, and offer a wider array of financial
products and services. To a lesser extent, we also compete with other providers
of financial services, such as money market mutual funds, brokerage firms,
consumer finance companies, insurance companies and governmental organizations,
which may offer financial products and services on more favorable terms than we
are able to. Many of our non-bank competitors are not subject to the same
extensive regulations that govern our activities. As a result, these non-bank
competitors have advantages over us in providing certain services. The effect
of this competition may reduce or limit our margins or our market share and may
adversely affect our results of operations and financial condition.
Risks Related to Regulation and
Legislation
We are subject
to extensive regulation, which could restrict our activities and impose
financial requirements or limitations on the conduct of our business.
We are subject to
extensive regulation, supervision and examination by our regulators, including
the Florida Office of Financial Regulation, the Federal Reserve, and the FDIC.
Our compliance with these industry regulations is costly and restricts certain
of our activities, including payment of dividends, mergers and acquisitions,
investments, lending and interest rates charged on loans, interest rates paid
on deposits, access to capital and brokered deposits and locations of banking
offices. If we are unable to meet these regulatory requirements, our financial
condition, liquidity and results of operations would be materially and
adversely affected.
Our activities
are also regulated under consumer protection laws applicable to our lending,
deposit and other activities. Many of these regulations are intended primarily
for the protection of our depositors and the Deposit Insurance Fund and not for
the benefit of our shareowners. In addition to the regulations of the bank
regulatory agencies, as a member of the Federal Home Loan Bank, we must also
comply with applicable regulations of the Federal Housing Finance Agency and
the Federal Home Loan Bank.
Our failure to
comply with these laws and regulations, even if the failure follows good faith
effort or results from a difference in interpretation, could subject us to
restrictions on our business activities, fines and other penalties, any of
which could adversely affect our results of operations, capital base and the
price of our securities. Further, any new laws, rules and regulations could
make compliance more difficult or expensive or otherwise adversely affect our
business and financial condition. Please refer to the Section entitled
“Business – Regulatory Considerations” in this Report.
Legislative
and administrative action may affect our business.
President Donald Trump and others in Congress called for substantial change to
several regulations and policies, which may include the repeal of regulations
implemented as a result of Dodd-Frank and comprehensive tax reform. We cannot
predict the impact, if any, of these changes to our business. However, it is
possible that these changes could adversely affect our business. It is likely
that some policies adopted by the new administration will benefit us and others
will negatively affect us. Until we know what changes are enacted, if any, we
will not know whether in total we benefit from, or are negatively affected by,
the changes.
The increased capital requirements may have an adverse effect on
us.
In 2013, the
Federal Reserve Board released its final rules which implement in the United
States the Basel III regulatory capital reforms from the Basel Committee on
Banking Supervision and certain changes required by the Dodd-Frank Act. Under
the final rule, minimum requirements increased for both the quality and
quantity of capital held by banking organizations. Consistent with the
international Basel framework, the rule includes a new minimum ratio of Common
Equity Tier 1 Capital (“CET1”) to Risk-Weighted Assets (“RWA”) of 4.5% and a
CET1 conservation buffer of 2.5% of RWA (which will be phased in from 2016
through 2019) that apply to all supervised financial institutions. As of
January 1, 2018, the CET1conservation buffer requirement was 1.875%, which
requires us to hold additional CET1 capital in excess of the minimum required
to meet the CET1 to RWA ratio requirement. The rule also, among other things,
raised the minimum ratio of Tier 1 Capital to RWA from 4% to 6% and included a
minimum leverage ratio of 4% for all banking organizations. The impact of the
new capital rules requires us to maintain higher levels of capital, which we
expect will lower our return on equity. Additionally, if our CET1 to RWA ratio
does not exceed the minimum required plus the additional CET1 conservation
buffer, we may be restricted in our ability to pay dividends or make other
distributions of capital to our shareowners.
Compliance
with the Consumer Financial Protection Bureau’s ability-to-repay rule
safe-harbor could adversely impact our growth or profitability.
The Consumer
Financial Protection Bureau issued a rule, effective as of January 10, 2014,
designed to clarify for lenders how they can avoid monetary damages under the
Dodd-Frank Act, which holds lenders accountable for ensuring a borrower’s
ability to repay a mortgage at the time the loan is originated. Loans that satisfy
the “qualified mortgage” safe-harbor will be presumed to have complied with the
new ability-to-repay standard. Under the Consumer Financial Protection Bureau’s
rule, a “qualified mortgage” loan must not contain certain specified features,
including but not limited to:
·
excessive upfront points and fees
(those exceeding 3% of the total loan amount, less “bona fide discount points”
for prime loans);
·
interest-only payments;
·
negative-amortization; and
·
terms longer than 30 years.
Also, to qualify
as a “qualified mortgage,” a borrower’s total monthly debt-to-income ratio may
not exceed 43%. Lenders must also verify and document the income and financial
resources relied upon to qualify the borrower for the loan and underwrite the
loan based on a fully amortizing payment schedule and maximum interest rate
during the first five years, taking into account all applicable taxes,
insurance and assessments. The Consumer Financial Protection Bureau’s rule on
qualified mortgages could limit our ability or desire to make certain types of
loans or loans to certain borrowers, or could make it more expensive and/or
time consuming to make these loans, which could adversely impact our growth or
profitability.
Florida
financial institutions, such as the Bank, face a higher risk of noncompliance
and enforcement actions with the Bank Secrecy Act and other anti-money
laundering statutes and regulations.
Since September
11, 2001, banking regulators have intensified their focus on anti-money
laundering and Bank Secrecy Act compliance requirements, particularly the
anti-money laundering provisions of the USA PATRIOT Act. There is also
increased scrutiny of compliance with the rules enforced by the Office of
Foreign Assets Control (“OFAC”). Since 2004, federal banking regulators and
examiners have been extremely aggressive in their supervision and examination
of financial institutions located in the State of Florida with respect to the
institution’s Bank Secrecy Act/anti-money laundering compliance. Consequently,
numerous formal enforcement actions have been instituted against financial
institutions.
In order to
comply with regulations, guidelines and examination procedures in this area,
the Bank has been required to adopt new policies and procedures and to install
new systems. If the Bank’s policies, procedures and systems are deemed
deficient or the policies, procedures and systems of the financial institutions
that it has already acquired or may acquire in the future are deficient, the
Bank would be subject to liability, including fines and regulatory actions such
as restrictions on its ability to pay dividends and the necessity to obtain
regulatory approvals to proceed with certain aspects of its business plan,
including its acquisition plans.
Risks Related to Market Events
Our loan portfolio is heavily concentrated in mortgage
loans secured by properties in Florida and Georgia which causes our risk of loss
to be higher than if we had a more geographically diversified portfolio.
Our interest-earning assets are heavily concentrated
in mortgage loans secured by real estate, particularly real estate located in
Florida and Georgia. As of December 31, 2017, approximately 70% of our loans
included real estate as a primary, secondary, or tertiary component of
collateral. The real estate collateral in each case provides an alternate source
of repayment in the event of default by the borrower; however, the value of the
collateral may decline during the time the credit is extended. If we are
required to liquidate the collateral securing a loan during a period of reduced
real estate values to satisfy the debt, our earnings and capital could be
adversely affected.
Additionally, as of December 31, 2017, substantially
all of our loans secured by real estate are secured by commercial and
residential properties located in Northern Florida and Middle Georgia. The
concentration of our loans in these areas subjects us to risk that a downturn
in the economy or recession in these areas could result in a decrease in loan
originations and increases in delinquencies and foreclosures, which would more
greatly affect us than if our lending were more geographically diversified. In
addition, since a large portion of our portfolio is secured by properties located
in Florida and Georgia, the occurrence of a natural disaster, such as a
hurricane, or a man-made disaster could result in a decline in loan
originations, a decline in the value or destruction of mortgaged properties and
an increase in the risk of delinquencies, foreclosures or loss on loans
originated by us. We may suffer further losses due to the decline in the value
of the properties underlying our mortgage loans, which would have an adverse
impact on our results of operations and financial condition.
Our concentration in loans secured by real estate may
increase our credit losses, which would negatively affect our financial
results.
Due to the lack of diversified industry within the
markets served by the Bank and the relatively close proximity of our geographic
markets, we have both geographic concentrations as well as concentrations in
the types of loans funded. Specifically, due to the nature of our markets, a
significant portion of the portfolio has historically been secured with real estate.
As of December 31, 2017, approximately 32% and 33% of our $1.653 billion loan
portfolio was secured by commercial real estate and residential real estate,
respectively. As of this same date, approximately 5% was secured by property
under construction.
In the event we are required to foreclose on a
property securing one of our mortgage loans or otherwise pursue our remedies in
order to protect our investment, we may be unable to recover funds in an amount
equal to our projected return on our investment or in an amount sufficient to
prevent a loss to us due to prevailing economic conditions, real estate values
and other factors associated with the ownership of real property. As a result,
the market value of the real estate or other collateral underlying our loans
may not, at any given time, be sufficient to satisfy the outstanding principal
amount of the loans, and consequently, we would sustain loan losses.
The fair value of our investments could decline which
would cause a reduction in shareowners’ equity.
A large portion of our investment securities portfolio
as of December 31, 2017 has been designated as available-for-sale pursuant to
U.S. generally accepted accounting principles relating to accounting for
investments. Such principles require that unrealized gains and losses in the
estimated value of the available-for-sale portfolio be “marked to market” and
reflected as a separate item in shareowners’ equity (net of tax) as accumulated
other comprehensive income/loss. Shareowners’ equity will continue to reflect
the unrealized gains and losses (net of tax) of these investments. The fair
value of our investment portfolio may decline, causing a corresponding decline
in shareowners’ equity.
Management believes that several factors will affect
the fair values of our investment portfolio. These include, but are not limited
to, changes in interest rates or expectations of changes in interest rates, the
degree of volatility in the securities markets, inflation rates or expectations
of inflation and the slope of the interest rate yield curve (the yield curve
refers to the differences between short-term and long-term interest rates; a
positively sloped yield curve means short-term rates are lower than long-term
rates). These and other factors may impact specific categories of the portfolio
differently, and we cannot predict the effect these factors may have on any
specific category.
Risks
Related to an Investment in Our Common Stock
We may be
unable to pay dividends in the future.
In 2017, our Board
of Directors declared four quarterly cash dividends. Declarations of any future
dividends will be contingent on our ability to earn sufficient profits and to
remain well capitalized, including our ability to hold and generate sufficient capital
to comply with the new CET1 conservation buffer requirement. In addition, due
to our contractual obligations with the holders of our trust preferred
securities, if we defer the payment of accrued interest owed to the holders of
our trust preferred securities, we may not make dividend payments to our
shareowners.
Further, under
applicable statutes and regulations, CCB’s board of directors, after
charging-off bad debts, depreciation and other worthless assets, if any, and
making provisions for reasonably anticipated future losses on loans and other
assets, may quarterly, semi-annually, or annually declare and pay dividends to
CCBG of up to the aggregate net income of that period combined with the CCB’s
retained net income for the preceding two years and, with the approval of the
Florida Office of Financial Regulation and Federal Reserve, declare a dividend
from retained net income which accrued prior to the preceding two years.
Additional state laws generally applicable to Florida corporations may also
limit our ability to declare and pay dividends. Thus, our ability to fund
future dividends may be restricted by state and federal laws and
regulations.
Limited trading
activity for shares of our common stock may contribute to price volatility.
While our common
stock is listed and traded on the Nasdaq Global Select Market, there has
historically been limited trading activity in our common stock. The average
daily trading volume of our common stock over the 12-month period ending
December 31, 2017 was approximately 23,793 shares. Due to the limited trading
activity of our common stock, relativity small trades may have a significant
impact on the price of our common stock.
Securities
analysts may not initiate coverage or continue to cover our common stock, and
this may have a negative impact on its market price.
The trading market
for our common stock will depend in part on the research and reports that
securities analysts publish about us and our business. We do not have any
control over securities analysts and they may not initiate coverage or continue
to cover our common stock. If securities analysts do not cover our common
stock, the lack of research coverage may adversely affect its market price. If
we are covered by securities analysts, and our common stock is the subject of
an unfavorable report, our stock price would likely decline. If one or more of
these analysts ceases to cover our Company or fails to publish regular reports
on us, we could lose visibility in the financial markets, which may cause our
stock price or trading volume to decline.
Our directors,
executive officers, and principal shareowners, if acting together, have
substantial control over all matters requiring shareowner approval, including
changes of control. Because Mr. William G. Smith, Jr. is a principal shareowner
and our Chairman, President, and Chief Executive Officer and Chairman of the
Bank, he has substantial control over all matters on a day to day basis.
Our directors,
executive officers, and principal shareowners beneficially owned approximately
33.5% of the outstanding shares of our common stock as of December 31, 2017.
Our principal shareowners include the Estate of Robert H. Smith, who was the
brother of William G. Smith, Jr., our Chairman, President and Chief Executive
Officer, which beneficially owns 15.5% of our shares. William G. Smith, Jr. beneficially
owns 20.9% of our
shares. In addition, 2S Partnership beneficially owns 6.2% of our shares, however, its
shares were historically deemed to be beneficially owned by Messrs. Smith and
Smith. Together, Mr. Smith and the Estate of Robert H. Smith beneficially own
approximately 30.2%
of our shares.
Accordingly, these
directors, executive officers, and principal shareowners, if acting together,
may be able to influence or control matters requiring approval by our
shareowners, including the election of directors and the approval of mergers,
acquisitions or other extraordinary transactions. In addition, because William
G. Smith, Jr. is the Chairman, President, and Chief Executive Officer of CCBG
and Chairman of the Bank, he has substantial control over all matters on a
day-to-day basis, including the nomination and election of directors.
These directors,
executive officers, and principal shareowners may also have interests that
differ from yours and may vote in a way with which you disagree and which may
be adverse to your interests. The concentration of ownership may have the
effect of delaying, preventing or deterring a change of control of our company,
could deprive our shareowners of an opportunity to receive a premium for their
common stock as part of a sale of our Company and might ultimately affect the
market price of our common stock. You may also have difficulty changing
management, the composition of the Board of Directors, or the general direction
of our Company.
Our Articles of Incorporation, Bylaws, and
certain laws and regulations may prevent or delay transactions you might favor,
including a sale or merger of CCBG.
CCBG is registered with the Federal Reserve as a financial holding company
under the Bank Holding Company Act (“BHCA”). As a result, we are subject to
supervisory regulation and examination by the Federal Reserve. The
Gramm-Leach-Bliley Act, the BHCA, and other federal laws subject financial
holding companies to particular restrictions on the
types of activities in which they may engage, and to a range of supervisory
requirements and activities, including regulatory enforcement actions for
violations of laws and regulations.
Provisions of our
Articles of Incorporation, Bylaws, certain laws and regulations and various
other factors may make it more difficult and expensive for companies or persons
to acquire control of us without the consent of our Board of Directors. It is
possible, however, that you would want a takeover attempt to succeed because,
for example, a potential buyer could offer a premium over the then prevailing
price of our common stock.
For example, our
Articles of Incorporation permit our Board of Directors to issue preferred
stock without shareowner action. The ability to issue preferred stock could
discourage a company from attempting to obtain control of us by means of a
tender offer, merger, proxy contest or otherwise. Additionally, our Articles of
Incorporation and Bylaws divide our Board of Directors into three classes, as
nearly equal in size as possible, with staggered three-year terms. One class is
elected each year. The classification of our Board of Directors could make it
more difficult for a company to acquire control of us. We are also subject to
certain provisions of the Florida Business Corporation Act and our Articles of
Incorporation that relate to business combinations with interested shareowners.
Other provisions in our Articles of Incorporation or Bylaws that may discourage
takeover attempts or make them more difficult include:
·
Supermajority voting requirements
to remove a director from office;
·
Provisions regarding the timing
and content of shareowner proposals and nominations;
·
Supermajority voting requirements
to amend Articles of Incorporation unless approval is received by a majority of
“disinterested directors”;
·
Absence of cumulative voting; and
·
Inability
for shareowners to take action by written consent.
Shares of our
common stock are not an insured deposit and may lose value.
The shares of our
common stock are not a bank deposit and will not be insured or guaranteed by
the FDIC or any other government agency. Your investment will be subject to
investment risk, and you must be capable of affording the loss of your entire
investment.
Item 1B. Unresolved Staff Comments
None.
Item
2. Properties
We are headquartered in Tallahassee,
Florida. Our executive office is in the Capital City Bank building located on
the corner of Tennessee and Monroe Streets in downtown Tallahassee. The
building is owned by the Bank, but is located on land leased under a long-term
agreement.
As of February 28, 2018, the Bank had 59
banking offices. Of the 59 locations, the Bank leases the land,
buildings, or both at six locations and owns the land and buildings at the
remaining 53.
Item 3. Legal Proceedings
We are party to lawsuits and claims
arising out of the normal course of business. In management’s opinion, there
are no known pending claims or litigation, the outcome of which would,
individually or in the aggregate, have a material effect on our consolidated
results of operations, financial position, or cash flows.
Item 4. Mine Safety Disclosure.
Not applicable.
PART II
Item 5. Market for the Registrant's Common Equity,
Related Shareowner Matters, and Issuer Purchases of Equity Securities
Common Stock Market Prices and Dividends
Our common stock trades on the Nasdaq
Global Select Market under the symbol “CCBG.” We had a total of 1,389
shareowners of record as of February 28, 2018.
The following table presents the range of
high and low closing sales prices reported on the Nasdaq Global Select Market
and cash dividends declared for each quarter during the past two years.
|
|
2017
|
|
2016
|
|
|
Fourth Quarter
|
|
Third Quarter
|
|
Second Quarter
|
|
First Quarter
|
|
Fourth Quarter
|
|
Third Quarter
|
|
Second Quarter
|
|
First Quarter
|
|
Common stock price:
|
|
|
|
|
|
|
|
|
|
|
|
|
|
|
|
|
|
|
|
|
|
|
|
|
High
|
$
|
26.01
|
|
$
|
24.58
|
|
$
|
22.39
|
|
$
|
21.79
|
|
$
|
23.15
|
|
$
|
15.35
|
|
$
|
15.96
|
|
$
|
15.88
|
|
Low
|
|
22.21
|
|
|
19.60
|
|
|
17.68
|
|
|
19.22
|
|
|
14.29
|
|
|
13.32
|
|
|
13.16
|
|
|
12.83
|
|
Close
|
|
22.94
|
|
|
24.01
|
|
|
20.42
|
|
|
21.39
|
|
|
20.48
|
|
|
14.77
|
|
|
13.92
|
|
|
14.59
|
|
Cash dividends per share
|
|
0.07
|
|
|
0.07
|
|
|
0.05
|
|
|
0.05
|
|
|
0.05
|
|
|
0.04
|
|
|
0.04
|
|
|
0.04
|
Florida law and Federal regulations impose restrictions on our
ability to pay dividends and limitations on the amount of dividends that the
Bank can pay annually to us. See Item 1. “Capital; Dividends; Sources of
Strength” and “Dividends” in the Business section on page 12 and 13 and the
section entitled “Liquidity and Capital Resources – Dividends” -- in
Management's Discussion and Analysis of Financial Condition and Operating
Results on page 32 and Note 14 in the Notes to Consolidated Financial
Statements.
Performance Graph
This performance graph compares the
cumulative total shareholder return on our common stock with the cumulative
total shareholder return of the Nasdaq Composite Index and the SNL Financial LC
$1B-$5B Bank Index for the past five years. The graph assumes that
$100 was invested on December 31, 2012 in our common stock and each of the
above indices, and that all dividends were reinvested. The
shareholder return shown below represents past performance and should not be considered
indicative of future performance.
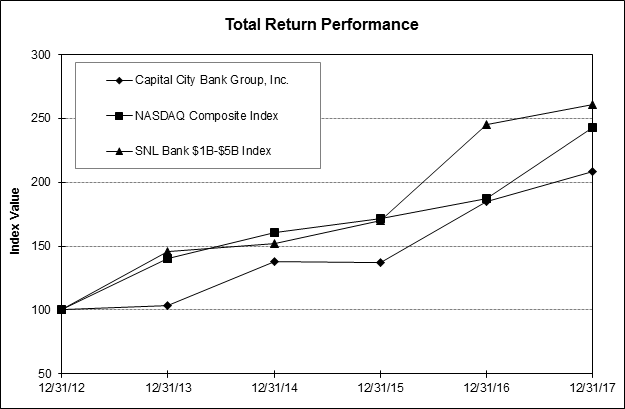
|
|
Period Ending
|
|
Index
|
12/31/12
|
|
12/31/13
|
|
12/31/14
|
|
12/31/15
|
|
12/31/16
|
|
12/31/17
|
|
Capital City Bank Group, Inc.
|
$
|
100.00
|
|
$
|
103.52
|
|
$
|
137.54
|
|
$
|
137.03
|
|
$
|
184.80
|
|
$
|
208.74
|
|
Nasdaq Composite
|
|
100.00
|
|
|
140.12
|
|
|
160.78
|
|
|
171.97
|
|
|
187.22
|
|
|
242.71
|
|
SNL $1B-$5B Bank Index
|
|
100.00
|
|
|
145.41
|
|
|
152.04
|
|
|
170.20
|
|
|
244.85
|
|
|
261.04
|
|
Item
6. Selected Financial Data
|
|
|
|
|
|
|
|
|
|
|
|
|
|
|
|
|
|
|
|
|
|
|
|
|
|
|
|
|
|
|
|
|
|
(Dollars in Thousands, Except Per Share Data)
|
2017
|
|
2016
|
|
2015
|
|
2014
|
|
2013
|
|
|
Interest Income
|
$
|
86,930
|
|
$
|
81,154
|
|
$
|
79,658
|
|
$
|
78,221
|
|
$
|
82,152
|
|
|
Net Interest Income
|
|
82,982
|
|
|
77,965
|
|
|
76,351
|
|
|
74,641
|
|
|
77,736
|
|
|
Provision for Loan Losses
|
|
2,215
|
|
|
819
|
|
|
1,594
|
|
|
1,905
|
|
|
3,472
|
|
|
Noninterest Income(4)
|
|
51,746
|
|
|
53,681
|
|
|
54,091
|
|
|
52,536
|
|
|
55,111
|
|
|
Noninterest Expense
|
|
109,447
|
|
|
113,214
|
|
|
115,273
|
|
|
114,358
|
|
|
121,405
|
|
|
Net Income(5)
|
|
10,863
|
|
|
11,746
|
|
|
9,116
|
|
|
9,260
|
|
|
6,045
|
|
|
|
|
|
|
|
|
|
|
|
|
|
|
|
|
|
|
|
Per Common Share:
|
|
|
|
|
|
|
|
|
|
|
|
|
|
|
|
|
Basic Net Income
|
$
|
0.64
|
|
$
|
0.69
|
|
$
|
0.53
|
|
$
|
0.53
|
|
$
|
0.35
|
|
|
Diluted Net Income
|
|
0.64
|
|
|
0.69
|
|
|
0.53
|
|
|
0.53
|
|
|
0.35
|
|
|
Cash Dividends Declared
|
|
0.24
|
|
|
0.17
|
|
|
0.13
|
|
|
0.09
|
|
|
-
|
|
|
Diluted Book Value
|
|
16.65
|
|
|
16.23
|
|
|
15.93
|
|
|
15.53
|
|
|
15.85
|
|
|
|
|
|
|
|
|
|
|
|
|
|
|
|
|
|
|
|
Performance Ratios:
|
|
|
|
|
|
|
|
|
|
|
|
|
|
|
|
|
Return on Average Assets
|
|
0.39
|
%
|
|
0.43
|
%
|
|
0.34
|
%
|
|
0.36
|
%
|
|
0.24
|
%
|
|
Return on Average Equity
|
|
3.83
|
|
|
4.22
|
|
|
3.31
|
|
|
3.27
|
|
|
2.40
|
|
|
Net Interest Margin (FTE)
|
|
3.37
|
|
|
3.25
|
|
|
3.31
|
|
|
3.36
|
|
|
3.54
|
|
|
Noninterest Income as % of Operating Revenues
|
|
38.41
|
|
|
40.78
|
|
|
41.47
|
|
|
41.30
|
|
|
41.48
|
|
|
Efficiency Ratio
|
|
80.50
|
|
|
85.34
|
|
|
87.94
|
|
|
89.68
|
|
|
91.09
|
|
|
|
|
|
|
|
|
|
|
|
|
|
|
|
|
|
|
|
Asset Quality:
|
|
|
|
|
|
|
|
|
|
|
|
|
|
|
|
|
Allowance for Loan Losses
|
$
|
13,307
|
|
$
|
13,431
|
|
$
|
13,953
|
|
$
|
17,539
|
|
$
|
23,095
|
|
|
Allowance for Loan Losses to Loans
|
|
0.80
|
%
|
|
0.86
|
%
|
|
0.93
|
%
|
|
1.22
|
%
|
|
1.65
|
%
|
|
Nonperforming Assets
|
|
11,100
|
|
|
19,171
|
|
|
29,595
|
|
|
52,449
|
|
|
85,035
|
|
|
Nonperforming Assets to Assets
|
|
0.38
|
|
|
0.67
|
|
|
1.06
|
|
|
2.00
|
|
|
3.26
|
|
|
Nonperforming Assets to Loans plus OREO
|
|
0.67
|
|
|
1.21
|
|
|
1.94
|
|
|
3.55
|
|
|
5.87
|
|
|
Allowance to Nonperforming Loans
|
|
185.87
|
|
|
157.40
|
|
|
135.40
|
|
|
104.60
|
|
|
62.48
|
|
|
Net Charge-Offs to Average Loans
|
|
0.14
|
|
|
0.09
|
|
|
0.35
|
|
|
0.53
|
|
|
0.66
|
|
|
|
|
|
|
|
|
|
|
|
|
|
|
|
|
|
|
|
Capital Ratios:
|
|
|
|
|
|
|
|
|
|
|
|
|
|
|
|
|
Tier 1 Capital
|
|
16.33
|
%
|
|
15.51
|
%
|
|
16.42
|
%
|
|
16.67
|
%
|
|
16.56
|
%
|
|
Total Capital
|
|
17.10
|
|
|
16.28
|
|
|
17.25
|
|
|
17.76
|
|
|
17.94
|
|
|
Common Equity Tier 1 Capital(1)
|
|
13.42
|
|
|
12.61
|
|
|
12.84
|
|
|
NA
|
|
|
NA
|
|
|
Tangible Common Equity(2)
|
|
7.09
|
|
|
6.90
|
|
|
6.99
|
|
|
7.38
|
|
|
7.58
|
|
|
Leverage
|
|
10.47
|
|
|
10.23
|
|
|
10.65
|
|
|
10.99
|
|
|
10.46
|
|
|
Equity to Assets
|
|
9.80
|
|
|
9.67
|
|
|
9.81
|
|
|
10.37
|
|
|
10.58
|
|
|
Dividend Pay-Out
|
|
37.50
|
|
|
24.64
|
|
|
24.53
|
|
|
16.98
|
|
|
NM
|
|
|
|
|
|
|
|
|
|
|
|
|
|
|
|
|
|
|
|
Averages for the Year:
|
|
|
|
|
|
|
|
|
|
|
|
|
|
|
|
|
Loans, Net of Unearned Income
|
$
|
1,618,583
|
|
$
|
1,542,232
|
|
$
|
1,474,833
|
|
$
|
1,414,000
|
|
$
|
1,450,806
|
|
|
Earning Assets
|
|
2,502,231
|
|
|
2,432,392
|
|
|
2,324,854
|
|
|
2,237,623
|
|
|
2,213,686
|
|
|
Total Assets
|
|
2,816,096
|
|
|
2,752,309
|
|
|
2,659,317
|
|
|
2,564,176
|
|
|
2,568,662
|
|
|
Deposits
|
|
2,371,871
|
|
|
2,282,785
|
|
|
2,163,441
|
|
|
2,093,477
|
|
|
2,070,073
|
|
|
Shareowners’ Equity
|
|
283,404
|
|
|
278,335
|
|
|
275,144
|
|
|
283,079
|
|
|
251,427
|
|
|
|
|
|
|
|
|
|
|
|
|
|
|
|
|
|
|
|
Year-End Balances:
|
|
|
|
|
|
|
|
|
|
|
|
|
|
|
|
|
Loans, Net of Unearned Income
|
$
|
1,658,309
|
|
$
|
1,572,175
|
|
$
|
1,503,907
|
|
$
|
1,442,062
|
|
$
|
1,399,669
|
|
|
Earning Assets
|
|
2,582,922
|
|
|
2,520,053
|
|
|
2,470,444
|
|
|
2,276,781
|
|
|
2,274,019
|
|
|
Total Assets
|
|
2,898,794
|
|
|
2,845,197
|
|
|
2,797,860
|
|
|
2,627,169
|
|
|
2,611,903
|
|
|
Deposits
|
|
2,469,877
|
|
|
2,412,286
|
|
|
2,302,849
|
|
|
2,146,794
|
|
|
2,136,248
|
|
|
Shareowners’ Equity
|
|
284,210
|
|
|
275,168
|
|
|
274,352
|
|
|
272,540
|
|
|
276,400
|
|
|
|
|
|
|
|
|
|
|
|
|
|
|
|
|
|
|
|
Other Data:
|
|
|
|
|
|
|
|
|
|
|
|
|
|
|
|
|
Basic Average Shares Outstanding
|
|
16,951,663
|
|
|
16,988,747
|
|
|
17,273,406
|
|
|
17,424,788
|
|
|
17,324,759
|
|
|
Diluted Average Shares Outstanding
|
|
17,012,637
|
|
|
17,061,186
|
|
|
17,318,184
|
|
|
17,488,020
|
|
|
17,399,355
|
|
|
Shareowners of Record(3)
|
|
1,389
|
|
|
1,489
|
|
|
1,559
|
|
|
1,589
|
|
|
1,651
|
|
|
Banking Locations(3)
|
|
59
|
|
|
60
|
|
|
61
|
|
|
63
|
|
|
63
|
|
|
Full-Time Equivalent Associates(3)
|
|
789
|
|
|
820
|
|
|
858
|
|
|
895
|
|
|
891
|
|
|
|
|
|
|
|
|
|
|
|
|
|
|
|
|
|
|
|
(1) Not applicable prior to January 1, 2015
|
|
|
|
|
|
|
|
|
|
|
|
(2) Tangible common equity ratio is a
non-GAAP financial measure. For additional information, including a
reconciliation to GAAP, refer to page 31
|
|
|
(3) As of record date. The record date is
on or about March 1st of the following year.
|
|
|
|
|
|
|
|
|
|
|
|
(4) Includes $2.5 million gain from sale of
trust preferred securities in 2016.
|
|
|
|
|
|
|
|
|
|
|
|
(5) For 2017, includes $4.1 million, or
$0.24 per diluted share, income tax expense adjustment related to the Tax
Cuts and Jobs Act of 2017.
|
|
|
NM - Not Meaningful
|
|
|
|
|
|
|
|
|
|
|
|
|
|
|
|
NON-GAAP FINANCIAL MEASURE
We present a tangible common equity ratio
that removes the effect of goodwill that resulted from merger and acquisition
activity. We believe this measure is useful to investors because it allows
investors to more easily compare our capital adequacy to other companies in the
industry. The GAAP to non-GAAP reconciliation for selected financial data and
quarterly financial data is provided below.
|
Non-GAAP Reconciliation - Selected Financial Data
|
|
|
|
|
|
|
|
|
|
|
|
|
|
|
|
|
|
|
|
|
|
|
|
(Dollars in Thousands)
|
|
2017
|
|
2016
|
|
2015
|
|
2014
|
|
2013
|
|
TANGIBLE COMMON EQUITY RATIO
|
|
|
|
|
|
|
|
|
|
|
|
|
|
|
|
|
Shareowners' Equity (GAAP)
|
|
$
|
284,210
|
|
$
|
275,168
|
|
$
|
274,352
|
|
$
|
272,540
|
|
$
|
276,400
|
|
Less: Goodwill (GAAP)
|
|
|
84,811
|
|
|
84,811
|
|
|
84,811
|
|
|
84,811
|
|
|
84,843
|
|
Tangible Shareowners' Equity (non-GAAP)
|
A
|
|
199,399
|
|
|
190,357
|
|
|
189,541
|
|
|
187,729
|
|
|
191,557
|
|
Total Assets (GAAP)
|
|
|
2,898,794
|
|
|
2,845,197
|
|
|
2,797,860
|
|
|
2,627,169
|
|
|
2,611,903
|
|
Less: Goodwill (GAAP)
|
|
|
84,811
|
|
|
84,811
|
|
|
84,811
|
|
|
84,811
|
|
|
84,843
|
|
Tangible Assets (non-GAAP)
|
B
|
$
|
2,813,983
|
|
$
|
2,760,386
|
|
$
|
2,713,049
|
|
$
|
2,542,358
|
|
$
|
2,527,060
|
|
Tangible Common Equity Ratio (non-GAAP)
|
A/B
|
|
7.09%
|
|
|
6.90%
|
|
|
6.99%
|
|
|
7.38%
|
|
|
7.58%
|
|
Non-GAAP Reconciliation - Quarterly Financial Data
|
|
|
|
|
|
|
|
|
|
|
|
|
|
|
|
|
|
|
|
|
|
|
|
|
|
|
|
|
|
|
|
|
|
|
|
|
|
|
|
|
|
2017
|
|
2016
|
|
(Dollars in Thousands)
|
|
Fourth
|
|
Third
|
|
Second
|
|
First
|
|
|
Fourth
|
|
|
Third
|
|
|
Second
|
|
|
First
|
|
TANGIBLE COMMON EQUITY RATIO
|
|
|
|
|
|
|
|
|
|
|
|
|
|
|
|
|
|
|
|
|
|
|
|
|
Shareowners' Equity (GAAP)
|
|
$
|
284,210
|
|
$
|
285,201
|
|
$
|
281,513
|
|
$
|
278,059
|
|
$
|
275,168
|
|
$
|
276,624
|
|
$
|
274,824
|
|
$
|
276,833
|
|
Less: Goodwill (GAAP)
|
|
|
84,811
|
|
|
84,811
|
|
|
84,811
|
|
|
84,811
|
|
|
84,811
|
|
|
84,811
|
|
|
84,811
|
|
|
84,811
|
|
Tangible Shareowners' Equity (non-GAAP)
|
A
|
|
199,399
|
|
|
200,390
|
|
|
196,702
|
|
|
193,248
|
|
|
190,357
|
|
|
191,813
|
|
|
190,013
|
|
|
192,022
|
|
Total Assets (GAAP)
|
|
|
2,898,794
|
|
|
2,790,842
|
|
|
2,814,843
|
|
|
2,895,531
|
|
|
2,845,197
|
|
|
2,753,154
|
|
|
2,767,636
|
|
|
2,792,186
|
|
Less: Goodwill (GAAP)
|
|
|
84,811
|
|
|
84,811
|
|
|
84,811
|
|
|
84,811
|
|
|
84,811
|
|
|
84,811
|
|
|
84,811
|
|
|
84,811
|
|
Tangible Assets (non-GAAP)
|
B
|
$
|
2,813,983
|
|
$
|
2,706,031
|
|
$
|
2,730,032
|
|
$
|
2,810,720
|
|
$
|
2,760,386
|
|
$
|
2,668,343
|
|
$
|
2,682,825
|
|
$
|
2,707,375
|
|
Tangible Common Equity Ratio (non-GAAP)
|
A/B
|
|
7.09%
|
|
|
7.41%
|
|
|
7.21%
|
|
|
6.88%
|
|
|
6.90%
|
|
|
7.19%
|
|
|
7.08%
|
|
|
7.09%
|
Item 7. Management's Discussion and Analysis of
Financial Condition and Results of Operations
Management’s discussion and analysis
(“MD&A”) provides supplemental information, which sets forth the major
factors that have affected our financial condition and results of operations
and should be read in conjunction with the Consolidated Financial Statements
and related notes included in the Annual Report on Form 10-K. The
MD&A is divided into subsections entitled “Business Overview,” “Executive Overview,”
“Results of Operations,” “Financial Condition,” “Liquidity and Capital
Resources,” “Off-Balance Sheet Arrangements,” “Fourth Quarter, 2017 Financial
Results,” and “Accounting Policies.” The following information
should provide a better understanding of the major factors and trends that
affect our earnings performance and financial condition, and how our performance
during 2017 compares with prior years. Throughout this section,
Capital City Bank Group, Inc., and its subsidiaries, collectively, are referred
to as “CCBG,” “Company,” “we,” “us,” or “our.”
CAUTION CONCERNING FORWARD-LOOKING
STATEMENTS
This Annual Report on Form 10-K, including
this MD&A section, contains “forward-looking statements” within the meaning
of the Private Securities Litigation Reform Act of 1995. These
forward-looking statements include, among others, statements about our beliefs,
plans, objectives, goals, expectations, estimates and intentions that are
subject to significant risks and uncertainties and are subject to change based
on various factors, many of which are beyond our control. The words “may,”
“could,” “should,” “would,” “believe,” “anticipate,” “estimate,” “expect,”
“intend,” “plan,” “target,” ”vision,” “goal,” and similar expressions are
intended to identify forward-looking statements.
All forward-looking statements, by their
nature, are subject to risks and uncertainties. Our actual future
results may differ materially from those set forth in our forward-looking
statements. Please see the Introductory Note and Item 1A Risk
Factors of this Annual Report for a discussion of factors that could
cause our actual results to differ materially from those in the forward-looking
statements.
However, other factors besides those
listed in Item 1A Risk Factors or discussed in this Annual Report also
could adversely affect our results, and you should not consider any such list
of factors to be a complete set of all potential risks or
uncertainties. Any forward-looking statements made by us or on our
behalf speak only as of the date they are made. We do not undertake
to update any forward-looking statement, except as required by applicable law.
BUSINESS OVERVIEW
Our Business
We are a financial holding company headquartered in
Tallahassee, Florida, and we are the parent of our wholly owned subsidiary,
Capital City Bank (the “Bank” or “CCB”). We offer a broad
array of products and services, including commercial and retail banking
services, trust and asset management, and retail securities brokerage through a
total of 59 banking offices located in Florida, Georgia, and Alabama. Please
see the section captioned “About Us” beginning on page 4 for more detailed
information about our business.
Our profitability, like most financial institutions,
is dependent to a large extent upon net interest income, which is the
difference between the interest and fees received on interest earning assets,
such as loans and securities, and the interest paid on interest-bearing
liabilities, principally deposits and borrowings. Results of operations are
also affected by the provision for loan losses, operating expenses such as
salaries and employee benefits, occupancy and other operating expenses
including income taxes, and noninterest income such as deposit fees, wealth
management fees, mortgage banking fees, and bank card fees.
Strategic Review
Our philosophy is to build long-term client
relationships based on quality service, high ethical standards, and safe and
sound banking practices. We maintain a locally oriented, community-based
focus, which is augmented by experienced, centralized support in select
specialized areas. Our local market orientation is reflected in our network of
banking office locations, experienced community executives with a dedicated
President for each market, and community boards which support our focus on
responding to local banking needs. We strive to offer a broad array of
sophisticated products and to provide quality service by empowering associates
to make decisions in their local markets.
We have sought to build a
franchise in small-to medium-sized, less competitive markets, located on the
outskirts of the larger metropolitan markets where we are positioned as a
market leader. Many of our markets are on the outskirts of these larger
markets in close proximity to major interstate thoroughfares such as
Interstates I-10 and I-75. Our three largest markets are Tallahassee (Leon
County, Florida), Gainesville (Alachua County, Florida), and Macon (Bibb
County, Georgia). In 13 of 19 markets in Florida and two of four markets in
Georgia, we rank within the top four banks in terms of market share.
Furthermore, in the counties in which we operate, we maintain a 9.82% market
share in the Florida counties and 5.57% in the Georgia counties, suggesting
that there is significant opportunity to grow market share within these
geographic areas. The larger employers in many of our markets are state and
local governments, healthcare providers, educational institutions, and small
businesses. While we realize that the markets in our footprint do not provide
for a level of potential growth that the larger metropolitan markets may
provide, our markets do provide good growth dynamics and have historically
grown in excess of the national average The value of these markets stems from
the fact they are stable and less competitive, secondary markets. We strive to
provide value added services to our clients by being not just their bank, but
their banker. This element of our strategy distinguishes Capital City Bank
from our competitors.
Our long-term vision remains to profitably expand our
franchise through a combination of organic growth in existing markets and
acquisitions. We have long understood that our core deposit funding base is a
predominant driver of our profitability and overall franchise value, and have
focused extensively on this component of our organic growth efforts in recent
years. While we have not been an active acquirer of banks since 2005, this
component of our strategy is still in place. When evaluating potential
acquisition opportunities, we will continue to weigh the value of organic
growth initiatives versus potential acquisition returns and pursue the
strategies that we believe provide the best overall return to our shareowners.
Potential acquisition opportunities will continue to
be focused on Florida, Georgia, and Alabama with a particular focus on
financial institutions located on the outskirts of larger, metropolitan areas.
Five markets have been identified, four in Florida and one in Georgia, in which
management intends to proactively pursue expansion opportunities. These
markets include Alachua, Marion, Hernando/Pasco counties in Florida, the
western panhandle of Florida, and Bibb and surrounding counties in central
Georgia. Our focus on some of these markets may change as we continue to
evaluate our strategy and the economic conditions and demographics of any
individual market. We will also continue to evaluate de novo expansion
opportunities in attractive new markets in the event that acquisition
opportunities are not feasible. Other expansion opportunities that will be
evaluated include asset management, mortgage banking, and other financial
businesses that are closely aligned with the business of banking. Embedded in
our acquisition strategy is our desire to partner with institutions that are
culturally similar, have experienced management and possess either established
market presence or have potential for improved profitability through growth,
economies of scale, or expanded services. Generally, these target institutions
will range in asset size from $100 million to $500 million.
EXECUTIVE
OVERVIEW
In 2017, we
realized marked improvement in our overall financial performance. Results were
driven by continued loan growth, a rising interest rate environment, improving
credit costs, and a disciplined approach to managing expenses. Our net
interest margin increased 12 basis points aided by our asset-sensitive balance
sheet and strong core deposit base. Average deposit balances grew 3.9% in
2017, our fourth consecutive year of growth, and have grown approximately $300
million, or 15% since 2013. In addition, noninterest expense declined for the
seventh consecutive year and we have reduced annual expenses by $24 million
since 2010.
For 2017, we realized net income of $10.9 million, or $0.64 per diluted
share, compared to $11.7 million, or $0.69 per diluted share in 2016. Net
income in 2017 reflected a $4.1 million, or $0.24 per diluted share, income tax
expense related to the tax reform act commonly known as Tax Cuts and Jobs Act
(the “Tax Act”) enacted on December 22, 2017.
Net income in 2017
reflected higher net interest income of $5.0 million and a $3.8 million
reduction in noninterest expense, partially offset by lower noninterest income
of $1.9 million, a $1.4 million increase in loan loss provision, and a $6.3
million increase in income taxes ($4.1 million attributable to deferred tax
re-measurement related to the Tax Act).
Below are summary
highlights that impacted our performance for the year:
·
Significant improvement in operating leverage driven by margin
expansion and expense reduction
·
Net interest income up $5.0 million, or 6.4%
·
Average loan growth of $76 million, or 5.0%
·
Noninterest expense down $3.8 million, or 3.3%
·
NPAs and classified assets down 42% and 33%, respectively
During 2017, we again realized
meaningful re-composition in our earning asset mix as solid loan growth and
increased deployment of liquidity into our investment portfolio drove a 6.4%
increase in net interest income. Loan growth in 2017 was broad based as we
realized average annual growth in all categories except home equity. Increased
economic activity and new loan production in our metro markets drove a majority
of the growth, however, activity in our smaller rural markets improved in
2017.
Total noninterest income declined $1.9 million, or 3.6%, from 2016,
which was primarily attributable to a $2.5 million gain from the partial
retirement of our trust preferred securities (“TRUPs”) in 2016. Strong growth
in wealth management and mortgage banking helped to offset the TRUPs gain
contributing growth of 18% and 11%, respectively. We continue to evaluate
opportunities to enhance deposit fee and bank card revenues and gained momentum
with these initiatives in 2017.
Noninterest
expense decreased $3.8 million, or 3.3%, from 2016 as remaining cycle costs in
our expense structure were removed, including other real estate expense, legal
expense, and FDIC insurance expense. Lower occupancy expense also contributed
to the reduction in noninterest expense and reflected our continuing efforts to
optimize our banking office structure and operational processes.
Our nonperforming
and classified asset levels declined noticeably again in 2017 as evidenced by
decreases of 42% and 33%, respectively. We remain committed to our legacy of
strong credit underwriting standards and continue to enhance our loan portfolio
risk management practices which have resulted in net loan losses of 9 basis
points and 14 basis points for 2016 and 2017, respectively.
We continue to
focus on and implement strategic initiatives that enhance long-term shareowner
value and believe we are well positioned to continue improving our operating
leverage and returning to our historical norm of profitability.
Key components of
our 2017 financial performance are summarized below:
Results of
Operations
·
For
2017, taxable equivalent net interest income increased $5.2 million, or 6.6%,
to $84.2 million driven by a positive shift in earning asset mix due to growth
in the loan and investment portfolios, coupled with higher short-term interest
rates, partially offset by a higher rate paid on negotiated rate deposits. Our
net interest margin of 3.37% in 2017 was 12 basis points higher than the 3.25%
recorded in 2016, driven by a 14 basis point increase in the earning asset
yield that was partially offset by a two basis point reduction in the cost of
funds.
·
For 2017, the provision for loan losses was $2.2 million for 2017
compared to $0.8 million for 2016 with the increase attributable to a higher
level of net loan charge-offs and growth in the loan portfolio. The higher
level of net loan charge-offs reflected a lower level of loan recoveries as
2016 was a very successful year for collecting on loan loss judgments.
·
For 2017, noninterest income totaled
$51.7 million, a decrease of $1.9 million, or 3.6%, from 2016 attributable to
lower other income of $2.7 million and deposit fees of $1.0 million, partially
offset by higher wealth management fees of $1.2 million and mortgage banking
fees of $0.6 million. The decrease in other income was attributable to a $2.5 million
gain from the partial retirement of our trust preferred securities in 2016.
·
For 2017, noninterest expense totaled
$109.4 million, a decrease of $3.8 million, or 3.3%, from 2016 attributable to
lower other expense of $3.2 million (primarily cycle-related costs: OREO of
$2.5 million, legal of $0.4 million, and FDIC insurance of $0.4 million),
occupancy expense of $0.5 million, and compensation expense of $0.1 million.
Financial
Condition
·
Average
assets totaled approximately $2.816 billion for 2017, an increase of $63.8
million, or 2.3%, over 2016. Average earning assets were
approximately $2.502 billion for 2017, an increase of $69.8 million, or 2.9%
over 2016. Year-over-year, average net overnight
funds decreased $22.8 million, while investment securities increased $16.3
million and average gross loans were higher by $76.4 million.
·
Average
gross loans totaled $1.619 billion in 2017, an increase of $76.4 million, or
5.0%, over 2016. Loans as a percentage of average earning assets increased to
64.7% in 2017 compared to 63.4% in 2016. Year-over-year, average balances in
the loan portfolio experienced increases in all loan categories except home
equity loans. A portion of the increase compared to the prior year was due to
strategic loan purchases of approximately $26.8 million in adjustable
residential real estate loans and $16.4 million in fixed and adjustable rate
commercial real estate loans.
·
Average
total deposits for 2017 were $2.372 billion, an increase of $89.1 million, or
3.9%, over 2016 and reflected increases in all deposit types
except certificates of deposit. 2017 was the fourth consecutive year that we
have realized growth in our average deposit balances.
·
At December 31, 2017, our
nonperforming assets (nonaccrual loans and OREO) totaled $11.1 million, a
decrease of $8.1 million, or 42% from December 31, 2016. Nonaccrual loans
totaled $7.2 million at December 31, 2017, a $1.4 million decrease from December
31, 2016. The balance of OREO totaled $3.9 million at December 31, 2017, a
decrease of $6.7 million December 31, 2016. We
continued to make progress during 2017 in disposing of OREO properties totaling
$7.5 million.
Nonperforming assets represented 0.38% of total assets at December 31, 2017 compared to 0.67% at December 31, 2016.
·
At
December 31, 2017, the allowance for loan losses of $13.3 million was 0.80% of
outstanding loans (net of overdrafts) and provided coverage of 186% of
nonperforming loans compared to 0.86% and 157%, respectively, at December 31,
2016. For 2017, our net loan charge-offs totaled $2.3 million, or
0.14%, of average loans, compared to $1.3 million, or 0.09%, for 2016 with the
increase attributable to
a lower level of loan recoveries in 2017.
·
Shareowners’ equity increased by $9.0 million from $275.2 million
at December 31, 2016 to $284.2 million at December 31, 2017. We continue to
maintain a strong capital base as evidenced by a risk-based capital ratio of
17.10% and tangible common equity ratio of 7.09% at December 31, 2017 compared
to 16.28% and 6.90%, respectively, at December 31, 2016. During 2016, the
repurchase of our common shares and the partial retirement of trust preferred
securities unfavorably impacted these regulatory capital ratios by
approximately 38 basis points and 50 basis points, respectively. At December
31, 2017, all of our regulatory capital ratios exceeded the threshold to be
well-capitalized.
RESULTS OF OPERATIONS
For 2017, we realized net income of $10.9 million, or $0.64
per diluted share, which included a $4.1 million, or $0.24 per diluted share, one-time
income tax expense related to the Tax Act enacted on December 22, 2017,
compared to net income of $11.7 million, or $0.69 per diluted share in 2016,
and $9.1 million, or $0.53 per diluted share in 2015.
The decrease in net income for 2017 was attributable to
higher income tax expense of $6.3 million primarily due to a discrete tax
expense of $4.1 million related to the Tax Act. Income before income taxes
improved year over year and reflected higher net interest income of $5.0
million and a $3.8 million reduction in noninterest expense, partially offset
by lower noninterest income of $1.9 million and a $1.4 million increase in the
loan loss provision.
The increase in net income for 2016 was
attributable to lower noninterest expense of $2.0 million, higher net interest
income of $1.6 million, and a $0.8 million decrease in the loan loss provision,
partially offset by higher income taxes of $1.4 million and lower noninterest
income of $0.4 million.
A condensed earnings summary for the last three years
is presented in Table 1 below:
|
Table 1
|
|
|
|
|
|
|
|
|
|
CONDENSED SUMMARY OF EARNINGS
|
|
|
|
|
|
|
|
|
|
|
|
|
(Dollars in Thousands, Except Per Share Data)
|
2017
|
|
2016
|
|
2015
|
|
Interest Income
|
$
|
86,930
|
|
$
|
81,154
|
|
$
|
79,658
|
|
Taxable Equivalent Adjustments
|
|
1,226
|
|
|
1,011
|
|
|
638
|
|
Total Interest Income (FTE)
|
|
88,156
|
|
|
82,165
|
|
|
80,296
|
|
Interest Expense
|
|
3,948
|
|
|
3,189
|
|
|
3,307
|
|
Net Interest Income (FTE)
|
|
84,208
|
|
|
78,976
|
|
|
76,989
|
|
Provision for Loan Losses
|
|
2,215
|
|
|
819
|
|
|
1,594
|
|
Taxable Equivalent Adjustments
|
|
1,226
|
|
|
1,011
|
|
|
638
|
|
Net Interest Income After Provision for Loan Losses
|
|
80,767
|
|
|
77,146
|
|
|
74,757
|
|
Noninterest Income
|
|
51,746
|
|
|
53,681
|
|
|
54,091
|
|
Noninterest Expense
|
|
109,447
|
|
|
113,214
|
|
|
115,273
|
|
Income Before Income Taxes
|
|
23,066
|
|
|
17,613
|
|
|
13,575
|
|
Income Tax Expense
|
|
12,203
|
|
|
5,867
|
|
|
4,459
|
|
Net Income
|
$
|
10,863
|
|
$
|
11,746
|
|
$
|
9,116
|
|
|
|
|
|
|
|
|
|
|
|
Basic Net Income Per Share
|
$
|
0.64
|
|
$
|
0.69
|
|
$
|
0.53
|
|
Diluted Net Income Per Share
|
$
|
0.64
|
|
$
|
0.69
|
|
$
|
0.53
|
Net
Interest Income
Net interest income represents our single largest source of
earnings and is equal to interest income and fees generated by earning assets,
less interest expense paid on interest bearing liabilities. We
provide an analysis of our net interest income, including average yields and
rates in Tables 2 and 3 below. We provide this information on a
"taxable equivalent" basis to reflect the tax-exempt status of income
earned on certain loans and investments.
In 2017, our tax equivalent net interest income increased $5.2
million, or 6.6%. This follows increases of $2.0 million, or 2.6% and $1.9
million, or 2.5%, in 2016 and 2015, respectively. Increases over each
subsequent year reflect growth in our loan and investment portfolios. In 2017,
the increase also reflected favorable repricing of our adjustable and variable
earning assets, partially offset by a slight increase in our negotiated rate
deposits.
For 2017, taxable equivalent interest income increased $6.0
million, or 7.3%, over 2016. In 2016, taxable equivalent interest income
increased $1.9 million, or 2.3%, over 2015. The increases in both comparisons
were primarily due to higher balances in the loan and investment portfolios
coupled with higher rates.
Interest expense increased $0.8 million, or 23.8%, from 2016 to
2017, and decreased $0.1 million, or 3.7%, from 2015 to 2016. The increase over
the prior year primarily reflects increases to our negotiated rate deposits
which are tied to an adjustable rate index. The decline from 2015 to 2016 was primarily
attributable to lower interest expense on long-term debt which was paid off. The
cost of funds increased three basis points to 16 basis points in 2017 compared
to 2016 primarily due to a higher cost of negotiated rate products. The lower
cost of funds for 2016 compared to 2015 was primarily attributable to lower
interest expense on long-term debt that was paid off.
Our interest rate spread (defined as the taxable equivalent yield
on average earning assets less the average rate paid on interest bearing
liabilities) increased nine basis points in 2017 compared to 2016 and decreased
seven basis points in 2016 compared to 2015. The increase in 2017 over the
prior year reflects favorable repricing of our adjustable and variable rate
earning assets, partially offset by an increase in our negotiated rate deposits.
The decrease from 2016 to 2015 was primarily attributable to the adverse impact
of lower rates on the loan portfolio, which more than offset the repricing of
our deposit base.
Our net interest margin (defined as taxable equivalent interest
income less interest expense divided by average earning assets) of 3.37% in
2017 was a 12 basis point increase over 2016. The net interest margin of 3.25%
in 2016 was six basis points lower than the 3.31% in 2015. In 2017, the yield
on earning assets increased 15 basis points, partially offset by a three basis
point increase in our cost of funds. In 2016, the yield on earning assets
declined seven basis points compared to 2015, as the adverse impact of loan
portfolio repricing and lower fees was partially offset by a decline in the
cost of funds of one basis point.
The Federal Open Market Committee (FOMC) increased the
federal funds rate three times in 2017 to end the year with a target rate of 1.50%.
These rate increases have positively affected our net interest income due to
favorable repricing of our variable and adjustable rate earning assets.
Although these rate increases have also resulted in higher rates paid on our
negotiated rate deposit products, we continue to monitor and manage our overall
cost of funds. Despite highly competitive loan pricing across most markets, the
yield of the overall loan portfolio has increased year-over-year.
Various loan strategies, which align with our overall
risk appetite, continue to be reviewed and implemented to enhance our
performance. We
continue to maintain short duration portfolios on both sides of the balance
sheet and believe we are well positioned to respond to changing market
conditions.
|
Table 2
|
|
|
|
|
|
|
|
|
|
|
|
|
|
|
|
|
|
|
|
|
|
|
|
|
|
|
|
AVERAGE BALANCES AND INTEREST RATES
|
|
|
|
|
|
|
|
|
|
|
|
|
|
|
|
|
|
|
|
|
|
|
|
|
|
|
|
|
|
|
|
|
|
|
|
|
|
|
|
|
|
|
|
|
|
|
|
|
|
|
|
|
2017
|
|
|
2016
|
|
|
2015
|
|
|
|
Average
|
|
|
|
Average
|
|
Average
|
|
|
|
Average
|
|
|
Average
|
|
|
|
Average
|
|
(Taxable Equivalent Basis - Dollars in Thousands)
|
Balance
|
|
Interest
|
|
Rate
|
|
Balance
|
|
Interest
|
|
Rate
|
|
|
Balance
|
|
Interest
|
|
Rate
|
|
ASSETS
|
|
|
|
|
|
|
|
|
|
|
|
|
|
|
|
|
|
|
|
|
|
|
|
|
|
|
|
Loans, Net of Unearned Income(1)(2)
|
$
|
1,618,583
|
|
$
|
76,385
|
|
4.72
|
%
|
|
$
|
1,542,232
|
|
$
|
73,417
|
|
4.76
|
%
|
|
$
|
1,474,833
|
|
$
|
73,436
|
|
4.98
|
%
|
|
Taxable Investment Securities
|
|
595,790
|
|
|
8,095
|
|
1.36
|
|
|
|
586,284
|
|
|
6,317
|
|
1.08
|
|
|
|
530,297
|
|
|
5,223
|
|
0.98
|
|
|
Tax-Exempt Investment Securities(2)
|
|
97,867
|
|
|
1,610
|
|
1.65
|
|
|
|
91,059
|
|
|
1,327
|
|
1.46
|
|
|
|
81,748
|
|
|
1,005
|
|
1.23
|
|
|
Funds Sold
|
|
189,991
|
|
|
2,066
|
|
1.09
|
|
|
|
212,817
|
|
|
1,104
|
|
0.52
|
|
|
|
237,976
|
|
|
632
|
|
0.27
|
|
|
Total Earning Assets
|
|
2,502,231
|
|
|
88,156
|
|
3.52
|
%
|
|
|
2,432,392
|
|
|
82,165
|
|
3.38
|
%
|
|
|
2,324,854
|
|
|
80,296
|
|
3.45
|
%
|
|
Cash & Due From Banks
|
|
51,091
|
|
|
|
|
|
|
|
|
47,447
|
|
|
|
|
|
|
|
|
48,195
|
|
|
|
|
|
|
|
Allowance for Loan Losses
|
|
(13,541)
|
|
|
|
|
|
|
|
|
(14,080)
|
|
|
|
|
|
|
|
|
(15,876)
|
|
|
|
|
|
|
|
Other Assets
|
|
276,315
|
|
|
|
|
|
|
|
|
286,550
|
|
|
|
|
|
|
|
|
302,144
|
|
|
|
|
|
|
|
TOTAL ASSETS
|
$
|
2,816,096
|
|
|
|
|
|
|
|
$
|
2,752,309
|
|
|
|
|
|
|
|
$
|
2,659,317
|
|
|
|
|
|
|
|
|
|
|
|
|
|
|
|
|
|
|
|
|
|
|
|
|
|
|
|
|
|
|
|
|
|
|
|
LIABILITIES
|
|
|
|
|
|
|
|
|
|
|
|
|
|
|
|
|
|
|
|
|
|
|
|
|
|
|
|
NOW Accounts
|
$
|
805,861
|
|
$
|
1,094
|
|
0.14
|
%
|
|
$
|
779,764
|
|
$
|
292
|
|
0.04
|
%
|
|
$
|
747,297
|
|
$
|
254
|
|
0.03
|
%
|
|
Money Market Accounts
|
|
258,304
|
|
|
252
|
|
0.10
|
|
|
|
256,265
|
|
|
120
|
|
0.05
|
|
|
|
257,920
|
|
|
134
|
|
0.05
|
|
|
Savings Accounts
|
|
323,928
|
|
|
159
|
|
0.05
|
|
|
|
292,326
|
|
|
144
|
|
0.05
|
|
|
|
255,397
|
|
|
126
|
|
0.05
|
|
|
Time Deposits
|
|
151,301
|
|
|
284
|
|
0.19
|
|
|
|
168,741
|
|
|
323
|
|
0.19
|
|
|
|
186,944
|
|
|
430
|
|
0.23
|
|
|
Total Interest Bearing Deposits
|
|
1,539,394
|
|
|
1,789
|
|
0.12
|
%
|
|
|
1,497,096
|
|
|
879
|
|
0.06
|
%
|
|
|
1,447,558
|
|
|
944
|
|
0.07
|
%
|
|
Short-Term Borrowings
|
|
9,927
|
|
|
82
|
|
0.82
|
|
|
|
36,762
|
|
|
148
|
|
0.40
|
|
|
|
58,481
|
|
|
59
|
|
0.10
|
|
|
Subordinated Notes Payable
|
|
52,887
|
|
|
1,634
|
|
3.05
|
|
|
|
55,729
|
|
|
1,434
|
|
2.53
|
|
|
|
62,887
|
|
|
1,368
|
|
2.14
|
|
|
Other Long-Term Borrowings
|
|
15,174
|
|
|
443
|
|
2.92
|
|
|
|
23,880
|
|
|
728
|
|
3.05
|
|
|
|
29,698
|
|
|
936
|
|
3.15
|
|
|
Total Interest Bearing Liabilities
|
|
1,617,382
|
|
|
3,948
|
|
0.25
|
%
|
|
|
1,613,467
|
|
|
3,189
|
|
0.20
|
%
|
|
|
1,598,624
|
|
|
3,307
|
|
0.21
|
%
|
|
Noninterest Bearing Deposits
|
|
832,477
|
|
|
|
|
|
|
|
|
785,689
|
|
|
|
|
|
|
|
|
715,883
|
|
|
|
|
|
|
|
Other Liabilities
|
|
82,833
|
|
|
|
|
|
|
|
|
74,818
|
|
|
|
|
|
|
|
|
69,666
|
|
|
|
|
|
|
|
TOTAL LIABILITIES
|
|
2,532,692
|
|
|
|
|
|
|
|
|
2,473,974
|
|
|
|
|
|
|
|
|
2,384,173
|
|
|
|
|
|
|
|
|
|
|
|
|
|
|
|
|
|
|
|
|
|
|
|
|
|
|
|
|
|
|
|
|
|
|
|
SHAREOWNERS’ EQUITY
|
|
|
|
|
|
|
|
|
|
|
|
|
|
|
|
|
|
|
|
|
|
|
|
|
|
|
|
TOTAL SHAREOWNERS’ EQUITY
|
|
283,404
|
|
|
|
|
|
|
|
|
278,335
|
|
|
|
|
|
|
|
|
275,144
|
|
|
|
|
|
|
|
|
|
|
|
|
|
|
|
|
|
|
|
|
|
|
|
|
|
|
|
|
|
|
|
|
|
|
|
TOTAL LIABILITIES & EQUITY
|
$
|
2,816,096
|
|
|
|
|
|
|
|
$
|
2,752,309
|
|
|
|
|
|
|
|
$
|
2,659,317
|
|
|
|
|
|
|
|
|
|
|
|
|
|
|
|
|
|
|
|
|
|
|
|
|
|
|
|
|
|
|
|
|
|
|
|
Interest Rate Spread
|
|
|
|
|
|
|
3.27
|
%
|
|
|
|
|
|
|
|
3.18
|
%
|
|
|
|
|
|
|
|
3.25
|
%
|
|
Net Interest Income
|
|
|
|
$
|
84,208
|
|
|
|
|
|
|
|
$
|
78,976
|
|
|
|
|
|
|
|
$
|
76,989
|
|
|
|
|
Net Interest Margin(3)
|
|
|
|
|
|
|
3.37
|
%
|
|
|
|
|
|
|
|
3.25
|
%
|
|
|
|
|
|
|
|
3.31
|
%
|
|
|
|
|
|
|
|
|
|
|
|
|
|
|
|
|
|
|
|
|
|
|
|
|
|
|
|
|
|
(1) Average balances include nonaccrual
loans. Interest income includes loan fees of $0.7 million for
2017, $0.8 million for 2016, and $1.4 million for 2015.
|
|
|
(2) Interest income includes the effects of
taxable equivalent adjustments using a 35% tax rate.
|
|
|
|
|
|
|
|
|
|
|
|
(3) Taxable equivalent net interest income
divided by average earning assets.
|
|
|
|
|
|
|
|
|
|
|
|
Table 3
|
|
|
|
|
|
|
|
|
|
|
|
|
|
|
|
|
|
|
|
|
|
|
|
RATE/VOLUME ANALYSIS(1)
|
|
|
|
|
|
|
|
|
|
|
|
|
|
|
|
|
|
|
|
|
|
|
|
|
|
|
|
|
|
|
|
|
|
|
|
|
|
|
|
|
|
|
|
|
|
|
|
|
|
|
2017 vs. 2016
|
|
2016 vs. 2015
|
|
(Taxable Equivalent Basis -
Dollars in Thousands)
|
Increase (Decrease) Due
to Change In
|
|
Increase (Decrease) Due
to Change In
|
|
Total
|
|
Calendar(3)
|
|
Volume
|
|
Rate
|
|
Total
|
|
Calendar(3)
|
Volume
|
|
Rate
|
|
Earnings Assets:
|
|
|
|
|
|
|
|
|
|
|
|
|
|
|
|
|
|
|
|
|
|
|
|
Loans, Net of Unearned Interest(2)
|
$
|
2,968
|
|
$
|
(201)
|
|
$
|
3,836
|
|
$
|
(667)
|
|
$
|
(19)
|
|
$
|
201
|
$
|
3,155
|
|
$
|
(3,375)
|
|
Investment Securities:
|
|
|
|
|
|
|
|
|
|
|
|
|
|
|
|
|
|
|
|
|
|
|
|
Taxable
|
|
1,778
|
|
|
(14)
|
|
|
119
|
|
|
1,673
|
|
|
1,094
|
|
|
14
|
|
537
|
|
|
543
|
|
Tax-Exempt(2)
|
|
283
|
|
|
(3)
|
|
|
103
|
|
|
183
|
|
|
322
|
|
|
3
|
|
111
|
|
|
208
|
|
Funds Sold
|
|
962
|
|
|
(2)
|
|
|
(115)
|
|
|
1,079
|
|
|
472
|
|
|
2
|
|
(69)
|
|
|
539
|
|
Total
|
|
5,991
|
|
|
(220)
|
|
|
3,943
|
|
|
2,268
|
|
|
1,869
|
|
|
220
|
|
3,734
|
|
|
(2,085)
|
|
|
|
|
|
|
|
|
|
|
|
|
|
|
|
|
|
|
|
|
|
|
|
|
|
Interest Bearing Liabilities:
|
|
|
|
|
|
|
|
|
|
|
|
|
|
|
|
|
|
|
|
|
|
|
|
NOW Accounts
|
|
802
|
|
|
(1)
|
|
|
11
|
|
|
792
|
|
|
38
|
|
|
1
|
|
10
|
|
|
27
|
|
Money Market Accounts
|
|
132
|
|
|
-
|
|
|
1
|
|
|
131
|
|
|
(14)
|
|
|
-
|
|
(1)
|
|
|
(13)
|
|
Savings Accounts
|
|
15
|
|
|
-
|
|
|
16
|
|
|
(1)
|
|
|
18
|
|
|
-
|
|
18
|
|
|
-
|
|
Time Deposits
|
|
(39)
|
|
|
(1)
|
|
|
(32)
|
|
|
(6)
|
|
|
(107)
|
|
|
1
|
|
(43)
|
|
|
(65)
|
|
Short-Term Borrowings
|
|
(66)
|
|
|
-
|
|
|
(108)
|
|
|
42
|
|
|
89
|
|
|
-
|
|
(22)
|
|
|
111
|
|
Subordinated Notes Payable
|
|
200
|
|
|
(4)
|
|
|
(69)
|
|
|
273
|
|
|
66
|
|
|
4
|
|
(160)
|
|
|
222
|
|
Other Long-Term Borrowings
|
|
(285)
|
|
|
(3)
|
|
|
(262)
|
|
|
(20)
|
|
|
(208)
|
|
|
3
|
|
(186)
|
|
|
(25)
|
|
Total
|
|
759
|
|
|
(9)
|
|
|
(443)
|
|
|
1,211
|
|
|
(118)
|
|
|
9
|
|
(384)
|
|
|
257
|
|
|
|
|
|
|
|
|
|
|
|
|
|
|
|
|
|
|
|
|
|
|
|
|
|
Changes in Net Interest Income
|
$
|
5,232
|
|
$
|
(211)
|
|
$
|
4,386
|
|
$
|
1,057
|
|
$
|
1,987
|
|
$
|
211
|
$
|
4,118
|
|
$
|
(2,342)
|
|
|
|
|
|
|
|
|
|
|
|
|
|
|
|
|
|
|
|
|
|
|
|
|
|
|
(1)
|
This table shows the change in taxable equivalent net
interest income for comparative periods based on either changes in
|
|
|
average volume or changes in average rates for interest
earning assets and interest-bearing liabilities. Changes which are
|
|
|
not solely due to volume changes or solely due to rate
changes have been attributed to rate changes.
|
|
|
|
|
|
|
|
|
|
|
|
|
|
|
|
|
|
|
|
|
|
|
|
|
|
|
(2)
|
Interest income includes the effects of taxable
equivalent adjustments using a 35% tax rate to adjust interest on tax-exempt
|
|
|
loans and securities to a taxable equivalent basis.
|
|
|
|
|
|
|
|
|
|
|
|
|
|
|
|
|
|
|
|
|
|
|
|
|
|
|
(3)
|
Reflects change due to one extra calendar day in 2016.
|
Provision for Loan Losses
The provision for loan loss was $2.2
million for 2017 compared to $0.8 million for 2016 and $1.6 million in 2015.
The increase in 2017 reflected higher net loan charge-offs and growth in the
loan portfolio. The decrease in 2016 reflected
favorable problem loan migration and lower net loan losses which were partially
offset by growth in the loan portfolio. We discuss these trends in further
detail below under Risk Element Assets and Allowance for Loan Losses.
Noninterest Income
For 2017, noninterest income totaled $51.7 million, a decrease of
$1.9 million, or 3.6%, from 2016 attributable to lower other income of $2.7
million and deposit fees of $1.0 million, partially offset by higher wealth
management fees of $1.2 million and mortgage banking fees of $0.6 million. The
decrease in other income was attributable to a $2.5 million gain from the
partial retirement of our trust preferred securities in the second quarter of
2016. Lower fees related to data processing services provided to third parties
also contributed to the decrease and reflected the discontinuance of this line
of business over the past two years with our last client discontinuing service
in the fourth quarter of 2017. The reduction in deposit fees reflected lower
utilization of our overdraft service product. Growth in assets under management
as well as improved sales efforts have resulted in strong growth in wealth
management fees. Strong home sales in our markets and a growing market share
of residential loan production have driven the improvement in mortgage banking
fees.
For 2016, the $0.4 million, or 0.8%, decrease from 2015 was
primarily attributable to lower deposit fees of $1.3 million and wealth
management fees of $0.5 million, partially offset by higher other income of
$0.8 million and mortgage banking fees of $0.6 million. The decrease in
deposit fees reflected lower utilization of our overdraft service product. The
reduction in wealth management fees generally reflected lower trading volume by
our retail brokerage clients. The favorable variance in other income primarily
reflected a $2.5 million gain from the partial retirement of our TRUPs in 2016,
partially offset by higher BOLI income of $1.7 million in 2015. Strong home
sales in our markets and further expansion into the Gainesville, Florida market
drove the improvement in mortgage banking fees.
Noninterest income as a
percent of total operating revenues (net interest income plus noninterest
income) was 38.41% in 2017, 40.78% in 2016, and 41.47% in 2015. The decline in
this metric over the last three years is partially attributable to growth in
net interest income as a component of operating revenues.
The table below reflects the major components
of noninterest income.
|
(Dollars in Thousands)
|
2017
|
|
2016
|
|
2015
|
|
Deposit Fees
|
$
|
20,335
|
|
$
|
21,332
|
|
$
|
22,608
|
|
Bank Card Fees
|
|
11,191
|
|
|
11,221
|
|
|
11,278
|
|
Wealth Management Fees
|
|
8,284
|
|
|
7,029
|
|
|
7,533
|
|
Mortgage Banking Fees
|
|
5,754
|
|
|
5,192
|
|
|
4,539
|
|
Other
|
|
6,182
|
|
|
8,907
|
|
|
8,133
|
|
Total Noninterest Income
|
$
|
51,746
|
|
$
|
53,681
|
|
$
|
54,091
|
Various significant components of
noninterest income are discussed in more detail below.
Deposit Fees. For 2017, deposit fees (service charge fees,
insufficient fund/overdraft fees (“NSF/OD”), and business account analysis
fees) totaled $20.3 million compared to $21.3 million in 2016 and $22.6 million
in 2015. The $1.0 million, or 4.7%, decrease in 2017 and the $1.3 million, or
5.6% decrease in 2016, were due to a lower level of NSF/OD fees attributable to a reduction in the
number of accounts using our overdraft protection service and lower utilization
by existing users reflecting improved financial management by our clients.
Bank Card Fees. Bank card fees totaled $11.2 million in 2017
compared to $11.2 million in 2016 and $11.3 million in 2015. This revenue
stream has been impacted by the continuing trend of debit card accepting
merchants steering card transactions to the lowest cost card processor, thus
reducing our interchange share. We have made progress in stabilizing bank card
revenues over the past three years and continue to evaluate and execute on
initiatives aimed at growing both debit card and credit card interchange
revenues.
Wealth Management Fees. Wealth management fees including both trust fees (i.e., managed
accounts and trusts/estates) and retail brokerage fees (i.e., investment,
insurance products, and retirement accounts) totaled $8.3 million in 2017
compared to $7.0 million in 2016 and $7.5 million in 2015. The $1.3 million,
or 17.9%, increase in 2017 reflected growth in assets under management attributable to both higher
account valuations upon which fees are based and new account growth. The $0.5 million, or 6.7%, decrease in
2016 reflected lower transaction activity by our retail brokerage clients. At
December 31, 2017, total assets under management were approximately $1.418
billion compared to $1.192 billion at December 31, 2016 and $1.139 billion at
December 31, 2015.
Mortgage Banking Fees. Mortgage banking fees
totaled $5.8 million in 2017 compared to $5.2 million in 2016 and $4.5 million
in 2015. The increases in both 2017 and 2016 reflected strong home sales in our markets and a
growing market share of residential loan production. Refinancing activity represented 11% of
our loan production in 2017 compared to 20% and 18% for 2016 and 2015,
respectively. Market conditions, housing activity,
the level of interest rates and the mix of our fixed-rate and variable rate
production have significant impacts on our mortgage banking fees.
Other. Other noninterest income
totaled $6.2 million in 2017 compared to $8.9 million in 2016 and $8.1 million
in 2015. The decrease in 2017 was attributable to a $2.5 million gain from the partial retirement of
our trust preferred securities in the second quarter of 2016. Lower fees
related to data processing services provided to third parties also contributed
to the decrease and reflected the discontinuance of this line of business over
the past two years with our last client discontinuing service in the fourth
quarter of 2017. The
increase in 2016 reflected a $2.5
million gain from the partial retirement of our trust preferred securities,
partially offset by higher BOLI income of $1.7 million in 2015.
Noninterest Expense
For 2017, noninterest expense totaled $109.4 million, a decrease
of $3.8 million, or 3.3%, from 2016 attributable to lower other expense of $3.2
million (primarily OREO of $2.5 million, legal of $0.4 million, and FDIC
insurance of $0.4 million), occupancy expense of $0.5 million, and compensation
expense of $0.1 million. All OREO expense categories (gain/loss on sale,
carrying costs, and valuation adjustments) declined as we continued efforts to
liquidate our remaining properties. Legal and FDIC insurance expense declined
as expected as these categories return closer to historical norm,
post-recession. The decrease in occupancy expense reflected our continuing
efforts to optimize our banking office structure and operational processes.
The decrease in compensation expense reflected lower salary expense of $1.2
million, partially offset by higher associate benefit expense of $1.1 million.
For 2016, the $2.1 million, or 1.8%, decrease from 2015 reflected
lower other expense of $2.2 million (primarily OREO of $1.3 million and FDIC
insurance of $0.7 million) and compensation expense of $0.4 million, partially
offset by higher occupancy expense of $0.5 million. Lower carrying costs drove
the reduction in OREO expense. The reduction in FDIC insurance expense
reflected improvement in our insurance premium. The decrease in compensation
reflected a higher level of deferred loan cost (which reduces salary expense),
partially offset by higher associate benefit expense, primarily stock
compensation expense. The increase in occupancy expense was primarily due to
higher depreciation expense reflective of technology investments in our banking
offices and security infrastructure, and to a lesser extent higher maintenance
costs for building and furniture/equipment.
Our operating efficiency ratio (expressed as
noninterest expense as a percent of taxable equivalent net interest income plus
noninterest income) was 80.50%, 85.34% and 87.94% in 2017, 2016 and 2015,
respectively. Improved operating leverage reflective of growth in net interest
income as well as lower operating expenses has driven the improvement for all
respective years.
Expense management is an important part of our culture and
strategic focus and we will continue to review and evaluate opportunities to
optimize our operations, reduce operating costs and manage our discretionary
expenses.
The table below reflects the major components of noninterest
expense.
|
(Dollars in Thousands)
|
2017
|
|
2016
|
|
2015
|
|
Salaries
|
$
|
46,421
|
|
$
|
47,610
|
|
$
|
48,263
|
|
Associate Benefits
|
|
18,456
|
|
|
17,374
|
|
|
17,151
|
|
Total Compensation
|
|
64,877
|
|
|
64,984
|
|
|
65,414
|
|
|
|
|
|
|
|
|
|
|
|
Premises
|
|
8,790
|
|
|
9,047
|
|
|
9,015
|
|
Equipment
|
|
9,047
|
|
|
9,249
|
|
|
8,723
|
|
Total Occupancy
|
|
17,837
|
|
|
18,296
|
|
|
17,738
|
|
|
|
|
|
|
|
|
|
|
|
Legal Fees
|
|
1,933
|
|
|
2,311
|
|
|
2,506
|
|
Professional Fees
|
|
3,689
|
|
|
3,424
|
|
|
3,788
|
|
Processing Services
|
|
6,253
|
|
|
6,471
|
|
|
6,540
|
|
Advertising
|
|
1,731
|
|
|
1,702
|
|
|
1,391
|
|
Travel and Entertainment
|
|
868
|
|
|
889
|
|
|
901
|
|
Printing and Supplies
|
|
631
|
|
|
710
|
|
|
825
|
|
Telephone
|
|
2,405
|
|
|
2,296
|
|
|
1,976
|
|
Postage
|
|
764
|
|
|
891
|
|
|
996
|
|
Insurance – Other
|
|
1,626
|
|
|
2,060
|
|
|
2,737
|
|
Other Real Estate, Net
|
|
1,135
|
|
|
3,649
|
|
|
4,971
|
|
Miscellaneous
|
|
5,698
|
|
|
5,531
|
|
|
5,490
|
|
Total Other Expense
|
|
26,733
|
|
|
29,934
|
|
|
32,121
|
|
|
|
|
|
|
|
|
|
|
|
Total Noninterest Expense
|
$
|
109,447
|
|
$
|
113,214
|
|
$
|
115,273
|
Various significant components of noninterest expense are discussed in
more detail below.
Compensation. Compensation expense totaled $64.9 million in 2017,
$65.0 million in 2016, and $65.4 million in 2015. For 2017, the $0.1 million,
or 0.2%, decrease from 2016 reflected lower salary expense of $1.2 million partially offset by higher
associate benefit expense of $1.1 million. Continued headcount attrition drove
the decline in salary expense and the increase in associate benefit expense
reflected higher pension plan expense attributable to utilization of a lower
discount rate for plan liabilities and to a lesser extent higher associate
insurance expense and stock compensation expense.
For 2016, the $0.4 million, or
0.7%, decrease from 2015 was attributable to lower salary expense of $0.6
million, partially offset by higher associate benefit expense of $0.2 million. The decrease in salary
expense was attributable to higher deferred loan cost amortization (which is
accounted for as a credit offset to salary expense). The increase in associate
benefit expense was primarily due to higher stock compensation expense tied to
financial performance which improved in 2016.
Occupancy. Occupancy expense (including premises and
equipment) totaled $17.8 million for 2017, $18.3 million for 2016, and $17.7
million for 2015. For 2017, the $0.5 million, or 2.5%, decrease from 2016 generally reflected our continuing efforts
to optimize our banking office structure and operational processes. For 2016, the $0.6 million, or
3.1%, increase was primarily
due to higher depreciation expense related to technology investments in our
banking offices and security infrastructure, and to a lesser extent higher
maintenance costs for building and furniture/equipment.
Other. Other noninterest expense totaled $26.7 million in
2017, $29.9 million in 2016, and $32.1 million in 2015. For 2017, the $3.2
million, or 10.7%, decrease
was primarily attributable to lower OREO expense of $2.5 million, FDIC
insurance fees of $0.4 million, and legal fees of $0.4 million. Lower
valuation adjustments of $1.0 million, and net gains from the sale of
properties of $1.4 million (higher gains of $0.6 million and lower losses of
$0.8 million) drove the reduction in OREO expense. The reduction in FDIC
insurance reflected further reduction in our premium which we do not expect
will decline further going forward. Legal expense declined due to a lower level
of support needed for problem loan resolutions.
For 2016, the decrease was primarily attributable to lower OREO expense of $1.3
million, FDIC insurance fees of $0.7 million, legal fees of $0.2 million, and
professional fees of $0.4 million, partially offset by higher telephone expense
of $0.3 million and advertising expense of $0.3 million. Lower property
carrying costs drove the reduction in OREO expense. The reduction in FDIC
insurance fees was attributable to the revision of the FDIC fee structure in
the third quarter of 2016. The decrease in professional fees reflected a lower
level of consulting and other professional fees. Legal fees declined due to a
lower level of legal support needed for problem loan resolutions. The increase
in telephone expense was attributable to the implementation of a new telephone
system during 2016 and the need to run dual circuits for a period of time while the system was phased
in. An increased level of product advertising drove the increase in
advertising expense.
Income Taxes
For 2017, we realized income tax expense of $12.2 million (53%
effective rate) compared to $5.9 million (33% effective rate) for 2016 and $4.5
million (33% effective rate) for 2015. Income tax expense for 2017 included a
$0.3 million write-off of a deferred tax asset related to a cancelled stock
award as well as income tax benefits of $0.2 million related to stock-based
compensation awards.
On December 22,
2017, H.R.1, commonly known as the Tax Cuts and Jobs Act (the “Tax Act”) was
signed into law. Among other things, the Tax Act reduces our corporate tax
rate from 35% to 21% effective January 1, 2018. As a result, we are required
to re-measure, through income tax expense, our deferred tax assets and
liabilities using the enacted rate at which we expect them to be recovered or
settled. The recorded provisional adjustment in the amount of $4.1 million in
the fourth quarter of 2017 reflected the re-measurement of our deferred tax
inventory. Excluding this discrete item, our effective tax rate was 36% for
2017.
Absent future discrete events, we anticipate that our effective
tax will approximate 24% due to a lower federal tax rate related to the Tax
Act.
FINANCIAL CONDITION
Average assets totaled approximately $2.816 billion for the year
2017, an increase of $63.8 million, or 2.3%, over 2016. Average
earning assets were approximately $2.502 billion for the year 2017, an increase
of $69.8 million, or 2.9% over 2016. Year-over-year, average
overnight funds decreased $22.8 million, while investment securities increased
$16.3 million and average gross loans were higher by $76.4
million. We discuss these variances in more detail below.
Table 2 provides information on average
balances and rates, Table 3 provides an analysis of rate and volume variances
and Table 4 highlights the changing mix of our interest earning assets over the
last three years.
Loans
In 2017, average loans increased $76.4 million, or 5.0%, compared
to an increase of $67.4 million, or 4.6%, in 2016. Loans as a percentage of
average earning assets increased to 64.7% in 2017 compared to 63.4% in 2016 and
2015. Year-over-year average balances in the loan portfolio experienced
increases in all loan categories except home equity loans. A portion of the
increase compared to the prior year was due to strategic loan purchases of
approximately $26.8 million in adjustable residential real estate loans and
$16.4 million in fixed and adjustable rate commercial real estate loans.
We continue to make minor modifications on some of our lending
programs to try and mitigate the impact that consumer and business deleveraging
has had on our portfolio. These programs, coupled with economic improvements
in our anchor markets and strategic loan purchases, have helped to increase
overall loan growth.
We originate mortgage loans secured by 1-4 family residential
properties through our Residential Real Estate line of business, a majority of
which are fixed-rate loans that are sold into the secondary market to third
party purchasers on a best efforts delivery basis with servicing released. A
majority of our adjustable rate loans are retained in our loan portfolio.
|
Table 4
|
|
|
|
|
|
|
|
|
|
|
|
|
|
|
|
|
SOURCES OF EARNING ASSET GROWTH
|
|
|
|
|
|
|
|
|
|
|
|
|
|
|
|
|
|
|
|
|
|
|
|
|
|
|
|
|
|
|
|
|
|
|
|
2016 to
|
|
Percentage
|
|
Components of
|
|
|
|
2017
|
|
Total
|
|
Average Earning Assets
|
|
(Average Balances – Dollars In Thousands)
|
|
Change
|
|
Change
|
|
2017
|
|
2016
|
|
2015
|
|
Loans:
|
|
|
|
|
|
|
|
|
|
|
|
|
|
|
|
|
Commercial, Financial, and Agricultural
|
|
$
|
12,055
|
|
17.0
|
%
|
|
8.8
|
%
|
|
8.5
|
%
|
|
6.8
|
%
|
|
Real Estate – Construction
|
|
|
15,719
|
|
23.0
|
|
|
2.6
|
|
|
2.1
|
|
|
2.0
|
|
|
Real Estate – Commercial Mortgage
|
|
|
19,391
|
|
28.0
|
|
|
20.5
|
|
|
20.3
|
|
|
21.7
|
|
|
Real Estate – Residential
|
|
|
14,202
|
|
20.0
|
|
|
12.7
|
|
|
12.5
|
|
|
13.0
|
|
|
Real Estate – Home Equity
|
|
|
(4,286)
|
|
(6.0)
|
|
|
9.2
|
|
|
9.6
|
|
|
9.9
|
|
|
Consumer
|
|
|
19,270
|
|
28.0
|
|
|
10.9
|
|
|
10.4
|
|
|
10.1
|
|
|
Total Loans
|
|
$
|
76,351
|
|
110.0
|
%
|
|
64.7
|
%
|
|
63.4
|
%
|
|
63.5
|
%
|
|
|
|
|
|
|
|
|
|
|
|
|
|
|
|
|
|
|
Investment Securities:
|
|
|
|
|
|
|
|
|
|
|
|
|
|
|
|
|
Taxable
|
|
$
|
9,506
|
|
14.0
|
%
|
|
23.8
|
%
|
|
24.1
|
%
|
|
22.8
|
%
|
|
Tax-Exempt
|
|
|
6,808
|
|
10.0
|
|
|
3.9
|
|
|
3.8
|
|
|
3.5
|
|
|
Total Securities
|
|
|
16,314
|
|
24.0
|
|
|
27.7
|
|
|
27.9
|
|
|
26.3
|
|
|
|
|
|
|
|
|
|
|
|
|
|
|
|
|
|
|
|
Funds Sold
|
|
|
(22,826)
|
|
(34.0)
|
|
|
7.6
|
|
|
8.7
|
|
|
10.2
|
|
|
|
|
|
|
|
|
|
|
|
|
|
|
|
|
|
|
|
Total Earning Assets
|
|
$
|
69,839
|
|
100.0
|
%
|
|
100.0
|
%
|
|
100.0
|
%
|
|
100.0
|
%
|
Our average loan-to-deposit ratio increased to 68.2%
in 2017 from 67.6% in 2016. The higher loan-to-deposit ratio reflects stronger
growth in our average loan balances relative to the growth in average deposit
balances.
The composition of our loan portfolio at December 31st
for each of the past five years is shown in Table 5. Table 6 arrays our total
loan portfolio as of December 31, 2017, by maturity period. As a percentage of
the total portfolio, loans with fixed interest rates represented 37.2% as of
December 31, 2017, compared to 35.7% on December 31, 2016. The higher ratio was
primarily due to increases in fixed rate commercial mortgage and residential
loans, partially offset by a decline in variable rate home equity lines of
credit.
|
Table 5
|
|
|
|
|
|
|
|
|
|
|
|
|
|
|
|
LOANS BY CATEGORY
|
|
|
|
|
|
|
|
|
|
|
|
|
|
|
|
|
|
|
|
|
|
|
|
|
|
|
|
|
|
|
|
(Dollars in Thousands)
|
2017
|
|
2016
|
|
2015
|
|
2014
|
|
2013
|
|
Commercial, Financial and Agricultural
|
$
|
218,166
|
|
$
|
216,404
|
|
$
|
179,816
|
|
$
|
136,925
|
|
$
|
126,607
|
|
Real Estate – Construction(1)
|
|
77,966
|
|
|
59,147
|
|
|
47,402
|
|
|
43,472
|
|
|
36,187
|
|
Real Estate – Commercial Mortgage
|
|
535,707
|
|
|
503,978
|
|
|
499,813
|
|
|
510,120
|
|
|
533,871
|
|
Real Estate – Residential(1)
|
|
316,723
|
|
|
291,691
|
|
|
301,299
|
|
|
304,781
|
|
|
315,582
|
|
Real Estate – Home Equity
|
|
229,513
|
|
|
236,512
|
|
|
233,901
|
|
|
229,572
|
|
|
227,922
|
|
Consumer
|
|
280,234
|
|
|
264,443
|
|
|
241,676
|
|
|
217,192
|
|
|
159,500
|
|
Total Loans, Net of Unearned Income
|
$
|
1,658,309
|
|
$
|
1,572,175
|
|
$
|
1,503,907
|
|
$
|
1,442,062
|
|
$
|
1,399,669
|
|
|
|
|
|
|
|
|
|
|
|
|
|
|
|
|
|
(1) Includes loans held for sale
|
|
|
|
|
|
|
|
|
|
|
|
|
|
|
|
Table 6
|
|
|
|
|
|
|
|
|
|
|
|
|
LOAN MATURITIES
|
|
|
|
|
|
|
|
|
|
|
|
|
|
|
|
|
|
|
|
|
|
|
|
|
|
|
Maturity Periods
|
|
(Dollars in Thousands)
|
One Year
or Less
|
|
Over One Through Five
Years
|
|
Over
Five Years
|
|
Total
|
|
Commercial, Financial and Agricultural
|
$
|
57,022
|
|
$
|
130,437
|
|
$
|
30,708
|
|
$
|
218,167
|
|
Real Estate – Construction
|
|
60,829
|
|
|
4,203
|
|
|
12,934
|
|
|
77,966
|
|
Real Estate – Commercial Mortgage
|
|
46,393
|
|
|
81,353
|
|
|
407,961
|
|
|
535,707
|
|
Real Estate – Residential
|
|
20,631
|
|
|
26,595
|
|
|
269,497
|
|
|
316,723
|
|
Real Estate – Home Equity
|
|
4,445
|
|
|
50,516
|
|
|
174,551
|
|
|
229,512
|
|
Consumer(1)
|
|
11,910
|
|
|
245,760
|
|
|
22,564
|
|
|
280,234
|
|
Total
|
$
|
201,230
|
|
$
|
538,864
|
|
$
|
918,215
|
|
$
|
1,658,309
|
|
|
|
|
|
|
|
|
|
|
|
|
|
|
Loans with Fixed Rates
|
$
|
98,624
|
|
$
|
410,320
|
|
$
|
107,330
|
|
$
|
616,274
|
|
Loans with Floating or Adjustable Rates
|
|
102,606
|
|
|
128,544
|
|
|
810,885
|
|
|
1,042,035
|
|
Total
|
$
|
201,230
|
|
$
|
538,864
|
|
$
|
918,215
|
|
$
|
1,658,309
|
|
|
|
|
|
|
|
|
|
|
|
|
|
|
(1)Demand loans and overdrafts are reported
in the category of one year or less.
|
|
|
|
|
|
|
Risk Element Assets
Risk element assets consist of nonaccrual loans, OREO,
troubled debt restructurings (“TDRs”), past due loans, potential problem loans,
and loan concentrations. Table 7 depicts certain categories of our risk
element assets as of December 31st for each of the last five years.
Activity within our nonperforming asset portfolio is provided below in Table
8.
Nonperforming assets
(nonaccrual loans and OREO) totaled $11.1 million at December 31, 2017 compared
to $19.2 million at December 31, 2016. Nonaccrual loans totaled $7.2 million
at December 31, 2017, a $1.4 million decrease from December 31, 2016.
Nonaccrual loan additions totaled $14.1 million for 2017 compared to $13.1
million for 2016. The balance of OREO totaled $3.9 million at December 31,
2017, a decrease of $6.7 million December 31, 2016. For 2017, we disposed of
properties totaling $7.5 million compared to $10.3 million in 2016.
Nonperforming assets represented 0.38% of total assets at December 31, 2017
compared to 0.67% at December 31, 2016.
|
Table 7
|
|
|
|
|
|
|
|
|
|
|
|
|
|
|
|
|
RISK ELEMENT ASSETS
|
|
|
|
|
|
|
|
|
|
|
|
|
|
|
|
|
|
|
|
|
|
|
|
|
|
|
|
|
|
|
|
|
|
(Dollars in Thousands)
|
2017
|
|
2016
|
|
2015
|
|
2014
|
|
2013
|
|
|
Nonaccruing Loans:
|
|
|
|
|
|
|
|
|
|
|
|
|
|
|
|
|
Commercial, Financial and Agricultural
|
$
|
629
|
|
$
|
468
|
|
$
|
96
|
|
$
|
507
|
|
$
|
188
|
|
|
Real Estate – Construction
|
|
298
|
|
|
311
|
|
|
97
|
|
|
424
|
|
|
426
|
|
|
Real Estate – Commercial Mortgage
|
|
2,370
|
|
|
3,410
|
|
|
4,191
|
|
|
5,806
|
|
|
25,227
|
|
|
Real Estate – Residential
|
|
1,938
|
|
|
2,330
|
|
|
4,739
|
|
|
6,737
|
|
|
6,440
|
|
|
Real Estate – Home Equity
|
|
1,748
|
|
|
1,774
|
|
|
1,017
|
|
|
2,544
|
|
|
4,084
|
|
|
Consumer
|
|
176
|
|
|
240
|
|
|
165
|
|
|
751
|
|
|
599
|
|
|
Total Nonperforming Loans (“NPLs”)(1)
|
$
|
7,159
|
|
$
|
8,533
|
|
$
|
10,305
|
|
$
|
16,769
|
|
$
|
36,964
|
|
|
Other Real Estate Owned
|
|
3,941
|
|
|
10,638
|
|
|
19,290
|
|
|
35,680
|
|
|
48,071
|
|
|
Total Nonperforming Assets (“NPAs”)
|
$
|
11,100
|
|
$
|
19,171
|
|
$
|
29,595
|
|
$
|
52,449
|
|
$
|
85,035
|
|
|
Past Due Loans 30 – 89 Days
|
$
|
4,579
|
|
$
|
6,438
|
|
$
|
5,775
|
|
$
|
6,792
|
|
$
|
7,746
|
|
|
Performing Troubled Debt Restructurings
|
$
|
32,164
|
|
$
|
38,233
|
|
$
|
35,634
|
|
$
|
44,409
|
|
$
|
44,764
|
|
|
|
|
|
|
|
|
|
|
|
|
|
|
|
|
|
|
|
Nonperforming Loans/Loans
|
|
0.43
|
%
|
|
0.54
|
%
|
|
0.69
|
%
|
|
1.16
|
%
|
|
2.64
|
%
|
|
Nonperforming Assets/Total Assets
|
|
0.38
|
|
|
0.67
|
|
|
1.06
|
|
|
2.00
|
|
|
3.26
|
|
|
Nonperforming Assets/Loans Plus OREO
|
|
0.67
|
|
|
1.21
|
|
|
1.94
|
|
|
3.55
|
|
|
5.87
|
|
|
Allowance/Nonperforming Loans
|
|
185.87
|
%
|
|
157.40
|
%
|
|
135.40
|
%
|
|
104.60
|
%
|
|
62.48
|
%
|
|
|
|
|
|
|
|
|
|
|
|
|
|
|
|
|
|
|
(1) Nonaccrual TDRs totaling $2.3 million,
$1.7 million, and $2.7 million are included in nonaccrual/NPL totals for
|
|
|
December 31, 2017, December 31, 2016 and December 31,
2015, respectively.
|
|
|
Table 8
|
|
|
|
|
|
|
NONPERFORMING ASSET ACTIVITY
|
|
|
|
|
|
|
|
|
|
|
|
|
|
(Dollars in Thousands)
|
2017
|
|
2016
|
|
NPA Beginning Balance:
|
$
|
19,171
|
|
$
|
29,595
|
|
Change in Nonaccrual Loans:
|
|
|
|
|
|
|
Beginning Balance
|
|
8,533
|
|
|
10,305
|
|
Additions
|
|
14,122
|
|
|
13,065
|
|
Charge-Offs
|
|
(2,912)
|
|
|
(2,783)
|
|
Transferred to OREO
|
|
(1,402)
|
|
|
(3,718)
|
|
Paid Off/Payments
|
|
(4,440)
|
|
|
(3,153)
|
|
Restored to Accrual
|
|
(6,742)
|
|
|
(5,183)
|
|
Ending Balance
|
|
7,159
|
|
|
8,533
|
|
|
|
|
|
|
|
|
Change in OREO:
|
|
|
|
|
|
|
Beginning Balance
|
|
10,638
|
|
|
19,290
|
|
Additions(1)
|
|
2,384
|
|
|
4,016
|
|
Valuation Write-downs
|
|
(1,318)
|
|
|
(2,363)
|
|
Sales
|
|
(7,496)
|
|
|
(10,305)
|
|
Other
|
|
(267)
|
|
|
-
|
|
Ending Balance
|
|
3,941
|
|
|
10,638
|
|
|
|
|
|
|
|
|
NPA Net Change
|
|
(8,071)
|
|
|
(10,424)
|
|
NPA Ending Balance
|
$
|
11,100
|
|
$
|
19,171
|
|
|
|
|
|
|
|
|
(1) The difference in OREO additions and
nonaccrual loans transferred to OREO represents loans migrating to OREO
status
|
|
that were not in a nonaccrual status in prior
period.
|
|
|
|
|
|
Nonaccrual Loans. Nonaccrual loans totaled $7.2 million at
December 31, 2017, a decrease of $1.4 million from December 31, 2016. Gross
additions to nonaccrual status during 2017 totaled $14.1 million compared to
$13.1 million in 2016. The commercial real estate and residential real estate
categories realized the largest declines.
Generally, loans are placed on nonaccrual status if
principal or interest payments become 90 days past due or management deems the
collectability of the principal and interest to be doubtful. Once a loan is
placed in nonaccrual status, all previously accrued and uncollected interest is
reversed against interest income. Interest income on nonaccrual loans is
recognized when the ultimate collectability is no longer considered doubtful.
Loans are returned to accrual status when the principal and interest amounts
contractually due are brought current or when future payments are reasonably
assured. If interest on our loans classified as nonaccrual during 2017 had
been recognized on a fully accruing basis, we would have recorded an additional
$0.5 million of interest income for the year ended December 31, 2017.
Other Real Estate Owned. OREO represents property
acquired as the result of borrower defaults on loans or by receiving a deed in
lieu of foreclosure. OREO is recorded at the lower of cost or estimated fair
value, less estimated selling costs, at the time of foreclosure. Write-downs
occurring at foreclosure are charged against the allowance for loan losses. On
an ongoing basis, properties are either revalued internally or by a third party
appraiser as required by applicable regulations. Subsequent declines in value
are reflected as other noninterest expense. Carrying costs related to
maintaining the OREO properties are expensed as incurred and are also reflected
as other noninterest expense.
OREO totaled $3.9 million at December 31, 2017 versus
$10.6 million at December 31, 2016. During 2017, we added properties totaling $2.4 million, sold properties
totaling $7.5 million, recorded valuation adjustments totaling $1.3 million,
and miscellaneous adjustments totaling $0.3 million. For 2016, we added
properties totaling $4.0 million and partially or completely liquidated
properties totaling $10.3 million. Revaluation adjustments for OREO properties
during 2016 totaled $2.4 million and were charged to noninterest expense when realized.
The composition of our OREO portfolio as of December 31 is
provided in the table below.
|
(Dollars in Thousands)
|
2017
|
|
2016
|
|
Lots/Land
|
$
|
2,435
|
|
$
|
7,052
|
|
Residential 1-4
|
|
187
|
|
|
1,035
|
|
Commercial Building
|
|
450
|
|
|
1,551
|
|
Other
|
|
869
|
|
|
1,000
|
|
Total OREO
|
$
|
3,941
|
|
$
|
10,638
|
Troubled Debt Restructurings. TDRs are loans on which, due
to the deterioration in the borrower’s financial condition, the original terms
have been modified and deemed a concession to the borrower. From time to time
we will modify a loan as a workout alternative. Most of these instances
involve an extension of the loan term, an interest rate reduction, or a
principal moratorium. A TDR classification can be removed if the borrower’s
financial condition improves such that the borrower is no longer in financial
difficulty, the loan has not had any forgiveness of principal or interest, and
the loan is subsequently refinanced or restructured at market terms and
qualifies as a new loan.
Loans classified as TDRs at December 31, 2017 totaled
$34.5 million compared to $40.0 million at December 31, 2016. Accruing TDRs
made up approximately $32.2 million, or 93%, of our TDR portfolio at December
31, 2017 of which $0.9 million was over 30 days past due. The weighted average
rate for the loans within the accruing TDR portfolio was 5.2%. During 2017, we
modified 9 loan contracts totaling approximately $0.6 million. Our TDR default
rate (default balance as a percentage of average TDRs) in 2016 and 2017 was 4%
and 7%, respectively.
|
The composition of our TDR portfolio as
of December 31 is provided in the table below.
|
|
|
|
|
|
|
|
|
|
|
|
|
|
|
|
|
|
|
2017
|
|
2016
|
|
(Dollars in Thousands)
|
Accruing
|
|
Nonaccruing(1)
|
|
Accruing
|
|
Nonaccruing(1)
|
|
Commercial, Financial and Agricultural
|
$
|
822
|
|
$
|
-
|
|
$
|
772
|
|
$
|
40
|
|
Real Estate – Construction
|
|
64
|
|
|
-
|
|
|
-
|
|
|
-
|
|
Real Estate – Commercial Mortgage
|
|
17,058
|
|
|
1,636
|
|
|
20,673
|
|
|
1,259
|
|
Real Estate – Residential
|
|
11,666
|
|
|
503
|
|
|
13,969
|
|
|
444
|
|
Real Estate – Home Equity
|
|
2,441
|
|
|
186
|
|
|
2,647
|
|
|
-
|
|
Consumer
|
|
113
|
|
|
-
|
|
|
172
|
|
|
-
|
|
Total TDRs
|
$
|
32,164
|
|
$
|
2,325
|
|
$
|
38,233
|
|
$
|
1,743
|
|
|
|
|
|
|
|
|
|
|
|
|
|
|
(1) Nonaccruing TDRs are included in
nonaccrual/NPL totals and NPA/NPL ratio calculations.
|
|
|
|
|
Activity within our TDR portfolio is provided in the table
below.
|
|
|
|
|
|
|
|
|
|
|
|
|
|
(Dollars in Thousands)
|
2017
|
|
2016
|
|
TDR Beginning Balance:
|
$
|
39,976
|
|
$
|
38,321
|
|
Additions
|
|
643
|
|
|
5,808
|
|
Charge-Offs
|
|
(529)
|
|
|
(64)
|
|
Paid Off/Payments
|
|
(5,476)
|
|
|
(2,735)
|
|
Removal Due to Change in TDR Status
|
|
-
|
|
|
(710)
|
|
Transferred to OREO
|
|
(125)
|
|
|
(644)
|
|
TDR Ending Balance
|
$
|
34,489
|
|
$
|
39,976
|
Past Due Loans. A
loan is defined as a past due loan when one full payment is past due or a
contractual maturity is over 30 days past due. Past due loans at December 31,
2017 totaled $4.6 million compared to $6.4 million at December 31, 2016.
Potential Problem Loans. Potential problem loans are
defined as those loans which are now current but where management has doubt as
to the borrower’s ability to comply with present loan repayment terms. At
December 31, 2017, we had $1.9 million
in loans of this type which are not included in either of the nonaccrual, TDR
or 90 day past due loan categories compared to $2.0 million at December 31,
2016. Management monitors these loans closely and reviews their performance on
a regular basis.
Loan Concentrations. Loan concentrations exist when there are
amounts loaned to multiple borrowers engaged in similar activities which cause
them to be similarly impacted by economic or other conditions and such amount
exceeds 10% of total loans. Due to the lack of diversified industry within the
markets served by the Bank and the relatively close proximity of the markets,
we have both geographic concentrations as well as concentrations in the types
of loans funded. Specifically, due to the nature of our markets, a significant
portion of the loan portfolio has historically been secured with real estate,
approximately 70% at December 31, 2017 and 69% at December 31, 2016. The
primary types of real estate collateral are commercial properties and 1-4
family residential properties. At December 31, 2017, commercial real estate
and residential real estate mortgage loans (including home equity loans)
accounted for 32.3% and 32.9%, respectively, of the total loan portfolio.
The following table summarizes our real estate loan
portfolio as segregated by the type of property. Property type concentrations
are stated as a percentage of December 31st total real estate loans.
|
|
2017
|
|
|
2016
|
|
|
|
Investor Real Estate
|
|
|
Owner Occupied
Real Estate
|
|
|
Investor Real Estate
|
|
|
Owner Occupied
Real Estate
|
|
|
Vacant Land, Construction, and Land Development
|
11.2
|
%
|
|
-
|
|
|
10.7
|
%
|
|
-
|
|
|
Improved Property
|
23.6
|
|
|
65.2
|
%
|
|
22.2
|
|
|
67.1
|
%
|
|
Total Real Estate Loans
|
34.8
|
%
|
|
65.2
|
%
|
|
32.9
|
%
|
|
67.1
|
%
|
A major portion of our real estate loan portfolio is
centered in the owner occupied category which carries a lower risk of
non-collection than certain segments of the investor category. Approximately
68% of the land/construction category was secured by residential real estate at
December 31, 2017.
Allowance for Loan Losses
Management believes it maintains the allowance for
loan losses at a level sufficient to provide for probable credit losses
inherent in the loan portfolio as of the balance sheet date. Credit losses
arise from the borrowers’ inability or unwillingness to repay, and from other
risks inherent in the lending process including collateral risk, operations
risk, concentration risk, and economic risk. As such, all related risks of
lending are considered when assessing the adequacy of the allowance. The
allowance for loan losses is established through a provision charged to
expense. Loans are charged-off against the allowance when losses are probable
and reasonably quantifiable. The allowance for loan losses is based on
management's judgment of overall credit quality. This is a significant
estimate based on a detailed analysis of the loan portfolio. The balance can
and will change based on revisions to our assessment of the loan portfolio's
overall credit quality and other risk factors both internal and external to us.
Management evaluates the adequacy of the allowance for
loan losses on a quarterly basis. The allowance consists of two components.
The first component consists of amounts reserved for impaired loans. A loan is
deemed impaired when, based on current information and events, it is probable
that the bank will not be able to collect all amounts due (principal and
interest payments), according to the contractual terms of the loan agreement.
Loans are monitored for potential impairment through our ongoing loan review
procedures and portfolio analysis. Classified loans and past due loans over a
specific dollar amount, and all troubled debt restructurings are individually
evaluated for impairment.
The approach for assigning reserves for the impaired
loans is determined by the dollar amount of the loan and loan type. Impairment
measurement for loans over a specific dollar are assigned on an individual loan
basis with the amount reserved dependent on whether repayment of the loan is
dependent on the liquidation of collateral or from some other source of
repayment. If repayment is dependent on the sale of collateral, the reserve is
equivalent to the recorded investment in the loan less the fair value of the
collateral after estimated sales expenses. If repayment is not dependent on
the sale of collateral, the reserve is equivalent to the recorded investment in
the loan less the estimated cash flows discounted using the loan’s effective
interest rate. The discounted value of the cash flows is based on the
anticipated timing of the receipt of cash payments from the borrower. The
reserve allocations for individually measured impaired loans are sensitive to
the extent market conditions or the actual timing of cash receipts change.
Impairment reserves for smaller-balance loans under a specific dollar amount
are assigned on a pooled basis utilizing loss factors for impaired loans of a
similar nature.
The second component is a general reserve on all loans
other than those identified as impaired. General reserves are assigned to
various homogenous loan pools, including commercial, commercial real estate,
construction, residential 1-4 family, home equity, and consumer. General
reserves are assigned based on historical loan loss ratios determined by loan
pool and internal risk ratings that are adjusted for various internal and
external risk factors unique to each loan pool.
Table 9 analyzes the activity in the allowance over
the past five years.
For 2017, our net loan charge-offs
totaled $2.3 million, or 0.14%, of average loans, compared to $1.3 million, or
0.09%, for 2016, and $5.2 million, or 0.35%, for 2015. The increase in 2017 was attributable to a lower level of loan recoveries.
The decrease in 2016 was attributable to both
a lower level of gross loan charge-offs and a higher level of loan recoveries
as we were very successful during 2016 in our collection efforts for judgments
obtained during the last economic recession. At
December 31, 2017, the allowance for loan losses of $13.3 million was 0.80% of
outstanding loans (net of overdrafts) and provided coverage of 186% of
nonperforming loans compared to 0.86% and 157%, respectively, at December 31,
2016, and 0.93% and 135%, respectively, at December 31, 2015.
Table 10 provides an
allocation of the allowance for loan losses to specific loan types for each of
the past five years.
The slight decrease in the allowance for loan losses from December
31, 2016 to December 31, 2017 was primarily attributable to a decline in
general reserves which reflected favorable problem loan migration and improving
risk factors within the loan portfolio. The reduction in the allowance for
loan losses from December 31, 2015 to December 31, 2016 was primarily
attributable to a decline in impaired loan reserves and reflected slower inflow
and successful resolutions, as well as lower loss content. Since 2015, growth
in the loan portfolio and related general reserves partially offset the
aforementioned reductions due to favorable problem loan migration. It is management’s opinion that the allowance at
December 31, 2017 is adequate to absorb probable losses inherent in the loan
portfolio.
|
Table 9
|
|
|
|
|
|
|
|
|
|
|
|
|
|
|
|
|
|
|
|
|
ANALYSIS OF ALLOWANCE FOR LOAN LOSSES
|
|
|
|
|
|
|
|
|
|
|
|
|
|
|
|
|
|
|
|
|
|
|
|
|
|
|
|
|
|
|
|
|
|
|
|
|
(Dollars in Thousands)
|
2017
|
|
|
2016
|
|
|
2015
|
|
|
2014
|
|
|
2013
|
|
|
Balance at Beginning of Year
|
$
|
13,431
|
|
|
$
|
13,953
|
|
|
$
|
17,539
|
|
|
$
|
23,095
|
|
|
$
|
29,167
|
|
|
Charge-Offs:
|
|
|
|
|
|
|
|
|
|
|
|
|
|
|
|
|
|
|
|
|
Commercial, Financial and Agricultural
|
|
1,357
|
|
|
|
861
|
|
|
|
1,029
|
|
|
|
871
|
|
|
|
748
|
|
|
Real Estate – Construction
|
|
-
|
|
|
|
-
|
|
|
|
-
|
|
|
|
28
|
|
|
|
1,070
|
|
|
Real Estate – Commercial
|
|
685
|
|
|
|
349
|
|
|
|
1,250
|
|
|
|
3,788
|
|
|
|
3,651
|
|
|
Real Estate – Residential
|
|
411
|
|
|
|
899
|
|
|
|
1,852
|
|
|
|
2,160
|
|
|
|
3,835
|
|
|
Real Estate – Home Equity
|
|
190
|
|
|
|
450
|
|
|
|
1,403
|
|
|
|
1,379
|
|
|
|
1,159
|
|
|
Consumer
|
|
2,193
|
|
|
|
2,127
|
|
|
|
1,901
|
|
|
|
1,820
|
|
|
|
1,751
|
|
|
Total Charge-Offs
|
|
4,836
|
|
|
|
4,686
|
|
|
|
7,435
|
|
|
|
10,046
|
|
|
|
12,214
|
|
|
|
|
|
|
|
|
|
|
|
|
|
|
|
|
|
|
|
|
|
|
|
Recoveries:
|
|
|
|
|
|
|
|
|
|
|
|
|
|
|
|
|
|
|
|
|
Commercial, Financial and Agricultural
|
|
313
|
|
|
|
337
|
|
|
|
239
|
|
|
|
214
|
|
|
|
209
|
|
|
Real Estate – Construction
|
|
50
|
|
|
|
-
|
|
|
|
-
|
|
|
|
9
|
|
|
|
1
|
|
|
Real Estate – Commercial
|
|
174
|
|
|
|
408
|
|
|
|
183
|
|
|
|
468
|
|
|
|
363
|
|
|
Real Estate – Residential
|
|
616
|
|
|
|
1,231
|
|
|
|
705
|
|
|
|
752
|
|
|
|
838
|
|
|
Real Estate – Home Equity
|
|
219
|
|
|
|
409
|
|
|
|
136
|
|
|
|
141
|
|
|
|
294
|
|
|
Consumer
|
|
1,125
|
|
|
|
960
|
|
|
|
992
|
|
|
|
1,001
|
|
|
|
965
|
|
|
Total Recoveries
|
|
2,497
|
|
|
|
3,345
|
|
|
|
2,255
|
|
|
|
2,585
|
|
|
|
2,670
|
|
|
|
|
|
|
|
|
|
|
|
|
|
|
|
|
|
|
|
|
|
|
|
Net Charge-Offs
|
|
2,339
|
|
|
|
1,341
|
|
|
|
5,180
|
|
|
|
7,461
|
|
|
|
9,544
|
|
|
|
|
|
|
|
|
|
|
|
|
|
|
|
|
|
|
|
|
|
|
|
Provision for Loan Losses
|
|
2,215
|
|
|
|
819
|
|
|
|
1,594
|
|
|
|
1,905
|
|
|
|
3,472
|
|
|
|
|
|
|
|
|
|
|
|
|
|
|
|
|
|
|
|
|
|
|
|
Balance at End of Year
|
$
|
13,307
|
|
|
$
|
13,431
|
|
|
$
|
13,953
|
|
|
$
|
17,539
|
|
|
$
|
23,095
|
|
|
|
|
|
|
|
|
|
|
|
|
|
|
|
|
|
|
|
|
|
|
|
Ratio of Net Charge-Offs to Average Loans
Outstanding
|
|
0.14
|
%
|
|
|
0.09
|
%
|
|
|
0.35
|
%
|
|
|
0.53
|
%
|
|
|
0.66
|
%
|
|
|
|
|
|
|
|
|
|
|
|
|
|
|
|
|
|
|
|
|
|
|
Allowance for Loan Losses as a Percent of
Loans at End of Year
|
|
0.80
|
%
|
|
|
0.86
|
%
|
|
|
0.93
|
%
|
|
|
1.22
|
%
|
|
|
1.65
|
%
|
|
|
|
|
|
|
|
|
|
|
|
|
|
|
|
|
|
|
|
|
|
|
Allowance for Loan Losses as a Multiple of
Net Charge-Offs
|
|
5.69
|
x
|
|
|
10.02
|
x
|
|
|
2.69
|
x
|
|
|
2.35
|
x
|
|
|
2.42
|
x
|
|
Table 10
|
|
|
|
|
|
|
|
|
|
|
|
|
|
|
|
|
|
|
|
|
|
|
|
|
|
|
|
|
|
|
ALLOCATION OF ALLOWANCE FOR LOAN LOSSES
|
|
|
|
|
|
|
|
|
|
|
|
|
|
|
|
|
|
|
|
|
|
|
|
|
|
|
|
|
|
|
|
|
|
|
|
|
|
|
|
|
|
|
|
|
|
|
|
|
|
|
|
2017
|
|
2016
|
|
2015
|
|
2014
|
|
2013
|
|
(Dollars in Thousands)
|
Allow-ance Amount
|
|
Percent of Loans in Each
Category To Total Loans
|
|
Allow-ance Amount
|
|
Percent of Loans in Each
Category To Total Loans
|
|
Allow-ance Amount
|
|
Percent of Loans in Each
Category To Total Loans
|
|
Allow-ance Amount
|
|
Percent of Loans in Each
Category To Total Loans
|
|
Allow-ance Amount
|
|
Percent of Loans in Each
Category To Total Loans
|
|
Commercial, Financial
and Agricultural
|
$
|
1,191
|
|
13.2
|
%
|
|
$
|
1,198
|
|
13.8
|
%
|
|
$
|
905
|
|
12.0
|
%
|
|
$
|
784
|
|
9.5
|
%
|
|
$
|
699
|
|
9.0
|
%
|
|
Real Estate:
|
|
|
|
|
|
|
|
|
|
|
|
|
|
|
|
|
|
|
|
|
|
|
|
|
|
|
|
|
|
|
Construction
|
|
122
|
|
4.7
|
|
|
|
168
|
|
3.7
|
|
|
|
101
|
|
3.1
|
|
|
|
843
|
|
3.0
|
|
|
|
1,580
|
|
2.6
|
|
|
Commercial
|
|
4,346
|
|
32.3
|
|
|
|
4,315
|
|
32.1
|
|
|
|
4,498
|
|
33.2
|
|
|
|
5,287
|
|
35.4
|
|
|
|
7,710
|
|
38.1
|
|
|
Residential
|
|
3,206
|
|
19.1
|
|
|
|
3,445
|
|
18.6
|
|
|
|
4,409
|
|
20.0
|
|
|
|
6,520
|
|
21.1
|
|
|
|
9,073
|
|
22.6
|
|
|
Home Equity
|
|
2,506
|
|
13.8
|
|
|
|
2,297
|
|
15.0
|
|
|
|
2,473
|
|
15.6
|
|
|
|
2,882
|
|
15.9
|
|
|
|
3,051
|
|
16.3
|
|
|
Consumer
|
|
1,936
|
|
16.9
|
|
|
|
2,008
|
|
16.8
|
|
|
|
1,567
|
|
16.1
|
|
|
|
1,223
|
|
15.1
|
|
|
|
982
|
|
11.4
|
|
|
Not Allocated
|
|
-
|
|
-
|
|
|
|
-
|
|
-
|
|
|
|
-
|
|
-
|
|
|
|
-
|
|
-
|
|
|
|
-
|
|
-
|
|
|
|
|
|
|
|
|
|
|
|
|
|
|
|
|
|
|
|
|
|
|
|
|
|
|
|
|
|
|
|
|
|
Total
|
$
|
13,307
|
|
100.0
|
%
|
|
$
|
13,431
|
|
100.0
|
%
|
|
$
|
13,953
|
|
100.0
|
%
|
|
$
|
17,539
|
|
100.0
|
%
|
|
$
|
23,095
|
|
100.0
|
%
|
Investment Securities
In 2017, our average investment portfolio increased $16.3 million,
or 2.4%, from 2016 and increased $65.3 million, or 10.7%, from 2015 to
2016. As a percentage of average earning assets, the investment
portfolio represented 27.7% in 2017, compared to 27.8% in 2016. In
both 2016 and 2017, we strategically grew the portfolio to better deploy our
liquidity. In 2018, we will continue to closely monitor liquidity levels and
pledging requirements to assess the need to purchase additional investments, as
well as look for new investment products that are prudent relative to our risk
profile and overall investment strategy. A relatively short duration investment
portfolio offers the flexibility to provide additional liquidity from maturing
bonds, if necessary.
In 2017, average taxable investments increased $9.5 million, or
1.6%, while tax-exempt investments increased $6.8 million, or
7.5%. Both taxable and non-taxable investments increased as part of
our overall investment strategy in 2017. High quality, short-term taxable and
non-taxable bonds offered attractive yields during the year, resulting in
favorable repricing in the investment portfolio. At December 31, 2017,
municipal securities (taxable and non-taxable) comprised 13.1% of the
portfolio. Management will continue to purchase municipal issues as they become
available and when it considers the yield to be attractive given the lower
federal tax rate related to the recent Tax Act.
The investment portfolio is a significant component
of our operations and, as such, it functions as a key element of liquidity and
asset/liability management. Two types of classifications are approved for
investment securities which are Available-for-Sale (“AFS”) and
Held-for-Maturity (“HTM”). In 2016 and 2017, securities were purchased under
both the AFS and HTM designations. At December 31, 2017, $480.9 million, or
68.9% of the investment portfolio was classified as AFS, with the remaining
$216.7 million, or 31.1%, classified as HTM. At December 31, 2016, the AFS and
HTM portfolio comprised 74.7% and 25.3%, respectively. Table 11
provides the composition of our investment securities portfolio.
Table 11
INVESTMENT SECURITES COMPOSITION
|
|
2017
|
|
2016
|
|
2015
|
|
(Dollars in Thousands)
|
Carrying Amount
|
Percent
|
|
Carrying Amount
|
Percent
|
|
Carrying Amount
|
Percent
|
|
Available for Sale
|
|
|
|
|
|
|
|
|
|
|
|
|
|
|
|
|
|
|
U.S. Government Treasury
|
$
|
235,341
|
|
33.7
|
%
|
|
$
|
286,278
|
|
40.9
|
%
|
|
$
|
250,346
|
|
39.2
|
%
|
|
U.S. Government Agency
|
|
144,644
|
|
20.7
|
|
|
|
131,640
|
|
18.8
|
|
|
|
101,824
|
|
15.9
|
|
|
States and Political Subdivisions
|
|
91,157
|
|
13.1
|
|
|
|
94,839
|
|
13.5
|
|
|
|
88,362
|
|
13.8
|
|
|
Mortgage-Backed Securities
|
|
1,185
|
|
0.2
|
|
|
|
1,430
|
|
0.2
|
|
|
|
1,901
|
|
0.3
|
|
|
Equity Securities
|
|
8,584
|
|
1.2
|
|
|
|
8,547
|
|
1.2
|
|
|
|
8,595
|
|
1.3
|
|
|
Total
|
|
480,911
|
|
68.9
|
|
|
|
522,734
|
|
74.7
|
|
|
|
451,028
|
|
70.6
|
|
|
|
|
|
|
|
|
|
|
|
|
|
|
|
|
|
|
|
|
|
Held to Maturity
|
|
|
|
|
|
|
|
|
|
|
|
|
|
|
|
|
|
|
U.S. Government Treasury
|
|
98,256
|
|
14.1
|
|
|
|
119,131
|
|
17.0
|
|
|
|
134,554
|
|
21.1
|
|
|
U.S. Government Agency
|
|
-
|
|
-
|
|
|
|
-
|
|
-
|
|
|
|
10,043
|
|
1.6
|
|
|
States and Political Subdivisions
|
|
6,996
|
|
1.0
|
|
|
|
8,175
|
|
1.2
|
|
|
|
15,693
|
|
2.5
|
|
|
Mortgage-Backed Securities
|
|
111,427
|
|
16.0
|
|
|
|
50,059
|
|
7.2
|
|
|
|
27,602
|
|
4.3
|
|
|
Total
|
|
216,679
|
|
31.1
|
|
|
|
177,365
|
|
25.3
|
|
|
|
187,892
|
|
29.4
|
|
|
|
|
|
|
|
|
|
|
|
|
|
|
|
|
|
|
|
|
|
Total Investment Securities
|
$
|
697,590
|
|
100
|
%
|
|
$
|
700,099
|
|
100
|
%
|
|
$
|
638,920
|
|
100
|
%
|
At acquisition, the
classification of the security will be determined based on how the purchase
will affect our asset/liability strategy and future business plans and
opportunities. Such decisions will be weighed against multiple factors,
including regulatory capital requirements, volatility in earnings or other
comprehensive income, and liquidity needs. Securities in the AFS portfolio are
recorded at fair value with unrealized gains and losses associated with these
securities recorded net of tax, in the accumulated other comprehensive income
(loss) component of shareowners’ equity. Securities that are HTM are those
acquired or owned with the intent of holding them to maturity (final payment
date). HTM investments are measured at amortized cost. It is neither management’s
current intent nor practice to participate in the trading of investment
securities for the purpose of recognizing gains and therefore we do not
maintain a trading portfolio.
At December 31, 2017, there were 532 positions (combined AFS and
HTM) with unrealized losses totaling $4.6 million. Ginnie Mae mortgage-backed
securities, U.S. Treasuries, and SBA securities carry the full faith and credit
guarantee of the U.S. Government, and are 0% risk-weighted assets. SBA
securities float monthly or quarterly with the prime rate and are uncapped.
None of these positions with unrealized losses are considered impaired, and all
are expected to mature at par. The table below provides a break-down of our
unrealized losses by security type.
|
|
Less Than 12 months
|
|
12 months or Longer
|
|
Total
|
|
|
|
|
Market
|
Unrealized
|
|
|
|
Market
|
Unrealized
|
|
|
|
Market
|
Unrealized
|
|
(Dollars in Thousands)
|
Count
|
|
Value
|
Losses
|
|
Count
|
|
Value
|
Losses
|
|
Count
|
|
Value
|
Losses
|
|
GNMA
|
70
|
$
|
56,032
|
|
469
|
|
46
|
$
|
30,216
|
$
|
743
|
|
116
|
$
|
86,248
|
$
|
1,212
|
|
UST
|
47
|
|
233,304
|
|
1,261
|
|
20
|
|
94,839
|
|
1,344
|
|
67
|
|
328,143
|
|
2,605
|
|
SBA
|
40
|
|
33,324
|
|
108
|
|
3
|
|
1,335
|
|
2
|
|
43
|
|
34,659
|
|
110
|
|
FHLB and FFCB
|
7
|
|
12,413
|
|
42
|
|
16
|
|
24,422
|
|
255
|
|
23
|
|
36,835
|
|
297
|
|
States and Political Subdivisions
|
268
|
|
89,954
|
|
361
|
|
15
|
|
5,549
|
|
58
|
|
283
|
|
95,503
|
|
419
|
|
Total
|
432
|
$
|
425,027
|
$
|
2,241
|
|
100
|
$
|
156,361
|
$
|
2,402
|
|
532
|
$
|
581,388
|
$
|
4,643
|
The average maturity of the total portfolio at December 31, 2017
was 1.96 years compared to 1.85 years at December 31, 2016. Balances of SBA
and GNMA securities increased compared to the prior year, and were partially
offset by declines in U.S. Treasuries and municipal bonds. The average life of
the investment portfolio increased slightly as GNMAs purchased had longer
average lives than the existing portfolio. We continue to look for prudent
investments in relatively short-duration, high quality bonds, in addition to
CRA eligible securities within our footprint and policy guidelines. See Table
12 for a break-down of maturities by investment type.
The weighted average taxable equivalent
yield of the investment portfolio at December 31, 2017 was 1.68% versus 1.22%
in 2016. This favorable yield reflects the reinvestment of proceeds at higher
market rates during 2017. Our bond portfolio contained no
investments in obligations, other than U.S. Governments, of any state,
municipality, political subdivision or any other issuer that exceed 10% of our
shareowners’ equity at December 31, 2017.
Table 12 and Note 2 in the Notes to Consolidated Financial
Statements present a detailed analysis of our investment securities as to type,
maturity and yield at December 31.
|
Table 12
|
|
|
|
|
|
|
|
|
|
|
|
|
|
|
|
|
|
|
|
|
|
|
|
|
|
|
|
|
|
|
MATURITY DISTRIBUTION OF INVESTMENT SECURITIES
|
|
|
|
|
|
|
|
|
|
|
|
|
|
|
|
|
|
|
|
|
|
|
|
|
|
|
|
|
|
|
|
|
|
|
|
|
|
|
|
|
|
|
|
|
|
|
|
|
|
|
|
|
|
|
|
Within 1 year
|
|
|
1 - 5 years
|
|
|
5 - 10 years
|
|
|
After 10 years
|
|
|
Total
|
|
|
(Dollars in Thousands)
|
Amount
|
|
WAY(3)
|
|
|
Amount
|
|
WAY(3)
|
|
|
Amount
|
|
WAY(3)
|
|
|
Amount
|
|
WAY(3)
|
|
|
Amount
|
|
WAY(3)
|
|
|
Available for Sale
|
|
|
|
|
|
|
|
|
|
|
|
|
|
|
|
|
|
|
|
|
|
|
|
|
|
|
|
|
|
|
U.S. Government Treasury
|
$
|
41,168
|
|
1.12
|
%
|
|
$
|
194,173
|
|
1.38
|
%
|
|
$
|
-
|
|
-
|
%
|
|
$
|
-
|
|
-
|
%
|
|
$
|
235,341
|
|
1.33
|
%
|
|
U.S. Government Agency
|
|
20,261
|
|
1.49
|
|
|
|
124,383
|
|
2.30
|
|
|
|
-
|
|
-
|
|
|
|
-
|
|
-
|
|
|
|
144,644
|
|
2.19
|
|
|
States and Political Subdivisions
|
|
48,865
|
|
1.48
|
|
|
|
42,292
|
|
1.82
|
|
|
|
-
|
|
-
|
|
|
|
-
|
|
-
|
|
|
|
91,157
|
|
1.64
|
|
|
Mortgage-Backed Securities(1)
|
|
58
|
|
2.67
|
|
|
|
545
|
|
4.81
|
|
|
|
582
|
|
5.05
|
|
|
|
-
|
|
-
|
|
|
|
1,185
|
|
4.82
|
|
|
Other Securities(2)
|
|
-
|
|
-
|
|
|
|
-
|
|
-
|
|
|
|
-
|
|
-
|
|
|
|
8,584
|
|
5.32
|
|
|
|
8,584
|
|
5.32
|
|
|
Total
|
$
|
110,352
|
|
1.34
|
%
|
|
$
|
361,393
|
|
1.76
|
%
|
|
$
|
582
|
|
5.05
|
%
|
|
$
|
8,584
|
|
5.32
|
%
|
|
$
|
480,911
|
|
1.72
|
%
|
|
|
|
|
|
|
|
|
|
|
|
|
|
|
|
|
|
|
|
|
|
|
|
|
|
|
|
|
|
|
|
|
Held to Maturity
|
|
|
|
|
|
|
|
|
|
|
|
|
|
|
|
|
|
|
|
|
|
|
|
|
|
|
|
|
|
|
U.S. Government Treasury
|
$
|
63,115
|
|
1.12
|
%
|
|
$
|
35,141
|
|
1.47
|
%
|
|
$
|
-
|
|
-
|
%
|
|
$
|
-
|
|
-
|
%
|
|
$
|
98,256
|
|
1.25
|
%
|
|
States and Political Subdivisions
|
|
266
|
|
1.92
|
|
|
|
6,730
|
|
1.92
|
|
|
|
-
|
|
-
|
|
|
|
-
|
|
-
|
|
|
|
6,996
|
|
1.92
|
|
|
Mortgage-Backed Securities(1)
|
|
382
|
|
1.17
|
|
|
|
108,670
|
|
1.83
|
|
|
|
2,375
|
|
2.48
|
|
|
|
-
|
|
-
|
|
|
|
111,427
|
|
1.84
|
|
|
Total
|
$
|
63,763
|
|
1.13
|
%
|
|
$
|
150,541
|
|
1.75
|
%
|
|
$
|
2,375
|
|
2.48
|
%
|
|
$
|
-
|
|
-
|
%
|
|
$
|
216,679
|
|
1.57
|
%
|
|
|
|
|
|
|
|
|
|
|
|
|
|
|
|
|
|
|
|
|
|
|
|
|
|
|
|
|
|
|
|
|
Total Investment Securities
|
$
|
174,115
|
|
1.26
|
%
|
|
$
|
511,934
|
|
1.75
|
%
|
|
$
|
2,957
|
|
2.99
|
%
|
|
$
|
8,584
|
|
5.32
|
%
|
|
$
|
697,590
|
|
1.68
|
%
|
|
|
|
|
|
|
|
|
|
|
|
|
|
|
|
|
|
|
|
|
|
|
|
|
|
|
|
|
|
|
|
|
(1) Based on weighted-average life.
|
|
|
|
|
|
|
|
|
|
|
|
|
|
|
|
|
|
|
|
|
|
|
|
|
|
|
|
|
|
(2) Federal Home Loan Bank Stock, Federal
Reserve Bank Stock and FNBB, Inc. Stock are included in this category for
weighted average yield, but do not have stated maturities.
|
|
|
(3) Weighted average yield calculated based
on current amortized cost balances – not presented on a tax equivalent basis.
|
|
|
|
Deposits and Funds Purchased
Average total deposits for 2017 were $2.372 billion, an increase
of $89.1 million, or 3.9%, over 2016. Average deposits increased $119.3
million, or 5.5%, from 2015 to 2016. Both
year-over-year increases occurred in all deposit types except certificates of
deposit. Money market accounts also declined slightly from 2015 to 2016.
The seasonal inflow of public funds started in the fourth quarter
of 2017 and is expected to continue into the first quarter of 2018. Deposit levels
remain strong as we continue to see growth in our non-maturity deposits. Our
mix of deposits continues to improve slightly as higher cost certificates of
deposit are replaced with lower rate non-maturity deposits and noninterest
bearing demand accounts.
We continue to closely monitor several metrics such as the
sensitivity of our deposit rates, the Bank’s overall liquidity position, and
competitor rates when pricing deposits. This strategy is consistent with
previous rate cycles, and allows us to manage the mix of our deposits rather than compete on rate. We
believe this enables us to maintain a low cost of funds – 16 basis points for
the year 2017 and 13 basis points for the year 2016.
Table 2 provides an analysis of our average deposits, by category,
and average rates paid thereon for each of the last three years. Table 13
reflects the shift in our deposit mix over the last year and Table 14 provides
a maturity distribution of time deposits in denominations of $100,000 and over
at December 31, 2017.
Average short-term borrowings, which include federal funds
purchased, securities sold under agreements to repurchase, FHLB advances
(maturing in less than one year), and other borrowings, decreased $26.8
million, or 73.0% in 2017. The lower balance was primarily
attributable to decreases in repurchase agreements by one client into a
different product type, partially offset by an increase in other borrowed
funds. See Note 8 in the Notes to Consolidated Financial Statements for further
information on short-term borrowings.
We continue to focus on the value of our deposit franchise, which
produces a strong base of core deposits with minimal reliance on wholesale
funding.
Table 13
SOURCES OF DEPOSIT GROWTH
|
|
2016 to
|
|
Percentage
|
|
|
Components of
|
|
|
|
2017
|
|
of Total
|
|
|
Total Deposits
|
|
|
(Average Balances - Dollars in Thousands)
|
Change
|
|
Change
|
|
|
2017
|
|
|
2016
|
|
|
2015
|
|
|
Noninterest Bearing Deposits
|
$
|
46,788
|
|
|
52.5
|
%
|
|
|
35.1
|
%
|
|
|
34.4
|
%
|
|
|
33.1
|
%
|
|
NOW Accounts
|
|
26,097
|
|
|
29.3
|
|
|
|
34.0
|
|
|
|
34.2
|
|
|
|
34.5
|
|
|
Money Market Accounts
|
|
2,039
|
|
|
2.3
|
|
|
|
10.9
|
|
|
|
11.2
|
|
|
|
11.9
|
|
|
Savings
|
|
31,602
|
|
|
35.5
|
|
|
|
13.6
|
|
|
|
12.8
|
|
|
|
11.8
|
|
|
Time Deposits
|
|
(17,440)
|
|
|
(19.6)
|
|
|
|
6.4
|
|
|
|
7.4
|
|
|
|
8.7
|
|
|
Total Deposits
|
$
|
89,086
|
|
|
100.0
|
%
|
|
|
100.0
|
%
|
|
|
100.0
|
%
|
|
|
100.0
|
%
|
|
Table 14
|
|
|
|
|
|
|
MATURITY DISTRIBUTION OF CERTIFICATES OF DEPOSIT $100,000
AND OVER
|
|
|
|
|
|
|
|
|
|
|
|
|
2017
|
|
|
(Dollars in Thousands)
|
Time Certificates
of Deposit
|
|
Percent
|
|
|
Three months or less
|
$
|
11,130
|
|
28.4
|
%
|
|
Over three through six months
|
|
9,271
|
|
23.7
|
|
|
Over six through twelve months
|
|
15,187
|
|
38.7
|
|
|
Over twelve months
|
|
3,621
|
|
9.2
|
|
|
Total
|
$
|
39,209
|
|
100.0
|
%
|
Market Risk
and Interest Rate Sensitivity
Overview. Market risk arises from changes in interest rates, exchange
rates, commodity prices, and equity prices. We have risk management
policies designed to monitor and limit exposure to market risk and we do not
participate in activities that give rise to significant market risk involving
exchange rates, commodity prices, or equity prices. In asset and
liability management activities, our policies are designed to minimize structural
interest rate risk.
Interest Rate Risk Management. Our net income is largely dependent on net
interest income. Net interest income is susceptible to interest rate
risk to the degree that interest-bearing liabilities mature or reprice on a
different basis than interest-earning assets. When interest-bearing
liabilities mature or reprice more quickly than interest-earning assets in a
given period, a significant increase in market rates of interest could
adversely affect net interest income. Similarly, when
interest-earning assets mature or reprice more quickly than interest-bearing
liabilities, falling interest rates could result in a decrease in net interest
income. Net interest income is also affected by changes in the
portion of interest-earning assets that are funded by interest-bearing liabilities
rather than by other sources of funds, such as noninterest-bearing deposits and
shareowners’ equity.
We have established what we believe to be a comprehensive interest
rate risk management policy, which is administered by management’s Asset
Liability Management Committee (“ALCO”). The policy establishes
limits of risk, which are quantitative measures of the percentage change in net
interest income (a measure of net interest income at risk) and the fair value
of equity capital (a measure of economic value of equity (“EVE”) at risk)
resulting from a hypothetical change in interest rates for maturities from one
day to 30 years. We measure the potential adverse impacts that changing
interest rates may have on our short-term earnings, long-term value, and
liquidity by employing simulation analysis through the use of computer
modeling. The simulation model captures optionality factors such as
call features and interest rate caps and floors imbedded in investment and loan
portfolio contracts. As with any method of gauging interest rate
risk, there are certain shortcomings inherent in the interest rate modeling
methodology used by us. When interest rates change, actual movements
in different categories of interest-earning assets and interest-bearing
liabilities, loan prepayments, and withdrawals of time and other deposits, may
deviate significantly from assumptions used in the model. Finally,
the methodology does not measure or reflect the impact that higher rates may
have on adjustable-rate loan clients’ ability to service their debts, or the
impact of rate changes on demand for loan and deposit products.
The balance sheet is subject to testing for interest rate shock
possibilities to indicate the inherent interest rate risk. We prepare a
current base case and several alternative interest rate simulations (-100,+100, +200, +300, and +400 basis points (bp)), at least once
per quarter, and report the analysis to ALCO, our Market Risk Oversight
Committee (“MROC”), our Enterprise Risk Oversight Committee (“EROC”) and the
Board of Directors. We augment our interest rate shock analysis with
alternative interest rate scenarios on a quarterly basis that may include
ramps, parallel shifts, and a flattening or steepening of the yield curve
(non-parallel shift). In addition, more frequent forecasts may be produced
when interest rates are particularly uncertain or when other business
conditions so dictate.
It is management’s goal to structure the balance sheet so that net
interest earnings at risk over 12-month and 24-month periods and the economic
value of equity at risk do not exceed policy guidelines at the various interest
rate shock levels. Management attempts to achieve this goal by balancing,
within policy limits, the volume of floating-rate liabilities with a similar
volume of floating-rate assets, by keeping the average maturity of fixed-rate
asset and liability contracts reasonably matched, by managing the mix of our
core deposits, and by adjusting our rates to market conditions on a continuing
basis. During 2017, instantaneous rate shocks of down 100 bp were outside of
desired parameters due to limited repricing of deposits relative to the decline
in rates.
Analysis. Measures of net interest income at risk produced by
simulation analysis are indicators of an institution’s short-term performance
in alternative rate environments. These measures are typically based
upon a relatively brief period, and do not necessarily indicate the long-term prospects
or economic value of the institution.
ESTIMATED CHANGES IN NET INTEREST INCOME(1)
|
Percentage Change
(12-month shock)
|
|
+400 bp
|
|
|
+300 bp
|
|
|
+200 bp
|
|
|
+100 bp
|
|
|
-100 bp
|
|
|
Policy Limit
|
|
-15.0
|
%
|
|
-12.5
|
%
|
|
-10.0
|
%
|
|
-7.5
|
%
|
|
-7.5
|
%
|
|
December 31, 2017
|
|
13.4
|
%
|
|
9.9
|
%
|
|
6.4
|
%
|
|
3.1
|
%
|
|
-8.5
|
%
|
|
December 31, 2016
|
|
10.7
|
%
|
|
7.5
|
%
|
|
4.4
|
%
|
|
2.1
|
%
|
|
-9.0
|
%
|
|
|
|
|
|
|
|
|
|
|
|
|
|
|
|
|
|
|
|
|
|
|
|
|
|
|
|
|
|
|
|
|
|
|
|
Percentage Change
(24-month shock)
|
|
+400 bp
|
|
|
+300 bp
|
|
|
+200 bp
|
|
|
+100 bp
|
|
|
-100 bp
|
|
|
Policy Limit
|
|
-17.5
|
%
|
|
-15.0
|
%
|
|
-12.5
|
%
|
|
-10.0
|
%
|
|
-10.0
|
%
|
|
December 31, 2017
|
|
39.9
|
%
|
|
30.4
|
%
|
|
20.9
|
%
|
|
11.8
|
%
|
|
-12.0
|
%
|
|
December 31, 2016
|
|
41.3
|
%
|
|
30.5
|
%
|
|
19.9
|
%
|
|
10.5
|
%
|
|
-14.3
|
%
|
The Net Interest Income (“NII”) at Risk position improved for the
period ending December 31, 2017 compared to December 31, 2016 for the 12-month
shock for all rate scenarios. The model indicates that in the short-term, all
rising rate environments will positively impact the net interest margin of the
Company, while a declining rate environment of 100bp will have a negative
impact on the net interest margin. In addition, this analysis incorporates an
instantaneous, parallel shock and assumes we move with market rates and do not
lag our deposit rates.
All shock scenarios of net interest income at risk are within our
prescribed policy limits with the exception of an instantaneous rate shock of
-100bp over both a 12-month and 24-month period, which were -8.5% and -12.0%
compared to limits of -7.50% and -10.0%, respectively. These metrics were out
of compliance at year-end due to limited repricing of deposits relative to a
decline in market rates. However, as rates have increased the variance by
which we are out-of-compliance has narrowed.
The measures of equity value at risk indicate our ongoing economic
value by considering the effects of changes in interest rates on all of our
cash flows by discounting the cash flows to estimate the present value of
assets and liabilities. The difference between these discounted values of the
assets and liabilities is the economic value of equity, which in theory
approximates the fair value of our net assets.
ESTIMATED CHANGES IN ECONOMIC VALUE OF EQUITY(1)
|
Changes in Interest
Rates
|
|
+400 bp
|
|
|
+300 bp
|
|
|
+200 bp
|
|
|
+100 bp
|
|
|
-100 bp
|
|
|
Policy Limit
|
|
-30.0
|
%
|
|
-25.0
|
%
|
|
-20.0
|
%
|
|
-15.0
|
%
|
|
-15.0
|
%
|
|
December 31, 2017
|
|
31.1
|
%
|
|
24.7
|
%
|
|
17.5
|
%
|
|
9.7
|
%
|
|
-21.0
|
%
|
|
December 31, 2016
|
|
23.5
|
%
|
|
18.6
|
%
|
|
13.1
|
%
|
|
7.3
|
%
|
|
-19.7
|
%
|
At December 31, 2017, the
economic value of equity was more favorable in all rate scenarios except the
down 100 bp scenario when compared to December 31, 2016. The down 100 bp rate
scenario remains out of compliance as exposure to falling rates is more extreme
due to the low level of current deposit costs and limited capacity to reduce
those costs relative to the reduction in discount rates used to value them. To
bring this metric into compliance with our policy limits in the down 100 bp
scenario would require the bank to extend its asset duration which we do not
believe is prudent given the current historically low interest rate
environment.
As the interest rate
environment and the dynamics of the economy continue to change, additional
simulations will be analyzed to address not only the changing rate environment,
but also the changing balance sheet mix, measured over multiple years, to help
assess the risk to the Company.
(1)
Down 200, 300, and 400 bp
rate scenarios have been excluded due to the current historically low interest
rate environment.
LIQUIDITY AND CAPITAL RESOURCES
Liquidity
In general terms, liquidity is a measurement of our ability to
meet our cash needs. Our objective in managing our liquidity is to
maintain our ability to fund loan commitments, purchase securities, accommodate
deposit withdrawals or repay other liabilities in accordance with their terms,
without an adverse impact on our current or future earnings. Our
liquidity strategy is guided by policies that are formulated and monitored by
our ALCO and senior management, and which take into account the marketability of
assets, the sources and stability of funding and the level of unfunded
commitments. We regularly evaluate all of our various funding
sources with an emphasis on accessibility, stability, reliability and
cost-effectiveness. For the years ended December 31, 2017 and
2016, our principal source of funding has been our clients’ deposits,
supplemented by our short-term and long-term borrowings, primarily from our
trust-preferred securities, securities sold under repurchase agreements,
federal funds purchased and FHLB borrowings. We believe that the
cash generated from operations, our borrowing capacity and our access to
capital resources are sufficient to meet our future operating capital and
funding requirements.
At December 31, 2017, we had the ability to generate approximately
$1.286 billion in additional liquidity through all of our available resources
beyond our overnight funds sold position. In addition to the primary
borrowing outlets mentioned above, we also have the ability to generate
liquidity by borrowing from the Federal Reserve Discount Window and through
brokered deposits. Management recognizes the importance of
maintaining liquidity and has developed a Contingent Liquidity Plan, which
addresses various liquidity stress levels and our response and action based on
the level of severity. We periodically test our credit facilities
for access to the funds, but also understand that as the severity of the
liquidity level increases certain credit facilities may no longer be
available. A liquidity stress test is completed quarterly based on
events that could potentially occur at the Bank and the results reported to
ALCO, MROC, EROC and the Board of Directors. We believe the liquidity
available to us is sufficient to meet our ongoing needs.
We view our investment portfolio as a liquidity source and have
the option to pledge the portfolio as collateral for borrowings or deposits,
and/or sell selected securities. The portfolio consists of debt
issued by the U.S. Treasury, U.S. governmental agencies, and municipal governments. The
weighted-average life of the portfolio is 1.96 years and at December 31, 2017
had a net unrealized pre-tax loss of $2.1 million in the available-for sale
portfolio.
Our average net overnight funds sold
position (defined as funds sold plus interest-bearing deposits with other banks
less funds purchased) was $190.0 million during 2017 compared to an average net
overnight funds sold position of $212.8 million in 2016. The decrease in this
position compared to the prior year reflected higher growth in both the
investment and loan portfolios, partially offset by an increase in average
deposits.
Capital expenditures are expected to approximate
$7.0 million over the next 12 months, which consist primarily of technology
purchases for banking offices, business applications, and information
technology security needs as well as furniture and fixtures and banking office
remodels. Management believes that these capital expenditures will be funded
with existing resources without impairing our ability to meet our ongoing
obligations.
Borrowings
At December 31, 2017, total advances from the FHLB consisted of
$11.5 million in outstanding debt consisting of 13 notes. In 2017, the
Bank made FHLB advance payments totaling $6.7 million, which included seven
advances that matured or were paid off. No new FHLB advances were obtained in
2017. The FHLB notes are collateralized by a blanket floating lien on all
of our 1-4 family residential mortgage loans, commercial real estate mortgage
loans, and home equity mortgage loans.
We have issued two junior subordinated deferrable interest notes
to wholly owned Delaware statutory trusts. The first note for $30.9
million was issued to CCBG Capital Trust I in November 2004. The
second note for $32.0 million was issued to CCBG Capital Trust II in May
2005. See Note 8 in the Notes to Consolidated Financial Statements
for additional information on these borrowings. The interest payment
for the CCBG Capital Trust I borrowing is due quarterly and adjusts quarterly
to a variable rate of three-month LIBOR plus a margin of 1.90%. This
note matures on December 31, 2034. The interest payment for the CCBG
Capital Trust II borrowing is due quarterly and will adjust annually to a
variable rate of three-month LIBOR plus a margin of 1.80%. This note
matures on June 15, 2035. The proceeds from these borrowings were
used to partially fund acquisitions.
On April 12, 2016, we retired $10 million in face value of trust
preferred securities that were auctioned as part of a liquidation of a pooled
collateralized debt obligation fund. The trust preferred securities were
originally issued through CCBG Capital Trust I. Our winning bid equated to
approximately 75% of the $10 million par value, with the 25% discount resulting
in a pre-tax gain of approximately $2.5 million. We utilized internal
resources and a $3.75 million draw on a short-term borrowing facility to fund
the repurchase.
Table 15
CONTRACTUAL CASH OBLIGATIONS
Table 15 sets forth certain information
about contractual cash obligations at December 31, 2017.
|
|
Payments Due By Period
|
|
(Dollars in Thousands)
|
< 1 Yr
|
|
> 1 – 3 Yrs
|
|
> 3 – 5 Yrs
|
|
> 5 Yrs
|
|
Total
|
|
Federal Home Loan Bank Advances
|
$
|
1,557
|
|
$
|
5,838
|
|
$
|
3,509
|
|
$
|
572
|
|
$
|
11,476
|
|
Note Payable
|
|
296
|
|
|
592
|
|
|
592
|
|
|
1,219
|
|
|
2,669
|
|
Subordinated Notes Payable
|
|
-
|
|
|
-
|
|
|
-
|
|
|
52,887
|
|
|
52,887
|
|
Operating Lease Obligations
|
|
478
|
|
|
843
|
|
|
801
|
|
|
1,580
|
|
|
3,702
|
|
Time Deposit Maturities
|
|
121,821
|
|
|
17,165
|
|
|
4,135
|
|
|
1
|
|
|
143,122
|
|
Total Contractual Cash Obligations
|
$
|
124,152
|
|
$
|
24,438
|
|
$
|
9,037
|
|
$
|
56,259
|
|
$
|
213,886
|
Capital
Shareowners’ equity was $284.2 million at December 31, 2017,
compared to $275.2 million at December 31, 2016. During 2017, shareowners’ equity was
positively impacted by net income of $10.9 million, stock compensation
accretion of $1.5 million, net adjustments totaling $1.0 million related to
transactions under our stock compensation plans, and $0.7 million decrease in
the accumulated other comprehensive loss for our pension plan. Shareowners’
equity was reduced by common stock dividends of $4.1 million ($0.24 per share) and
a net increase of $1.0 million in the unrealized loss on investment securities.
Per ASU 2018-02, $5.6 million was reclassified from accumulated other
comprehensive income to retained earnings to correct certain tax effects
stranded in accumulated other comprehensive income due to tax reform enacted in
December, 2017.
Shareowners' equity as of December 31, for
each of the last three years is presented below:
|
(Dollars in Thousands)
|
2017
|
|
2016
|
|
2015
|
|
Common Stock
|
$
|
170
|
|
$
|
168
|
|
$
|
172
|
|
Additional Paid-in Capital
|
|
36,674
|
|
|
34,188
|
|
|
38,256
|
|
Retained Earnings
|
|
279,410
|
|
|
267,037
|
|
|
258,181
|
|
Subtotal
|
|
316,254
|
|
|
301,393
|
|
|
296,609
|
|
Accumulated Other Comprehensive Loss, Net of Tax
|
|
(32,044)
|
|
|
(26,225)
|
|
|
(22,257)
|
|
Total Shareowners’ Equity
|
$
|
284,210
|
|
$
|
275,168
|
|
$
|
274,352
|
We continue to
maintain a strong capital position. The ratio of shareowners' equity to total
assets at December 31, 2017 was 9.80%, 9.67%, and 9.81%, in 2017, 2016, and
2015, respectively. Management believes our strong capital base offers
protection during an economic downturn and provides sufficient capacity to meet
our strategic objectives.
We are subject to
risk-based capital guidelines that measure capital relative to risk-weighted
assets and off-balance sheet financial instruments. Capital guidelines issued
by the Federal Reserve require bank holding companies to have a minimum total
risk-based capital ratio of 8.00% and Tier 1 capital ratio of 6.00%. At
December 31, 2017, we exceeded these capital guidelines with a total risk-based
capital ratio of 17.10% and a Tier 1 capital ratio of 16.33%, compared to
16.28% and 15.51%, respectively, at December 31, 2016. As allowed by Federal
Reserve capital guidelines, the trust preferred securities issued by CCBG
Capital Trust I and CCBG Capital Trust II are included as Tier 1 Capital in our
capital calculations previously noted. See Note 9 in the Notes to Consolidated
Financial Statements for additional information on our two trust preferred
security offerings. See Note 14 in the Notes to Consolidated Financial
Statements for additional information as to our capital adequacy.
The federal banking regulators
issued new capital rules establishing a new comprehensive capital framework for
U.S. banking organizations which became effective January 1, 2015 (subject to a
phase-in period) (the “Basel III Capital Rules”). Refer to the Regulatory
Considerations – Capital Regulations section on page 14 for a detailed
discussion of the new Basel III Capital Rules. The reduction in our regulatory
capital ratios in 2015 reflected the implementation of the Basel III Capital
Rules and the repurchase of our common stock. In 2016, the repurchase of our
common stock and the partial redemption of TRUPs reduced our regulatory capital
ratios by approximately 38 basis points and 50 basis points, respectively. The
common equity Tier 1 ratio is a required ratio that was created in 2015 as a
result of the Basel III Capital Rules. The ratio measures core equity
components relative to risk-weighted assets. Capital guidelines require a
minimum common equity tier 1 ratio of 4.5% plus a capital conservation buffer
of 2.5% that will be phased in between 2016 and 2019 (0.625% in 2016, 1.25% in
2017, 1.875% in 2018, 2.5% in 2019). At December 31, 2017, our common equity
tier 1 ratio was 13.42%.
A leverage ratio is also used in connection with the risk-based
capital standards and is defined as Tier 1 Capital divided by average assets.
The minimum leverage ratio under this standard is 4% for the highest-rated bank
holding companies which are not undertaking significant expansion programs. A
higher standard may be required for other companies, depending upon their
regulatory ratings and expansion plans. At December 31, 2017, we had a
leverage ratio of 10.47% compared to 10.23% at December 31, 2016.
At December 31,
2017, our common stock had a book value of $16.65 per diluted share compared to
$16.23 at December 31, 2016. Book value is impacted by the net unrealized
gains and losses on investment securities. At December 31, 2017, the net
unrealized loss was $1.7 million compared to a $0.6 million net unrealized loss
at December 31, 2016. Approximately $0.3 million of this amount was a reclassification
of deferred taxes attributable to issuance of ASU 2018-02. Further, the
aforementioned net unrealized loss of $1.7 million reflected a $1.5 million net
loss on available for sale securities and $0.2 million in unamortized loss
related to the transfer of securities to held-to-maturity in 2013. Book value
is also impacted by the recording of our unfunded pension liability through
other comprehensive income in accordance with Accounting Standards Codification
Topic 715. At December 31, 2017, the net pension liability reflected in other
comprehensive loss was $30.3 million compared to $25.6 million at December 31,
2016. Approximately $5.5 million of this amount was a reclassification of
deferred taxes attributable to issuance of ASU 2018-02.
In February 2014, our Board of Directors authorized the repurchase
of up to 1,500,000 shares of our outstanding common stock over a five-year period.
Repurchases may be made in the open market or in privately negotiated
transactions; however, we are not obligated to repurchase any specified number
of shares. A total of 860,289 shares of our outstanding common stock have been
repurchased at an average price of $14.59 under the plan. No shares were repurchased
in 2017. During 2016, we repurchased 435,461 shares at an average price $14.49
per share and during 2015 we repurchased 405,228 shares at an average price of
$14.73 per share.
We offer an
Associate Incentive Plan (“AIP”) under which certain associates are eligible to
earn equity-based awards based upon achieving established performance goals.
In 2017, 37,133 shares were earned under this plan of which 8,190 shares were
issued in 2017 and 28,943 were issued in January 2018. In 2016, 71,153 shares
were earned under this plan of which 9,680 shares were issued in 2016 and
61,473 shares were issued in January 2017. Under the AIP, we also maintain
long-term incentive plans (‘LTIPs”) for the President and Chief Executive
Officer of the Company, the Chief Financial Officer of the Company, and the
President of the Bank that are both tied to earnings progression goals over a
three year period. Under these LTIPs, 12,216 shares were earned in 2017 and
issued in January 2018.
We also offer
stock purchase plans, which permit our associates and directors to purchase
shares at a 10% discount. In 2017, 39,214 shares, valued at approximately $0.8
million (before 10% discount), were issued under these plans. In 2016, 60,312
shares, valued at approximately $0.8 million (before 10% discount), were issued
under these plans.
Dividends
Adequate capital and financial strength is paramount to our
stability and the stability of our subsidiary bank. Cash dividends declared
and paid should not place unnecessary strain on our capital levels. When
determining the level of dividends the following factors are considered:
·
Compliance with state
and federal laws and regulations;
·
Our capital position
and our ability to meet our financial obligations;
·
Projected earnings and
asset levels; and
·
The ability of the
Bank and us to fund dividends.
Inflation
The
impact of inflation on the banking industry differs significantly from that of
other industries in which a large portion of total resources are invested in
fixed assets such as property, plant and equipment.
Assets and liabilities of
financial institutions are virtually all monetary in nature, and therefore are
primarily impacted by interest rates rather than changing prices. While the
general level of inflation underlies most interest rates, interest rates react
more to changes in the expected rate of inflation and to changes in monetary
and fiscal policy. Net interest income and the interest rate spread
are good measures of our ability to react to changing interest rates and are
discussed in further detail in the section entitled “Results of Operations.”
OFF-BALANCE SHEET ARRANGEMENTS
We do not currently engage in the use of derivative
instruments to hedge interest rate risks. However, we are a party to financial
instruments with off-balance sheet risks in the normal course of business to
meet the financing needs of our clients.
At December 31, 2017, we had
$445.1 million in commitments to extend credit and $4.7 million in standby
letters of credit. Commitments to extend credit are agreements to lend to a client
so long as there is no violation of any condition established in the contract.
Commitments generally have fixed expiration dates or other termination clauses
and may require payment of a fee. Since many of the commitments may expire
without being drawn upon, the total commitment amounts do not necessarily
represent future cash requirements. Standby letters of credit are conditional
commitments issued by us to guarantee the performance of a client to a third
party. We use the same credit policies in establishing commitments and issuing
letters of credit as we do for on-balance sheet instruments.
If commitments arising from these financial
instruments continue to require funding at historical levels, management does
not anticipate that such funding will adversely impact our ability to meet
on-going obligations. In the event these commitments require funding in excess
of historical levels, management believes current liquidity, investment
security maturities, available advances from the FHLB and Federal Reserve Bank
provide a sufficient source of funds to meet these commitments.
FOURTH QUARTER, 2017 FINANCIAL RESULTS
Results of Operations
We realized net income of $3,000, or $0.00 per diluted share
for the fourth quarter of 2017 which included a $4.1 million, or $0.24 per
diluted share, one-time income tax expense related to the Tax Act enacted on
December 22, 2017, compared to net income of $4.6 million, or $0.27 per diluted
share for the third quarter of 2017. The decrease in net income reflected
unfavorable variances in income tax expense of $4.2 million, loan loss
provision of $0.3 million, noninterest expense of $0.2 million, and noninterest
income of $0.1 million that were partially offset by higher net interest income
of $0.2 million.
Tax equivalent net interest income for the
fourth quarter of 2017 was $21.8 million compared to $21.6 million for the
third quarter of 2017. During the fourth quarter of 2017, overnight funds
increased as a result of the growth in noninterest bearing deposits, and to a
lesser degree, seasonal growth in our public funds deposits. A portion of
these overnight funds were used to fund growth in the loan and investment
portfolios. The net interest margin for the fourth quarter of 2017 was 3.45%
(annualized), a decrease of three basis points compared to the third quarter of
2017 due to seasonal growth in our overnight funds, resulting in a slightly
less favorable asset mix.
The provision for loan losses for
the fourth quarter of 2017 was $0.8 million compared to $0.5 million for the
third quarter of 2017 and reflected higher impaired reserves for two problem
loans. Net loan charge-offs for the fourth quarter of 2017 totaled $0.9
million compared to net loan charge-offs of $0.4 million for the third quarter
of 2017.
Noninterest income for the fourth quarter of 2017 totaled $12.9
million, a decrease of $0.1 million, or 0.8%, from the third quarter of 2017
and reflected lower deposit fees of $0.1 million and other income of $0.2
million (primarily data processing fees) that was partially offset by higher
bank card fees of $0.1 million. The reduction in data processing fees
reflected the discontinuance of this line of business early in the fourth
quarter of 2017.
Noninterest expense for the fourth quarter of 2017 totaled $26.9
million, an increase of $0.2 million, or 0.7%, over the third quarter of 2017
and reflected higher OREO expense of $0.5 million and other expense of $0.4
million, partially offset by lower compensation expense of $0.6 million and
occupancy expense of $0.1 million. The increase in OREO expense was
attributable to a higher level of gains from the sale of properties during the
third quarter of 2017. Other expense increased due to higher advertising
expense and professional fees. The reduction in compensation expense reflected
the adjustment to performance based incentive expense during the fourth quarter
of 2017 as well as lower commission expense which spiked during the third
quarter of 2017 due to payment of a commission on a large new wealth management
account.
We realized income tax expense of $6.7 million for the fourth
quarter of 2017 which included a $4.1 million discrete tax expense related to
the Tax Act. Excluding the discrete tax expense, income tax totaled $2.7
million (39% effective rate) compared to $2.5 million (35% effective rate) for
the third quarter of 2017. Income tax expense for the fourth quarter included
a $0.3 million write-off of a deferred tax asset related to a cancelled stock
award.
Discussion of Financial Condition
Average earning assets were $2.512 billion
for the fourth quarter of 2017, an increase of $45.7 million, or 1.9%, over the
third quarter of 2017 and reflected a higher level of total deposits primarily
attributable to the seasonal inflow of public fund balances. Average loans
increased $2.2 million, or 0.1%, over the third quarter of 2017 primarily
attributable to growth in real estate construction and indirect consumer
loans. Period end loan balances increased $20.2 million, or 1.23%, over the
third quarter of 2017 with growth realized in all but the residential and
direct consumer loan categories which declined slightly.
Nonperforming assets
(nonaccrual loans and OREO) totaled $11.1 million at December 31, 2017, a
decrease of $1.4 million, or 12%, from September 30, 2017. Nonaccrual loans
totaled $7.2 million at December 31, 2017, a $0.6 million increase over
September 30, 2017. Nonaccrual loan additions totaled $5.6 million in the
fourth quarter of 2017 compared to $2.4 million for the third quarter of 2017.
The balance of OREO totaled $3.9 million at December 31, 2017, a decrease of
$2.0 million from September 30, 2017. For the fourth quarter of 2017, we added
properties totaling $0.4 million, sold properties totaling $2.2 million, and
recorded valuation adjustments totaling $0.2 million. Nonperforming assets
represented 0.38% of total assets at December 31, 2017 compared to 0.45% at
September 30, 2017.
Average total deposits were $2.378 billion for the fourth quarter
of 2017, an increase of $49.2 million, or 2.1%, over the third quarter of 2017
and reflected growth in all deposit products except money market accounts and
certificates of deposit. The seasonal inflow of public fund balances began
late in the fourth quarter of 2017, and is expected to peak during the first
quarter of 2018 for this cycle. Average borrowings decreased $2.5 million
compared to the third quarter of 2017 due to payoffs of FHLB advances.
ACCOUNTING POLICIES
Critical Accounting Policies
The consolidated financial statements and
accompanying Notes to Consolidated Financial Statements are prepared in
accordance with accounting principles generally accepted in the United States
of America, which require us to make various estimates and assumptions (see
Note 1 in the Notes to Consolidated Financial Statements). We
believe that, of our significant accounting policies, the following may involve
a higher degree of judgment and complexity.
Allowance for Loan Losses. The allowance for loan losses
is a reserve established through a provision for loan losses charged to
expense, which represents management’s best estimate of probable losses within
the existing portfolio of loans. The allowance is the amount
considered adequate to absorb losses inherent in the loan portfolio based on
management’s evaluation of credit risk as of the balance sheet date.
The allowance for loan losses includes
allowance allocations calculated in accordance with U.S. GAAP. The
level of the allowance reflects management’s continuing evaluation of specific
credit risks, loss experience, loan portfolio quality, economic conditions and
unidentified losses inherent in the current loan portfolio, as well as trends
in the foregoing. This evaluation is inherently subjective, as it
requires estimates that are susceptible to significant revision as information
becomes available.
The Company’s allowance for loan losses
consists of two components: (i) specific reserves established for probable
losses on impaired loans; and (ii) general reserves for non-homogenous
loans not deemed impaired and homogenous loan pools based on, but not limited
to, historical loan loss experience, current economic and market conditions,
levels of past due loans, and levels of problem loans.
Our financial results are affected by the
changes in and the absolute level of the allowance for loan losses. This
estimation process is judgmental and requires an estimate of the loss severity
rates that we apply to our unimpaired loan portfolio.
Goodwill. Goodwill represents the excess of the cost of
acquired businesses over the fair market value of their identifiable net
assets. We perform an impairment review on an annual basis or more
frequently if events or changes in circumstances indicate that the carrying
value may not be recoverable. Adverse changes in the economic
environment, declining operations, or other factors could result in a decline
in the estimated implied fair value of goodwill. If the estimated implied fair
value of goodwill is less than the carrying amount, a loss would be recognized
to reduce the carrying amount to the estimated implied fair value.
We evaluate goodwill for
impairment on an annual basis and in 2017 adopted ASU 2017-04, Intangibles –
Goodwill and Other (Topic 350): Simplifying Accounting for Goodwill Impairment
in 2017 which requires a qualitative assessment of goodwill impairment
indicators. If the assessment indicates that impairment has more than likely
occurred, the Company must compare the estimated fair value of the reporting
unit to its carrying amount. If the carrying amount of the reporting unit
exceeds its estimated fair value, an impairment charge is recorded equal to the
excess.
During the fourth quarter, we
performed our annual impairment testing. We proceeded with qualitative
assessment by evaluating impairment indicators and concluded that a below peer
return on average assets warranted movement to a fair value assessment. We
estimated the fair value of the reporting unit utilizing a market approach that
was supplemented with a reconciliation of the resulting equity value of the
Company with our market capitalization. The market approach utilized the
guideline company valuation (“GLC”) method to determine the overall equity
valuation. A book and tangible book multiple was developed to determine a
market value of equity on a controlling basis. The multiples that resulted
from the GLC method were validated by comparing to peer companies. A control
premium was then applied to the minority value to calculate a fair value indication
for the Company. The control premium selected was validated by reviewing
recent bank merger and acquisition transactions. Based on the outcome of the
fair value assessment, the estimated fair value of our reporting unit exceeded
the carrying value of goodwill and therefore, no impairment existed at December
31, 2017. For the fair value assessment, both economic conditions and observable
bank purchase transactions can impact the outcome of the market valuation
approach.
Pension Assumptions. We have a defined benefit
pension plan for the benefit of substantially all of our associates. Our
funding policy with respect to the pension plan is to contribute amounts to the
plan sufficient to meet minimum funding requirements as set by
law. Pension expense, which is included in the Consolidated
Statements of Operations in noninterest expense as “Compensation,” is
determined by an external actuarial valuation based on assumptions that are
evaluated annually as of December 31, the measurement date for the pension
obligation. The Consolidated Statements of Financial Condition reflect
an accrued pension benefit cost due to funding levels and unrecognized
actuarial amounts. The most significant assumptions used in
calculating the pension obligation are the weighted-average discount rate used
to determine the present value of the pension obligation, the weighted-average
expected long-term rate of return on plan assets, and the assumed rate of
annual compensation increases. These assumptions are re-evaluated
annually with the external actuaries, taking into consideration both current
market conditions and anticipated long-term market conditions.
The weighted-average
discount rate is determined by matching the anticipated defined pension plan
cash flows to a long-term corporate Aa-rated bond index and solving for the
underlying rate of return, which investing in such securities would
generate. This methodology is applied consistently from
year-to-year. The discount rate utilized in 2017 was 4.10%. The
estimated impact to 2017 pension expense of a 25 basis point increase or
decrease in the discount rate would have been a decrease and increase of
approximately $744,000 and $784,000, respectively. We anticipate
using a 3.71% discount rate in 2018.
The weighted-average expected long-term
rate of return on plan assets is determined based on the current and
anticipated future mix of assets in the plan. The assets currently
consist of equity securities, U.S. Government and Government agency debt
securities, and other securities (typically temporary liquid funds awaiting
investment). The weighted-average expected long-term rate of return
on plan assets utilized for 2017 was 7.25%. The estimated impact to
2017 pension expense of a 25 basis point increase or decrease in the rate of
return would have been an approximate $275,000 increase or decrease,
respectively. We anticipate using a rate of return on plan assets
for 2018 of 7.25%.
The assumed rate of annual compensation
increases of 3.25% in 2017 reflected expected trends in salaries and the
employee base. We anticipate using a compensation increase of 3.25%
for 2018 reflecting current market trends.
Effective
December 31, 2015, we changed the method used to estimate the service and
interest components of net periodic benefit cost for the defined benefit plan.
Detailed information on the pension plan, the actuarially determined
disclosures, and the assumptions used are provided in Note 12 of the Notes to
Consolidated Financial Statements.
Income Taxes.
Income tax expense is the total of the current year income tax due or
refundable and the change in deferred tax assets and liabilities.
Deferred tax assets and liabilities are the expected future tax amounts
for the temporary differences between carrying amounts and tax bases of assets
and liabilities, computed using enacted tax rates. A valuation allowance,
if needed, reduces deferred tax assets to the amount expected to be realized.
A tax position is recognized as a benefit only if it is “more likely than not”
that the tax position would be sustained in a tax examination, with a tax
examination being presumed to occur. The amount recognized is the largest
amount of tax benefit that is greater than 50% likely of being realized on
examination. For tax positions not meeting the “more likely than not”
test, no tax benefit is recorded.
The Company recognizes interest and/or penalties related to income tax matters
in other expenses.
Recent Accounting Pronouncements
The Financial Accounting Standards Board,
the SEC, and other regulatory bodies have enacted new accounting pronouncements
and standards that either have impacted our results in prior years presented,
or will likely impact our results in 2018. Please refer to Note 1 of the Notes
to our Consolidated Financial Statements.
ITEM 7A. QUANTITATIVE AND QUALITATIVE DISCLOSURE
ABOUT MARKET RISK
See “Financial Condition - Market Risk and Interest Rate
Sensitivity” in Management’s Discussion and Analysis of Financial Condition and
Results of Operations, above, which is incorporated herein by reference.
|
Item
8. Financial Statements and Supplementary Data
|
|
|
|
|
|
|
|
|
|
|
|
|
|
|
|
|
|
|
|
|
|
|
|
|
|
|
|
|
|
|
|
|
|
|
|
|
|
|
|
|
Table 16
|
|
|
|
|
|
|
|
|
|
|
|
|
|
|
|
|
|
|
|
|
|
|
|
|
|
QUARTERLY FINANCIAL DATA (Unaudited)
|
|
|
|
|
|
|
|
|
|
|
|
|
|
|
|
|
|
|
|
|
|
|
|
|
|
|
|
|
|
|
|
|
|
|
|
|
|
|
|
|
|
2017
|
|
2016
|
|
|
(Dollars in Thousands, Except
Per Share Data)
|
Fourth
|
|
Third
|
|
Second
|
|
First
|
|
|
Fourth
|
|
|
Third
|
|
|
Second
|
|
|
First
|
|
|
Summary of Operations:
|
|
|
|
|
|
|
|
|
|
|
|
|
|
|
|
|
|
|
|
|
|
|
|
|
|
Interest Income
|
$
|
22,627
|
|
$
|
22,341
|
|
$
|
21,422
|
|
$
|
20,540
|
|
$
|
20,832
|
|
$
|
20,104
|
|
$
|
20,174
|
|
$
|
20,044
|
|
|
Interest Expense
|
|
1,138
|
|
|
1,080
|
|
|
926
|
|
|
804
|
|
|
773
|
|
|
784
|
|
|
798
|
|
|
834
|
|
|
Net Interest Income
|
|
21,489
|
|
|
21,261
|
|
|
20,496
|
|
|
19,736
|
|
|
20,059
|
|
|
19,320
|
|
|
19,376
|
|
|
19,210
|
|
|
Provision for Loan Losses
|
|
826
|
|
|
490
|
|
|
589
|
|
|
310
|
|
|
464
|
|
|
-
|
|
|
(97)
|
|
|
452
|
|
|
Net Interest Income After
Provision for Loan Losses
|
|
20,663
|
|
|
20,771
|
|
|
19,907
|
|
|
19,426
|
|
|
19,595
|
|
|
19,320
|
|
|
19,473
|
|
|
18,758
|
|
|
Noninterest Income(1)
|
|
12,897
|
|
|
12,996
|
|
|
13,135
|
|
|
12,718
|
|
|
12,778
|
|
|
13,011
|
|
|
15,215
|
|
|
12,677
|
|
|
Noninterest Expense
|
|
26,897
|
|
|
26,707
|
|
|
27,921
|
|
|
27,922
|
|
|
27,560
|
|
|
28,022
|
|
|
28,702
|
|
|
28,930
|
|
|
Income Before Income Taxes
|
|
6,663
|
|
|
7,060
|
|
|
5,121
|
|
|
4,222
|
|
|
4,813
|
|
|
4,309
|
|
|
5,986
|
|
|
2,505
|
|
|
Income Tax Expense(2)
|
|
6,660
|
|
|
2,505
|
|
|
1,560
|
|
|
1,478
|
|
|
1,517
|
|
|
1,436
|
|
|
2,056
|
|
|
858
|
|
|
Net Income
|
|
3
|
|
|
4,555
|
|
|
3,561
|
|
|
2,744
|
|
|
3,296
|
|
|
2,873
|
|
|
3,930
|
|
|
1,647
|
|
|
Net Interest Income (FTE)
|
$
|
21,808
|
|
$
|
21,595
|
|
$
|
20,799
|
|
$
|
20,006
|
|
$
|
20,335
|
|
$
|
19,603
|
|
$
|
19,617
|
|
$
|
19,421
|
|
|
|
|
|
|
|
|
|
|
|
|
|
|
|
|
|
|
|
|
|
|
|
|
|
|
|
|
Per Common Share:
|
|
|
|
|
|
|
|
|
|
|
|
|
|
|
|
|
|
|
|
|
|
|
|
|
|
Basic Net Income
|
$
|
0.00
|
|
$
|
0.27
|
|
$
|
0.21
|
|
$
|
0.16
|
|
$
|
0.20
|
|
$
|
0.18
|
|
$
|
0.22
|
|
$
|
0.10
|
|
|
Diluted Net Income
|
|
0.00
|
|
|
0.27
|
|
|
0.21
|
|
|
0.16
|
|
|
0.20
|
|
|
0.17
|
|
|
0.22
|
|
|
0.10
|
|
|
Cash Dividends Declared
|
|
0.07
|
|
|
0.07
|
|
|
0.05
|
|
|
0.05
|
|
|
0.05
|
|
|
0.04
|
|
|
0.04
|
|
|
0.04
|
|
|
Diluted Book Value
|
|
16.65
|
|
|
16.73
|
|
|
16.54
|
|
|
16.38
|
|
|
16.23
|
|
|
16.39
|
|
|
16.31
|
|
|
16.04
|
|
|
Market Price:
|
|
|
|
|
|
|
|
|
|
|
|
|
|
|
|
|
|
|
|
|
|
|
|
|
|
High
|
|
26.01
|
|
|
24.58
|
|
|
22.39
|
|
|
21.79
|
|
|
23.15
|
|
|
15.35
|
|
|
15.96
|
|
|
15.88
|
|
|
Low
|
|
22.21
|
|
|
19.60
|
|
|
17.68
|
|
|
19.22
|
|
|
14.29
|
|
|
13.32
|
|
|
13.16
|
|
|
12.83
|
|
|
Close
|
|
22.94
|
|
|
24.01
|
|
|
20.42
|
|
|
21.39
|
|
|
20.48
|
|
|
14.77
|
|
|
13.92
|
|
|
14.59
|
|
|
|
|
|
|
|
|
|
|
|
|
|
|
|
|
|
|
|
|
|
|
|
|
|
|
|
|
Selected Average Balances:
|
|
|
|
|
|
|
|
|
|
|
|
|
|
|
|
|
|
|
|
|
|
|
|
|
|
Loans, Net
|
$
|
1,640,738
|
|
$
|
1,638,578
|
|
$
|
1,608,629
|
|
$
|
1,585,561
|
|
$
|
1,573,264
|
|
$
|
1,555,889
|
|
$
|
1,531,777
|
|
$
|
1,507,508
|
|
|
Earning Assets
|
|
2,511,985
|
|
|
2,466,287
|
|
|
2,502,030
|
|
|
2,529,207
|
|
|
2,423,388
|
|
|
2,417,943
|
|
|
2,447,777
|
|
|
2,440,718
|
|
|
Total Assets
|
|
2,822,451
|
|
|
2,779,960
|
|
|
2,817,479
|
|
|
2,845,140
|
|
|
2,743,463
|
|
|
2,734,465
|
|
|
2,767,854
|
|
|
2,763,746
|
|
|
Deposits
|
|
2,378,411
|
|
|
2,329,162
|
|
|
2,373,423
|
|
|
2,407,278
|
|
|
2,306,917
|
|
|
2,288,741
|
|
|
2,276,553
|
|
|
2,258,600
|
|
|
Shareowners’ Equity
|
|
288,044
|
|
|
285,296
|
|
|
281,661
|
|
|
278,489
|
|
|
278,943
|
|
|
277,407
|
|
|
279,532
|
|
|
277,464
|
|
|
Common Equivalent Average Shares:
|
|
|
|
|
|
|
|
|
|
|
|
|
|
|
|
|
|
|
|
|
|
|
|
|
|
Basic
|
|
16,967
|
|
|
16,965
|
|
|
16,955
|
|
|
16,919
|
|
|
16,809
|
|
|
16,804
|
|
|
17,144
|
|
|
17,202
|
|
|
Diluted
|
|
17,050
|
|
|
17,044
|
|
|
17,016
|
|
|
16,944
|
|
|
16,913
|
|
|
16,871
|
|
|
17,196
|
|
|
17,235
|
|
|
|
|
|
|
|
|
|
|
|
|
|
|
|
|
|
|
|
|
|
|
|
|
|
|
|
|
Performance Ratios:
|
|
|
|
|
|
|
|
|
|
|
|
|
|
|
|
|
|
|
|
|
|
|
|
|
|
Return on Average Assets
|
|
0.00
|
%
|
|
0.65
|
%
|
|
0.51
|
%
|
|
0.39
|
%
|
|
0.48
|
%
|
|
0.42
|
%
|
|
0.57
|
%
|
|
0.24
|
%
|
|
Return on Average Equity
|
|
0.00
|
|
|
6.33
|
|
|
5.07
|
|
|
4.00
|
|
|
4.70
|
|
|
4.12
|
|
|
5.65
|
|
|
2.39
|
|
|
Net Interest Margin (FTE)
|
|
3.45
|
|
|
3.48
|
|
|
3.33
|
|
|
3.21
|
|
|
3.34
|
|
|
3.23
|
|
|
3.22
|
|
|
3.20
|
|
|
Noninterest Income as % of Operating Revenue
|
|
37.51
|
|
|
37.94
|
|
|
39.05
|
|
|
39.19
|
|
|
38.91
|
|
|
40.24
|
|
|
43.99
|
|
|
39.76
|
|
|
Efficiency Ratio
|
|
77.50
|
|
|
77.21
|
|
|
82.28
|
|
|
85.33
|
|
|
83.23
|
|
|
85.92
|
|
|
82.40
|
|
|
90.13
|
|
|
|
|
|
|
|
|
|
|
|
|
|
|
|
|
|
|
|
|
|
|
|
|
|
|
|
|
Asset Quality:
|
|
|
|
|
|
|
|
|
|
|
|
|
|
|
|
|
|
|
|
|
|
|
|
|
|
Allowance for Loan Losses
|
$
|
13,307
|
|
$
|
13,339
|
|
$
|
13,242
|
|
$
|
13,335
|
|
$
|
13,431
|
|
$
|
13,744
|
|
$
|
13,677
|
|
$
|
13,613
|
|
|
Allowance for Loan Losses to Loans
|
|
0.80
|
%
|
|
0.82
|
%
|
|
0.81
|
%
|
|
0.84
|
%
|
|
0.86
|
%
|
|
0.88
|
%
|
|
0.89
|
%
|
|
0.90
|
%
|
|
Nonperforming Assets ("NPA's")
|
|
11,100
|
|
|
12,545
|
|
|
15,934
|
|
|
17,799
|
|
|
19,171
|
|
|
21,352
|
|
|
22,836
|
|
|
26,499
|
|
|
NPA’s to Total Assets
|
|
0.38
|
|
|
0.45
|
|
|
0.57
|
|
|
0.61
|
|
|
0.67
|
|
|
0.78
|
|
|
0.83
|
|
|
0.95
|
|
|
NPA’s to Loans plus ORE
|
|
0.67
|
|
|
0.76
|
|
|
0.97
|
|
|
1.11
|
|
|
1.21
|
|
|
1.35
|
|
|
1.48
|
|
|
1.73
|
|
|
Allowance to Non-Performing Loans
|
|
185.87
|
|
|
203.39
|
|
|
166.23
|
|
|
160.70
|
|
|
157.40
|
|
|
159.56
|
|
|
166.50
|
|
|
150.44
|
|
|
Net Charge-Offs to Average Loans
|
|
0.21
|
|
|
0.10
|
|
|
0.17
|
|
|
0.10
|
|
|
0.20
|
|
|
(0.02)
|
|
|
(0.04)
|
|
|
0.21
|
|
|
|
|
|
|
|
|
|
|
|
|
|
|
|
|
|
|
|
|
|
|
|
|
|
|
|
|
Capital Ratios:
|
|
|
|
|
|
|
|
|
|
|
|
|
|
|
|
|
|
|
|
|
|
|
|
|
|
Tier 1 Capital
|
|
16.33
|
%
|
|
16.19
|
%
|
|
15.58
|
%
|
|
15.68
|
%
|
|
15.51
|
%
|
|
15.48
|
%
|
|
15.63
|
%
|
|
16.39
|
%
|
|
Total Capital
|
|
17.10
|
|
|
16.96
|
|
|
16.32
|
|
|
16.44
|
|
|
16.28
|
|
|
16.28
|
|
|
16.44
|
|
|
17.20
|
|
|
Common Equity Tier 1 Capital
|
|
13.42
|
|
|
13.26
|
|
|
12.72
|
|
|
12.77
|
|
|
12.61
|
|
|
12.55
|
|
|
12.65
|
|
|
12.82
|
|
|
Leverage
|
|
10.47
|
|
|
10.48
|
|
|
10.20
|
|
|
9.95
|
|
|
10.23
|
|
|
10.12
|
|
|
9.98
|
|
|
10.34
|
|
|
Tangible Common Equity(3)
|
|
7.09
|
|
|
7.41
|
|
|
7.21
|
|
|
6.88
|
|
|
6.90
|
|
|
7.19
|
|
|
7.08
|
|
|
7.09
|
|
|
|
|
|
|
|
|
|
|
|
|
|
|
|
|
|
|
|
|
|
|
|
|
|
|
|
|
(1) Includes $2.5 million gain on partial
retirement of trust preferred securities in the second quarter, 2016.
|
|
|
(2) For fourth quarter 2017, includes $4.1
million, or $0.24 per diluted share, income tax expense adjustment related to
the Tax Cuts and Jobs Act of 2017.
|
|
|
(3) Tangible common equity ratio is a
non-GAAP financial measure. For additional information, including a
reconciliation to GAAP, refer to page 31.
|
|
CAPITAL CITY BANK
GROUP, INC.
CONSOLIDATED
FINANCIAL STATEMENTS
|
PAGE
|
|
|
|
|
|
65
|
Report
of Independent Registered Certified Public Accounting Firm
|
|
|
|
|
66
|
Consolidated
Statements of Financial Condition
|
|
|
|
|
67
|
Consolidated
Statements of Income
|
|
|
|
|
68
|
Consolidated
Statements of Comprehensive Income
|
|
|
|
|
69
|
Consolidated
Statements of Changes in Shareowners’ Equity
|
|
|
|
|
70
|
Consolidated
Statements of Cash Flows
|
|
|
|
|
71
|
Notes
to Consolidated Financial Statements
|
|
|
Ernst & Young
LLP
One Tampa City
Center
Suite 2400
201 North Franklin
Street
Tampa, Florida 33602
|
Tel: +1 813 225 4800
Fax: +1 813 225 4711
ey.com
|
|

Report of Independent Registered Certified Public
Accounting Firm
To
the Shareowners and Board of Directors of
Capital
City Bank Group, Inc.
Opinion
on the Financial Statements
We have
audited the accompanying consolidated statements of financial condition of
Capital City Bank Group, Inc. (the Company) as of December 31, 2017 and 2016,
and the related consolidated statements of income, comprehensive income,
changes in shareowners’ equity, and cash flows for each of the three years
in the period ended December 31, 2017, and the related notes (collectively
referred to as the “financial statements”). In our opinion, the financial
statements present fairly, in all material respects, the consolidated financial
position of the Company at December 31, 2017 and 2016, and the consolidated
results of its operations and its cash flows for each of the three years in the
period ended December 31, 2017, in conformity with U.S. generally accepted
accounting principles.
We also
have audited, in accordance with the standards of the Public Company Accounting
Oversight Board (United States) (PCAOB), the Company’s internal control
over financial reporting as of December 31, 2017, based on criteria established
in Internal Control-Integrated Framework issued by the Committee of Sponsoring
Organizations of the Treadway Commission (2013 framework) and our report dated March 5, 2018 expressed
an unqualified
opinion thereon.
Basis
for Opinion
These
financial statements are the responsibility of the Company’s management. Our
responsibility is to express an opinion on the Company’s financial statements
based on our audits. We are a public accounting firm registered with the PCAOB
and are required to be independent with respect to the Company in accordance
with the U.S. federal securities laws and the applicable rules and regulations
of the Securities and Exchange Commission and the PCAOB.
We
conducted our audits in accordance with the standards of the PCAOB. Those
standards require that we plan and perform the audit to obtain reasonable
assurance about whether the financial statements are free of material
misstatement, whether due to error or fraud. Our audits included performing
procedures to assess the risks of material misstatement of the financial
statements, whether due to error or fraud, and performing procedures that
respond to those risks. Such procedures included examining, on a test basis,
evidence regarding the amounts and disclosures in the financial statements. Our
audits also included evaluating the accounting principles used and significant
estimates made by management, as well as evaluating the overall presentation of
the financial statements. We believe that our audits provide a reasonable basis
for our opinion.

We have served as the Company’s auditor since 2007.
Tampa, Florida
March 5, 2018
|
CAPITAL CITY BANK GROUP, INC.
|
|
CONSOLIDATED STATEMENTS
OF FINANCIAL CONDITION
|
|
|
|
|
|
|
|
|
|
|
|
|
|
|
|
|
As of December 31,
|
|
(Dollars in Thousands)
|
2017
|
|
2016
|
|
ASSETS
|
|
|
|
|
|
|
Cash and Due From Banks
|
$
|
58,419
|
|
$
|
48,268
|
|
Federal Funds Sold and Interest Bearing Deposits
|
|
227,023
|
|
|
247,779
|
|
Total Cash and Cash Equivalents
|
|
285,442
|
|
|
296,047
|
|
|
|
|
|
|
|
|
Investment Securities, Available for Sale, at fair value
|
|
480,911
|
|
|
522,734
|
|
Investment Securities, Held to Maturity, at amortized cost (fair
value of $215,007 and $176,746)
|
|
216,679
|
|
|
177,365
|
|
Total Investment Securities
|
|
697,590
|
|
|
700,099
|
|
|
|
|
|
|
|
|
Loans Held For Sale
|
|
4,817
|
|
|
10,886
|
|
|
|
|
|
|
|
|
Loans, Net of Unearned Income
|
|
1,653,492
|
|
|
1,561,289
|
|
Allowance for Loan Losses
|
|
(13,307)
|
|
|
(13,431)
|
|
Loans, Net
|
|
1,640,185
|
|
|
1,547,858
|
|
|
|
|
|
|
|
|
Premises and Equipment, Net
|
|
91,698
|
|
|
95,476
|
|
Goodwill
|
|
84,811
|
|
|
84,811
|
|
Other Real Estate Owned
|
|
3,941
|
|
|
10,638
|
|
Other Assets
|
|
90,310
|
|
|
99,382
|
|
Total Assets
|
$
|
2,898,794
|
|
$
|
2,845,197
|
|
|
|
|
|
|
|
|
LIABILITIES
|
|
|
|
|
|
|
Deposits:
|
|
|
|
|
|
|
Noninterest Bearing Deposits
|
$
|
874,583
|
|
$
|
791,182
|
|
Interest Bearing Deposits
|
|
1,595,294
|
|
|
1,621,104
|
|
Total Deposits
|
|
2,469,877
|
|
|
2,412,286
|
|
|
|
|
|
|
|
|
Short-Term Borrowings
|
|
7,480
|
|
|
12,749
|
|
Subordinated Notes Payable
|
|
52,887
|
|
|
52,887
|
|
Other Long-Term Borrowings
|
|
13,967
|
|
|
14,881
|
|
Other Liabilities
|
|
70,373
|
|
|
77,226
|
|
Total Liabilities
|
|
2,614,584
|
|
|
2,570,029
|
|
|
|
|
|
|
|
|
SHAREOWNERS’ EQUITY
|
|
|
|
|
|
|
Preferred Stock, $.01 par value; 3,000,000 shares authorized; no
shares issued and outstanding
|
|
-
|
|
|
-
|
|
Common Stock, $.01 par value; 90,000,000 shares authorized;
16,988,951 and 16,844,698
shares issued and outstanding at December 31, 2017 and
December 31, 2016, respectively
|
|
170
|
|
|
168
|
|
Additional Paid-In Capital
|
|
36,674
|
|
|
34,188
|
|
Retained Earnings
|
|
279,410
|
|
|
267,037
|
|
Accumulated Other Comprehensive Loss, Net of Tax
|
|
(32,044)
|
|
|
(26,225)
|
|
Total Shareowners’ Equity
|
|
284,210
|
|
|
275,168
|
|
Total Liabilities and Shareowners’ Equity
|
$
|
2,898,794
|
|
$
|
2,845,197
|
|
|
|
|
|
|
|
|
The accompanying Notes to Consolidated Financial
Statements are an integral part of these statements.
|
|
CAPITAL CITY BANK GROUP, INC.
|
|
CONSOLIDATED STATEMENTS
OF INCOME
|
|
|
|
|
|
|
|
|
|
|
|
|
|
|
For the Years Ended
December 31,
|
|
(Dollars in Thousands, Except Per Share Data)
|
|
2017
|
|
2016
|
|
2015
|
|
INTEREST INCOME
|
|
|
|
|
|
|
|
|
|
|
Loans, including Fees
|
|
$
|
75,717
|
|
$
|
72,867
|
|
$
|
73,169
|
|
Investment Securities:
|
|
|
|
|
|
|
|
|
|
|
Taxable
|
|
|
8,095
|
|
|
6,317
|
|
|
5,224
|
|
Tax Exempt
|
|
|
1,052
|
|
|
866
|
|
|
633
|
|
Funds Sold
|
|
|
2,066
|
|
|
1,104
|
|
|
632
|
|
Total Interest Income
|
|
|
86,930
|
|
|
81,154
|
|
|
79,658
|
|
|
|
|
|
|
|
|
|
|
|
|
INTEREST EXPENSE
|
|
|
|
|
|
|
|
|
|
|
Deposits
|
|
|
1,789
|
|
|
879
|
|
|
944
|
|
Short-Term Borrowings
|
|
|
82
|
|
|
148
|
|
|
59
|
|
Subordinated Notes Payable
|
|
|
1,634
|
|
|
1,434
|
|
|
1,368
|
|
Other Long-Term Borrowings
|
|
|
443
|
|
|
728
|
|
|
936
|
|
Total Interest Expense
|
|
|
3,948
|
|
|
3,189
|
|
|
3,307
|
|
|
|
|
|
|
|
|
|
|
|
|
NET INTEREST INCOME
|
|
|
82,982
|
|
|
77,965
|
|
|
76,351
|
|
Provision for Loan Losses
|
|
|
2,215
|
|
|
819
|
|
|
1,594
|
|
Net Interest Income After Provision for Loan Losses
|
|
|
80,767
|
|
|
77,146
|
|
|
74,757
|
|
|
|
|
|
|
|
|
|
|
|
|
NONINTEREST INCOME
|
|
|
|
|
|
|
|
|
|
|
Deposit Fees
|
|
|
20,335
|
|
|
21,332
|
|
|
22,608
|
|
Bank Card Fees
|
|
|
11,191
|
|
|
11,221
|
|
|
11,278
|
|
Wealth Management Fees
|
|
|
8,284
|
|
|
7,029
|
|
|
7,533
|
|
Mortgage Banking Fees
|
|
|
5,754
|
|
|
5,192
|
|
|
4,539
|
|
Other
|
|
|
6,182
|
|
|
8,907
|
|
|
8,133
|
|
Total Noninterest Income
|
|
|
51,746
|
|
|
53,681
|
|
|
54,091
|
|
|
|
|
|
|
|
|
|
|
|
|
NONINTEREST EXPENSE
|
|
|
|
|
|
|
|
|
|
|
Compensation
|
|
|
64,877
|
|
|
64,984
|
|
|
65,414
|
|
Occupancy, Net
|
|
|
17,837
|
|
|
18,296
|
|
|
17,738
|
|
Other Real Estate Owned, Net
|
|
|
1,135
|
|
|
3,649
|
|
|
4,971
|
|
Other
|
|
|
25,598
|
|
|
26,285
|
|
|
27,150
|
|
Total Noninterest Expense
|
|
|
109,447
|
|
|
113,214
|
|
|
115,273
|
|
|
|
|
|
|
|
|
|
|
|
|
INCOME BEFORE INCOME TAXES
|
|
|
23,066
|
|
|
17,613
|
|
|
13,575
|
|
Income Tax Expense
|
|
|
12,203
|
|
|
5,867
|
|
|
4,459
|
|
|
|
|
|
|
|
|
|
|
|
|
NET INCOME
|
|
$
|
10,863
|
|
$
|
11,746
|
|
$
|
9,116
|
|
|
|
|
|
|
|
|
|
|
|
|
BASIC NET INCOME PER SHARE
|
|
$
|
0.64
|
|
$
|
0.69
|
|
$
|
0.53
|
|
DILUTED NET INCOME PER SHARE
|
|
$
|
0.64
|
|
$
|
0.69
|
|
$
|
0.53
|
|
|
|
|
|
|
|
|
|
|
|
|
Average Basic Common Shares Outstanding
|
|
|
16,952
|
|
|
16,989
|
|
|
17,273
|
|
Average Diluted Common Shares Outstanding
|
|
|
17,013
|
|
|
17,061
|
|
|
17,318
|
|
|
|
|
|
|
|
|
|
|
|
|
The accompanying Notes to Consolidated Financial
Statements are an integral part of these statements.
|
|
CAPITAL CITY BANK GROUP, INC.
|
|
CONSOLIDATED STATEMENTS
OF COMPREHENSIVE INCOME
|
|
|
|
|
|
|
|
|
|
|
|
|
|
|
For the Years Ended
December 31,
|
|
(Dollars in Thousands)
|
|
2017
|
|
2016
|
|
2015
|
|
NET INCOME
|
|
$
|
10,863
|
|
$
|
11,746
|
|
$
|
9,116
|
|
Other comprehensive income (loss), before tax:
|
|
|
|
|
|
|
|
|
|
|
Investment Securities:
|
|
|
|
|
|
|
|
|
|
|
Change in net unrealized gain/loss on securities available for
sale
|
|
|
(1,459)
|
|
|
(828)
|
|
|
(373)
|
|
Amortization of unrealized losses on securities transferred from
available for sale to held to maturity
|
|
|
73
|
|
|
82
|
|
|
76
|
|
Total Investment Securities
|
|
|
(1,386)
|
|
|
(746)
|
|
|
(297)
|
|
Benefit Plans:
|
|
|
|
|
|
|
|
|
|
|
Reclassification adjustment for amortization of prior service
cost
|
|
|
223
|
|
|
278
|
|
|
316
|
|
Reclassification adjustment for amortization of net loss
|
|
|
4,409
|
|
|
3,960
|
|
|
3,743
|
|
Current year actuarial loss
|
|
|
(3,470)
|
|
|
(9,958)
|
|
|
(4,975)
|
|
Total Benefit Plans
|
|
|
1,162
|
|
|
(5,720)
|
|
|
(916)
|
|
Other comprehensive income (loss), before tax:
|
|
|
(224)
|
|
|
(6,466)
|
|
|
(1,213)
|
|
Deferred tax (expense) benefit related to other comprehensive
income
|
|
|
(14)
|
|
|
2,498
|
|
|
465
|
|
Other comprehensive income (loss), net of tax
|
|
|
(238)
|
|
|
(3,968)
|
|
|
(748)
|
|
TOTAL COMPREHENSIVE INCOME
|
|
$
|
10,625
|
|
$
|
7,778
|
|
$
|
8,368
|
|
|
|
|
|
|
|
|
|
|
|
|
The accompanying Notes to Consolidated Financial
Statements are an integral part of these statements.
|
|
|
CAPITAL CITY BANK GROUP, INC.
|
|
CONSOLIDATED STATEMENTS
OF CHANGES IN SHAREOWNERS' EQUITY
|
|
|
|
|
|
|
|
|
|
|
|
|
|
|
|
|
|
|
|
|
(Dollars in Thousands, Except Per Share Data)
|
|
Shares Outstanding
|
|
|
Common Stock
|
|
|
Additional Paid-In
Capital
|
|
|
Retained Earnings
|
|
|
Accumulated Other
Comprehensive Loss, Net of Taxes
|
|
|
Total
|
|
Balance, January 1, 2015
|
|
17,447,223
|
|
$
|
174
|
|
$
|
42,569
|
|
$
|
251,306
|
|
$
|
(21,509)
|
|
$
|
272,540
|
|
Net Income
|
|
|
|
|
-
|
|
|
-
|
|
|
9,116
|
|
|
-
|
|
|
9,116
|
|
Other Comprehensive Loss, Net of Tax
|
|
|
|
|
-
|
|
|
-
|
|
|
-
|
|
|
(748)
|
|
|
(748)
|
|
Cash Dividends ($0.13 per share)
|
|
|
|
|
-
|
|
|
-
|
|
|
(2,241)
|
|
|
-
|
|
|
(2,241)
|
|
Stock Compensation Expense
|
|
|
|
|
-
|
|
|
1,109
|
|
|
-
|
|
|
-
|
|
|
1,109
|
|
Impact of Transactions Under Compensation Plans, net
|
|
114,924
|
|
|
2
|
|
|
555
|
|
|
-
|
|
|
-
|
|
|
557
|
|
Repurchase of Common Stock
|
|
(405,228)
|
|
|
(4)
|
|
|
(5,977)
|
|
|
-
|
|
|
-
|
|
|
(5,981)
|
|
Balance, December 31, 2015
|
|
17,156,919
|
|
|
172
|
|
|
38,256
|
|
|
258,181
|
|
|
(22,257)
|
|
|
274,352
|
|
Net Income
|
|
|
|
|
-
|
|
|
-
|
|
|
11,746
|
|
|
-
|
|
|
11,746
|
|
Other Comprehensive Loss, Net of Tax
|
|
|
|
|
-
|
|
|
-
|
|
|
-
|
|
|
(3,968)
|
|
|
(3,968)
|
|
Cash Dividends ($0.17 per share)
|
|
|
|
|
-
|
|
|
-
|
|
|
(2,890)
|
|
|
-
|
|
|
(2,890)
|
|
Stock Compensation Expense
|
|
|
|
|
-
|
|
|
1,260
|
|
|
-
|
|
|
-
|
|
|
1,260
|
|
Impact of Transactions Under Compensation Plans, net
|
|
123,240
|
|
|
-
|
|
|
980
|
|
|
-
|
|
|
-
|
|
|
980
|
|
Repurchase of Common Stock
|
|
(435,461)
|
|
|
(4)
|
|
|
(6,308)
|
|
|
-
|
|
|
-
|
|
|
(6,312)
|
|
Balance, December 31, 2016
|
|
16,844,698
|
|
|
168
|
|
|
34,188
|
|
|
267,037
|
|
|
(26,225)
|
|
|
275,168
|
|
Net Income
|
|
|
|
|
-
|
|
|
-
|
|
|
10,863
|
|
|
-
|
|
|
10,863
|
|
Other Comprehensive Loss, Net of Tax
|
|
|
|
|
-
|
|
|
-
|
|
|
-
|
|
|
(238)
|
|
|
(238)
|
|
Cash Dividends ($0.24 per share)
|
|
|
|
|
-
|
|
|
-
|
|
|
(4,071)
|
|
|
-
|
|
|
(4,071)
|
|
Stock Compensation Expense
|
|
|
|
|
-
|
|
|
1,502
|
|
|
-
|
|
|
-
|
|
|
1,502
|
|
Impact of Transactions Under Compensation Plans, net
|
|
144,253
|
|
|
2
|
|
|
984
|
|
|
-
|
|
|
-
|
|
|
986
|
|
Reclassification per Adoption of ASU No. 2018-02
|
|
|
|
|
-
|
|
|
-
|
|
|
5,581
|
|
|
(5,581)
|
|
|
-
|
|
Balance, December 31, 2017
|
|
16,988,951
|
|
$
|
170
|
|
$
|
36,674
|
|
$
|
279,410
|
|
$
|
(32,044)
|
|
$
|
284,210
|
|
|
|
|
|
|
|
|
|
|
|
|
|
|
|
|
|
|
|
|
The accompanying Notes to Consolidated Financial
Statements are an integral part of these statements.
|
|
|
|
|
|
|
|
CAPITAL CITY BANK GROUP, INC.
|
|
CONSOLIDATED STATEMENTS
OF CASH FLOWS
|
|
|
|
|
|
|
|
|
|
|
|
|
|
|
For the Years Ended
December 31,
|
|
(Dollars in Thousands)
|
|
2017
|
|
|
2016
|
|
2015
|
|
CASH FLOWS FROM OPERATING ACTIVITIES
|
|
|
|
|
|
|
|
|
|
|
Net Income
|
|
$
|
10,863
|
|
$
|
11,746
|
|
$
|
9,116
|
|
Adjustments to Reconcile Net Income to Cash Provided by
Operating Activities:
|
|
|
|
|
|
|
|
|
|
|
Provision for Loan Losses
|
|
|
2,215
|
|
|
819
|
|
|
1,594
|
|
Depreciation
|
|
|
6,558
|
|
|
6,975
|
|
|
6,586
|
|
Amortization of Premiums, Discounts, and Fees, net
|
|
|
6,626
|
|
|
6,219
|
|
|
5,182
|
|
Impairment Loss on Security
|
|
|
-
|
|
|
-
|
|
|
90
|
|
Gain on Retirement of Trust Preferred Securities
|
|
|
-
|
|
|
(2,487)
|
|
|
-
|
|
Net Increase (Decrease) in Loans Held-for-Sale
|
|
|
6,069
|
|
|
746
|
|
|
(944)
|
|
Stock Compensation
|
|
|
1,502
|
|
|
1,260
|
|
|
1,109
|
|
Net Tax Benefit from Stock Compensation
|
|
|
(223)
|
|
|
-
|
|
|
-
|
|
Deferred Income Taxes
|
|
|
7,576
|
|
|
3,457
|
|
|
3,847
|
|
Net Loss on Sales and Write-Downs of Other Real Estate
Owned
|
|
|
783
|
|
|
3,225
|
|
|
2,943
|
|
Loss on Disposal of Premises and Equipment
|
|
|
276
|
|
|
131
|
|
|
44
|
|
Net Decrease (Increase) in Other Assets
|
|
|
2,063
|
|
|
(18,374)
|
|
|
684
|
|
Net (Decrease) Increase in Other Liabilities
|
|
|
(5,531)
|
|
|
8,904
|
|
|
3,510
|
|
Net Cash Provided By Operating Activities
|
|
|
38,777
|
|
|
22,621
|
|
|
33,761
|
|
|
|
|
|
|
|
|
|
|
|
|
CASH FLOWS FROM INVESTING ACTIVITIES
|
|
|
|
|
|
|
|
|
|
|
Securities Held to Maturity:
|
|
|
|
|
|
|
|
|
|
|
Purchases
|
|
|
(98,861)
|
|
|
(50,001)
|
|
|
(66,021)
|
|
Payments, Maturities, and Calls
|
|
|
58,449
|
|
|
59,460
|
|
|
40,482
|
|
Securities Available for Sale:
|
|
|
|
|
|
|
|
|
|
|
Purchases
|
|
|
(163,469)
|
|
|
(192,005)
|
|
|
(190,756)
|
|
Payments, Maturities, and Calls
|
|
|
198,027
|
|
|
114,189
|
|
|
76,452
|
|
Purchase of Loans Held for Investment
|
|
|
(44,083)
|
|
|
-
|
|
|
-
|
|
Net Increase in Loans
|
|
|
(51,625)
|
|
|
(73,997)
|
|
|
(71,432)
|
|
Proceeds From Sales of Other Real Estate Owned
|
|
|
8,031
|
|
|
9,443
|
|
|
18,925
|
|
Purchases of Premises and Equipment, net
|
|
|
(3,997)
|
|
|
(4,450)
|
|
|
(4,703)
|
|
Net Cash Used In Investing Activities
|
|
|
(97,528)
|
|
|
(137,361)
|
|
|
(197,053)
|
|
|
|
|
|
|
|
|
|
|
|
|
CASH FLOWS FROM FINANCING ACTIVITIES
|
|
|
|
|
|
|
|
|
|
|
Net Increase in Deposits
|
|
|
57,591
|
|
|
109,437
|
|
|
156,055
|
|
Net (Decrease) Increase in Short-Term Borrowings
|
|
|
(2,489)
|
|
|
(52,666)
|
|
|
11,536
|
|
Redemption of Subordinated Notes
|
|
|
-
|
|
|
(7,500)
|
|
|
-
|
|
Repayment of Other Long-Term Borrowings
|
|
|
(3,694)
|
|
|
(9,027)
|
|
|
(2,735)
|
|
Dividends Paid
|
|
|
(4,071)
|
|
|
(2,890)
|
|
|
(2,241)
|
|
Payments to Repurchase Common Stock
|
|
|
-
|
|
|
(6,312)
|
|
|
(5,981)
|
|
Issuance of Common Stock Under Compensation Plans
|
|
|
809
|
|
|
840
|
|
|
507
|
|
Net Cash Provided By Financing Activities
|
|
|
48,146
|
|
|
31,882
|
|
|
157,141
|
|
|
|
|
|
|
|
|
|
|
|
|
NET DECREASE IN CASH AND CASH EQUIVALENTS
|
|
|
(10,605)
|
|
|
(82,858)
|
|
|
(6,151)
|
|
|
|
|
|
|
|
|
|
|
|
|
Cash and Cash Equivalents at Beginning of Year
|
|
|
296,047
|
|
|
378,905
|
|
|
385,056
|
|
Cash and Cash Equivalents at End of Year
|
|
$
|
285,442
|
|
$
|
296,047
|
|
$
|
378,905
|
|
|
|
|
|
|
|
|
|
|
|
|
Supplemental Cash Flow Disclosures:
|
|
|
|
|
|
|
|
|
|
|
Interest Paid
|
|
$
|
3,952
|
|
$
|
3,195
|
|
$
|
3,314
|
|
Income Taxes Paid (Refunded)
|
|
$
|
6,514
|
|
$
|
(330)
|
|
$
|
1,442
|
|
|
|
|
|
|
|
|
|
|
|
|
Noncash Investing and Financing Activities:
|
|
|
|
|
|
|
|
|
|
|
Loans Transferred to Other Real Estate Owned
|
|
$
|
2,384
|
|
$
|
4,016
|
|
$
|
5,752
|
|
|
|
|
|
|
|
|
|
|
|
|
The accompanying Notes to Consolidated Financial
Statements are an integral part of these statements.
|
|
Notes to Consolidated Financial Statements
Note 1
SIGNIFICANT ACCOUNTING POLICIES
Nature of Operations
Capital City Bank Group, Inc.
(“CCBG” or the “Company”) provides a full range of banking and banking-related
services to individual and corporate clients through its subsidiary, Capital
City Bank, with banking offices located in Florida, Georgia, and Alabama. The
Company is subject to competition from other financial institutions, is subject
to regulation by certain government agencies and undergoes periodic
examinations by those regulatory authorities.
Basis of Presentation
The consolidated financial statements
include the accounts of Capital City Bank Group, Inc. (“CCBG”), and its wholly owned subsidiary, Capital City
Bank (“CCB”
or the “Bank”
and together with CCBG, the “Company”). All material inter-company
transactions and accounts have been eliminated in consolidation.
The Company, which operates a single
reportable business segment that is comprised of commercial banking within the
states of Florida, Georgia, and Alabama, follows accounting principles generally
accepted in the United States of America and reporting practices applicable to
the banking industry. The principles which materially affect the
financial position, results of operations and cash flows are summarized below.
The Company determines whether it has a
controlling financial interest in an entity by first evaluating whether the
entity is a voting interest entity or a variable interest entity under
accounting principles generally accepted in the United States of America.
Voting interest entities are entities in which the total equity investment at
risk is sufficient to enable the entity to finance itself independently and
provide the equity holders with the obligation to absorb losses, the right to
receive residual returns and the right to make decisions about the entity’s
activities. The Company consolidates voting interest entities in
which it has all, or at least a majority of, the voting interest. As
defined in applicable accounting standards, variable interest entities
(“VIE’s”) are entities that lack one or more of the characteristics of a voting
interest entity. A controlling financial interest in an entity is
present when an enterprise has a variable interest, or a combination of
variable interests, that will absorb a majority of the entity’s expected
losses, receive a majority of the entity’s expected residual returns, or both.
The enterprise with a controlling financial interest, known as the primary beneficiary,
consolidates the VIE. CCBG's wholly owned subsidiaries, CCBG Capital
Trust I (established November 1, 2004) and CCBG Capital Trust II (established
May 24, 2005) are VIEs for which the Company is not the primary
beneficiary. Accordingly, the accounts of these entities are not
included in the Company’s consolidated financial statements.
Certain previously reported amounts have
been reclassified to conform to the current year’s presentation. The Company has evaluated subsequent events for potential
recognition and/or disclosure through the date the consolidated financial
statements included in this Annual Report on Form 10-K were filed with the
United States Securities and Exchange Commission.
Use of Estimates
The preparation of financial statements in
conformity with accounting principles generally accepted in the United States
of America requires management to make estimates and assumptions that affect
the reported amounts of assets and liabilities, the disclosure of contingent
assets and liabilities at the date of financial statements and the reported
amounts of revenues and expenses during the reporting period. Actual
results could vary from these estimates. Material estimates that are
particularly susceptible to significant changes in the near-term relate to the
determination of the allowance for loan losses, pension expense, income taxes,
loss contingencies, valuation of other real estate owned, and valuation of
goodwill and their respective analysis of impairment.
Cash and Cash Equivalents
Cash and cash equivalents include cash and
due from banks, interest-bearing deposits in other banks, and federal funds
sold. Generally, federal funds are purchased and sold for one-day periods
and all other cash equivalents have a maturity of 90 days or
less. The Company is required to maintain average reserve balances
with the Federal Reserve Bank based upon a percentage of deposits. The
average amounts of these required reserve balances for the years ended December
31, 2017 and 2016 were $18.8 million and $15.3 million, respectively.
Investment
Securities
Securities are classified as held to
maturity and carried at amortized cost when the Company has the positive intent
and ability to hold them until maturity. Securities not classified as held to
maturity or trading securities are classified as available for sale and carried
at fair value, with the unrealized holding gains and losses reported as a
component of other comprehensive income, net of tax. The Company determines
the appropriate classification of securities at the time of purchase.
Securities with limited marketability, such as stock in the Federal Reserve
Bank and the Federal Home Loan Bank, are carried at cost. Securities transferred from available for sale to held to
maturity are recorded at fair value at the time of transfer. The respective
gain or loss is reclassified as a separate component of other comprehensive
income and amortized as an adjustment to interest income over the remaining
life of the security.
Interest income includes amortization of
purchase premiums and discounts. Realized gains and losses are derived from
the amortized cost of the security sold. Declines in the fair value of
held-to-maturity and available-for-sale securities below their cost that are
deemed to be other than temporary are reflected in earnings as realized
losses. In estimating other-than-temporary impairment losses, the Company
considers, (i) whether it has decided to sell the security, (ii) whether it is
more likely than not that the Company will have to sell the security before its
market value recovers, and (iii) whether the present value of expected cash
flows is sufficient to recover the entire amortized cost basis. When assessing
the security’s expected cash flows, the Company considers, among other things,
(i) the length of time and the extent to which the fair value has been less
than cost and (ii) the financial condition and near-term prospects of the
issuer.
Loans Held For Sale
Certain residential mortgage loans are
originated for sale in the secondary mortgage loan
market. Additionally, certain other loans are periodically
identified to be sold. The Company has the ability and intent to
sell these loans and they are classified as loans held for sale and carried at
the lower of cost or estimated fair value. Fair value is determined
on the basis of rates quoted in the respective secondary market for the type of
loan held for sale. Loans are generally sold with servicing released
at a premium or discount from the carrying amount of the loans. Such premium or
discount is recognized as mortgage banking revenue at the date of
sale. Fixed commitments are generally used at the time loans are
originated or identified for sale to mitigate interest rate
risk. The fair value of fixed commitments to originate and sell
loans held for sale is not material.
Loans
Loans are stated at the principal amount
outstanding, net of unearned income. Interest income is accrued on the
effective yield method based on outstanding balances, and includes loan late
fees. Fees charged to originate loans and direct loan origination
costs are deferred and amortized over the life of the loan as a yield
adjustment.
The Company defines loans as past due when
one full payment is past due or a contractual maturity is over 30 days
late. The accrual of interest is generally suspended on loans more
than 90 days past due with respect to principal or interest. When a
loan is placed on nonaccrual status, all previously accrued and uncollected
interest is reversed against current income. Interest income on
nonaccrual loans is recognized when the ultimate collectability is no longer
considered doubtful. Loans are returned to
accrual status when the principal and interest amounts contractually due are
brought current or when future payments are reasonably assured.
Loan charge-offs on commercial and investor
real estate loans are recorded when the facts and circumstances of the
individual loan confirm the loan is not fully collectible and the loss is
reasonably quantifiable. Factors considered in making these determinations are
the borrower’s and any guarantor’s ability and willingness to pay, the status
of the account in bankruptcy court (if applicable), and collateral value.
Charge-off decisions for consumer loans are dictated by the Federal Financial
Institutions Examination Council’s (FFIEC) Uniform Retail Credit Classification
and Account Management Policy which establishes standards for the
classification and treatment of consumer loans, which generally require
charge-off after 120 days of delinquency.
Allowance for Loan Losses
The allowance for loan losses is a reserve
established through a provision for loan losses charged to expense, which
represents management’s best estimate of probable losses within the existing
portfolio of loans. The allowance is that amount considered adequate
to absorb losses inherent in the loan portfolio based on management’s
evaluation of credit risk as of the balance sheet date.
The allowance for loan losses includes
allowance allocations calculated in accordance with FASB ASC Topic 310 –
Receivables and ASC Topic 450 - Contingencies. The level of the
allowance reflects management’s continuing evaluation of specific credit risks,
loan loss experience, current loan portfolio quality, present economic
conditions and unidentified losses inherent in the current loan portfolio, as
well as trends in the foregoing. This evaluation is inherently
subjective, as it requires estimates that are susceptible to significant
revision as more information becomes available.
The Company’s allowance for loan losses consists of two components:
(i) specific reserves established for probable losses on impaired loans;
and (ii) general reserve for non-homogenous loans not deemed impaired and
homogenous loan pools based on, but not limited to, historical loan loss
experience, current economic conditions, levels of past due loans, and levels
of problem loans.
Loans are deemed to be impaired when,
based on current information and events, it is probable that the Company will
not be able to collect all amounts due (principal and interest payments),
according to the contractual terms of the loan agreement. Loans to borrowers
who are experiencing financial difficulties and whose loans were modified with
concessions are classified as troubled debt restructurings and measured for
impairment. Loans to borrowers that have filed Chapter 7 bankruptcy, but
continue to perform as agreed are classified as troubled debt restructurings
and measured for impairment.
Long-Lived Assets
Premises and equipment is stated at cost
less accumulated depreciation, computed on the straight-line method over the
estimated useful lives for each type of asset with premises being depreciated
over a range of 10 to 40 years, and equipment being depreciated over a range of
3 to 10 years. Additions, renovations and leasehold improvements to
premises are capitalized and depreciated over the lesser of the useful life or
the remaining lease term. Repairs and maintenance are charged to
noninterest expense as incurred.
Long-lived assets are evaluated for
impairment if circumstances suggest that their carrying value may not be
recoverable, by comparing the carrying value to estimated undiscounted cash
flows. If the asset is deemed impaired, an impairment charge is
recorded equal to the carrying value less the fair value.
Bank Owned Life Insurance (BOLI)
The Company, through its subsidiary bank, has purchased life
insurance policies on certain key officers. Bank owned life insurance is
recorded at the amount that can be realized under the insurance contract at the
balance sheet date, which is the cash surrender value adjusted for other
charges or other amounts due that are probable at settlement.
Goodwill
Goodwill represents the excess of the cost
of businesses acquired over the fair value of the net assets acquired. In
accordance with FASB ASC Topic 350, the Company determined it has one goodwill
reporting unit. Goodwill is tested for impairment annually during the fourth
quarter or on an interim basis if an event occurs or circumstances change that
would more likely than not reduce the fair value of the reporting unit below
its carrying value. See Note 5 – Goodwill for additional information.
Other Real Estate Owned
Assets acquired through, or in lieu of,
loan foreclosure are held for sale and are initially recorded at the lower of
cost or fair value less estimated selling costs, establishing a new cost basis.
Subsequent to foreclosure, valuations are periodically performed by
management and the assets are carried at the lower of carrying amount or fair
value less cost to sell. The valuation of foreclosed assets is subjective
in nature and may be adjusted in the future because of changes in economic conditions.
Revenue and expenses from operations and changes in value are included in
noninterest expense.
Loss Contingencies
Loss contingencies, including claims and
legal actions arising in the ordinary course of business are recorded as
liabilities when the likelihood of loss is probable and an amount or range of
loss can be reasonably estimated.
Revenue Recognition
The Company recognizes revenue as it is earned based
on contractual terms, as transactions occur, or as services are provided and
collectability is reasonably assured. Certain specific policies include the
following:
Deposit Fees. Deposit fees are primarily overdraft and
insufficient fund fees and monthly transaction-based fees. These fees are
recognized as earned or as transactions occur and services are provided.
Bank Card Fees. Bank card fees primarily
include interchange income from client use of consumer and business debit
cards. Interchange income is a fee paid by a merchant bank to the card-issuing
bank through the interchange network. Interchange fees are set by the credit
card associations and are based on cardholder purchase volumes. The Company
records interchange income as transactions occur.
Income
Taxes
Income tax
expense is the total of the current year income tax due or refundable and the
change in deferred tax assets and liabilities (excluding deferred tax assets
and liabilities related to business combinations or components of other
comprehensive income). Deferred tax assets and liabilities are the expected
future tax amounts for the temporary differences between carrying amounts and
tax bases of assets and liabilities, computed using enacted tax rates. A
valuation allowance, if needed, reduces deferred tax assets to the expected
amount most likely to be realized. Realization of deferred tax assets is dependent
upon the generation of a sufficient level of future taxable income and
recoverable taxes paid in prior years. The income tax effects related to
settlements of share-based payment awards are reported in earnings as an
increase or decrease in income tax expense. Prior to 2017, income tax benefits
at settlement of an award were reported as an increase or decrease to
additional paid-in capital to the extent that those benefits were greater than
(or less than) the income tax benefits recognized in earnings during the
award’s vesting period.
On December 22, 2017, H.R.1, commonly
known as the Tax Cuts and Jobs Act (the “Tax Act”), was signed into law. Among
other things, the Tax Act reduced the Company's corporate federal tax rate from
35% to 21% effective January 1, 2018. As a result, the Company was required to
re-measure, through income tax expense, its deferred tax assets and liabilities
using the enacted rate at which they are expected to be recovered or settled.
Further discussion is provided in Note 10 – Income Taxes.
The Company files a consolidated federal
income tax return and each subsidiary files a separate state income tax return.
Earnings Per Common Share
Basic earnings per common share is based
on net income divided by the weighted-average number of common shares
outstanding during the period excluding non-vested stock. Diluted
earnings per common share include the dilutive effect of stock options and
non-vested stock awards granted using the treasury stock method. A
reconciliation of the weighted-average shares used in calculating basic
earnings per common share and the weighted average common shares used in
calculating diluted earnings per common share for the reported periods is provided
in Note 13 — Earnings Per Share.
Comprehensive Income
Comprehensive income includes all changes
in shareowners’ equity during a period, except those resulting from
transactions with shareowners. Besides net income, other components
of the Company’s comprehensive income include the after tax effect of changes
in the net unrealized gain/loss on securities available for sale and changes in
the funded status of defined benefit and supplemental executive retirement
plans. Comprehensive income is reported in the accompanying
Consolidated Statements of Comprehensive Income and Changes in Shareowners’
Equity.
The Company elected to early adopt FASB
ASU 2018-02, Income Statement – Reporting Comprehensive Income (Topic 220): Reclassification
of Certain Tax Effects from Accumulated Other Comprehensive Income and
reclassify to retained earnings the stranded effects in accumulated other
comprehensive income related to the Tax Act. Further discussion is provided in
Note 15 – Other Comprehensive Income (Loss).
Stock Based Compensation
Compensation cost is recognized for
share-based awards issued to employees, based on the fair value of these awards
at the date of grant. Compensation cost is recognized over the requisite
service period, generally defined as the vesting period. The market price of
the Company’s common stock at the date of the grant is used for restricted
stock awards. For stock purchase plan awards, a Black-Scholes model is
utilized to estimate the fair value of the award. The impact of forfeitures of
share-based awards on compensation expense is recognized as forfeitures occur.
NEW AUTHORITATIVE ACCOUNTING
GUIDANCE
ASU 2014-09, “Revenue from Contracts with Customers (Topic
606).” ASU 2014-09
implements a common revenue standard that clarifies the principles for
recognizing revenue. The core principle of ASU 2014-09 is that an entity
should recognize revenue to depict the transfer of promised goods or services
to customers in an amount that reflects the consideration to which the entity
expects to be entitled in exchange for those goods or services. To achieve that
core principle, an entity should apply the following steps: (i) identify
the contract(s) with a customer, (ii) identify the performance obligations
in the contract, (iii) determine the transaction price, (iv) allocate
the transaction price to the performance obligations in the contract and (v)
recognize revenue when (or as) the entity satisfies a performance
obligation. A significant portion of the Company’s revenue is comprised
of net interest income on financial instruments, which is explicitly excluded
from the scope of ASU 2014-09. In addition to interest income, the
Company has various noninterest income revenue streams that required
assessment. The Company formed a revenue recognition working group that has
completed its scoping and walk-through of noninterest income revenue streams.
Amongst non-interest income revenue streams, mortgage banking fees are not in
the scope of the standard. Management has also completed its detailed
contract review for the remaining revenue streams. Management has determined
that ASU 2014-09 will not have a significant impact on its financial
statements. ASU 2014-09 is effective for the Company on January 1, 2018 and
must be retrospectively applied.
ASU 2016-01, “Financial
Instruments – Overall (Subtopic 825-10): Recognition and Measurement of
Financial Assets and Financial Liabilities”. ASU 2016-1, among other
things, (i) requires equity investments, with certain exceptions, to be
measured at fair value with changes in fair value recognized in net income,
(ii) simplifies the impairment assessment of equity investments without readily
determinable fair values by requiring a qualitative assessment to identify
impairment, (iii) eliminates the requirement for public business entities to
disclose the methods and significant assumptions used to estimate the fair
value that is required to be disclosed for financial instruments measured at
amortized cost on the balance sheet, (iv) requires public business entities to
use the exit price notion when measuring the fair value of financial
instruments for disclosure purposes, (v) requires an entity to present
separately in other comprehensive income the portion of the total change in the
fair value of a liability resulting from a change in the instrument-specific
credit risk when the entity has elected to measure the liability at fair value
in accordance with the fair value option for financial instruments, (vi)
requires separate presentation of financial assets and financial liabilities by
measurement category and form of financial asset on the balance sheet or the
accompanying notes to the financial statements and (viii) clarifies that an
entity should evaluate the need for a valuation allowance on a deferred tax
asset related to available-for-sale. ASU 2016-1 will be effective for the
Company on January 1, 2018 and is not expected to have a significant
impact on its financial statements.
ASU 2016-02, “Leases (Topic 842).” ASU 2016-02 requires the lease rights and
obligations arising from lease contracts, including existing and new
arrangements, to be recognized as assets and liabilities on the balance sheet. ASU 2016-02 is effective for the Company on
January 1, 2019 and is not expected to have a
significant impact on its financial statements.
ASU 2016-13, “Financial Instruments – Credit Losses (Topic 326):
Measurement of Credit Losses on Financial Statements.” ASU 2016-13 requires the measurement
of all expected credit losses for financial assets held at the reporting date
based on historical experience, current conditions, and reasonable and
supportable forecasts and requires enhanced disclosures related to the
significant estimates and judgments used in estimating credit losses, as well
as the credit quality and underwriting standards of an organization’s
portfolio. In addition, ASU 2016-13 amends the accounting for credit
losses on available-for-sale debt securities and purchased financial assets
with credit deterioration. ASU 2016-13 will be effective for the Company on
January 1, 2020. The Company is currently evaluating the potential impact of
ASU 2016-13 on its financial statements and related disclosures. As part of
its implementation efforts to date, management has formed a cross-functional
implementation team, developed a project plan, and selected a vendor to provide
a solution to assist in model development. The Company expects the new
guidance will result in an increase in the allowance for credit losses given
the change from accounting for losses inherent in the loan portfolio to
accounting for losses over the remaining expected life of the portfolio.
However, since the magnitude of the anticipated increase in the allowance for
credit losses will be impacted by economic conditions and trends in the
Company’s portfolio at the time of adoption, the quantitative impact cannot yet
be reasonably estimated.
ASU 2017-05, “Other Income-Gains and Losses
from the Derecognition of Nonfinancial Assets (Subtopic 610-20) - Clarifying
the Scope of Asset Derecognition Guidance and Accounting for Partial Sales of
Nonfinancial Asset.” ASU
2017-05 clarifies the scope of Subtopic 610-20 and adds guidance for
partial sales of nonfinancial assets, including partial sales of real estate. Historically, accounting
principles generally accepted in the United States (“GAAP”) contained several
different accounting models to evaluate whether the transfer of certain assets
qualified for sale treatment. ASU 2017-05 reduces the number of potential
accounting models that might apply and clarifies which model does apply in
various circumstances. ASU 2017-05 is effective for the Company on January 1,
2018 and is not expected to have a significant impact on its financial
statements.
ASU 2017-07, “Compensation – Retirement
Benefits (Topic 715).” ASU
2017-07 requires that an employer report the
service cost component in the same line item or items as other compensation
costs arising from services rendered by the pertinent employees during the
period. The other components of net benefit cost as defined in paragraphs
715-30-35-4 and 715-60-35-9 are required to be presented in the income
statement separately from the service cost component and outside a subtotal of
income from operations, if one is presented. If a separate line item or items
are used to present the other components of net benefit cost, that line item or
items must be appropriately described. If a separate line item or items are not
used, the line item or items used in the income statement to present the other
components of net benefit cost must be disclosed. ASU 2017-07 is effective for
the Company on January 1, 2018 and is not expected to have a significant impact
on its financial statements.
ASU 2017-09, “Compensation – Stock
Compensation (Topic 718).”
ASU 2017-09 clarifies when to account for a change to the terms or conditions
of a share-based payment award as a modification. Modification accounting is
required only if the fair value, or calculated intrinsic value if it is used to
measure the award, the vesting conditions, or the classification of the award
as equity or liability changes as a result of the change in terms or
conditions. ASU 2017-09 is effective for the Company on January 1, 2018 and is
not expected to have a significant impact on its financial statements.
ASU 2017-11, “Earnings Per Share
(Topic 260), Distinguishing Liabilities from Equity (Topic 480), Derivatives
and Hedging (Topic 815).” ASU 2017-11 has two parts (i) Accounting for
Certain Financial Instruments with Down Round Features and (ii) Replacement of
the Indefinite Deferral for Mandatorily Redeemable Financial Instruments of
Certain Nonpublic Entities and Certain Mandatorily Redeemable Noncontrolling
Interests with a Scope Exception. Part (i) changes the classification analysis
of certain equity-linked financial instruments with down round features. When
determining whether certain financial instruments should be classified as
liabilities or equity instruments, a down round feature no longer precludes
equity classification when assessing whether the instrument is indexed to an
entity’s own stock. The amendments also clarify existing disclosure
requirements for equity-classified instruments. Part (ii) re-characterizes the
indefinite deferral of certain provisions of Topic 480 that are now presented as
pending continent in the Codification, to a scope exception. Those amendments
do not have an accounting effect. ASU 2017-11 is effective for the Company on
January 1, 2019 and is not expected to have a significant impact on its
financial statements.
ASU 2017-12, “Derivatives and Hedging
(Topic 815).” ASU 2017-12 amends the
hedge accounting recognition and presentation requirements in ASC 815. The
amendments objectives are to (1) improve the transparency and understandability
of information conveyed to financial statement users about an entity’s
risk management activities by better aligning the entity’s financial
reporting for hedging relationships with those risk management activities
and (2) reduce the complexity of and to simplify the application of hedge
accounting by preparers. ASU 2017-12 is effective for the Company on January
1, 2019 and is not expected
to have a significant impact on its financial statements.
ASU 2018-02, “Income Statement – Reporting
Comprehensive Income (Topic 220): Reclassification of Certain Tax Effects from
Accumulated Other Comprehensive Income.” ASU 2018-02 allows a reclassification from accumulated other
comprehensive income to retained earnings for stranded tax effects resulting
from the Tax Cuts and Jobs Act. The amendments will improve the usefulness of
information reported to the users of the financial statements. The underlying guidance
that requires that the effect of a change in tax laws or rates be included in
income from continuing operations is not affected. The amendments in this update are effective
for all organizations for fiscal years beginning after December 15, 2018, and
interim periods within those fiscal years. Early adoption is permitted. ASU 2018-02 was early
adopted by the Company and is included in its financial statements as of
December 31, 2017. The adoption of this standard resulted in the
reclassification of $5.6 million from accumulated other comprehensive income to
retained earnings.
|
Note 2
|
|
INVESTMENT SECURITIES
|
|
|
|
|
|
|
|
|
|
|
|
|
|
|
|
|
|
|
|
|
|
|
|
|
|
|
|
|
|
|
|
|
|
|
|
|
|
|
|
|
|
|
|
|
|
|
|
|
|
Investment Portfolio Composition. The amortized cost and related market
value of investment securities available-for-sale and
|
|
held-to-maturity were as follows:
|
|
|
2017
|
|
|
2016
|
|
|
Amortized
|
|
Unrealized
|
Unrealized
|
Market
|
|
Amortized
|
|
Unrealized
|
Unrealized
|
Market
|
|
(Dollars in Thousands)
|
Cost
|
|
Gains
|
|
Losses
|
|
Value
|
|
Cost
|
|
Gain
|
|
Losses
|
|
Value
|
|
Available for Sale
|
|
|
|
|
|
|
|
|
|
|
|
|
|
|
|
|
|
|
|
|
|
|
|
|
U.S. Government Treasury
|
$
|
237,505
|
|
$
|
-
|
|
$
|
2,164
|
|
$
|
235,341
|
|
$
|
286,867
|
|
$
|
262
|
|
$
|
851
|
|
$
|
286,278
|
|
U.S. Government Agency
|
|
144,324
|
|
|
727
|
|
|
407
|
|
|
144,644
|
|
|
131,489
|
|
|
495
|
|
|
344
|
|
|
131,640
|
|
States and Political Subdivisions
|
|
91,533
|
|
|
2
|
|
|
378
|
|
|
91,157
|
|
|
95,197
|
|
|
23
|
|
|
381
|
|
|
94,839
|
|
Mortgage-Backed Securities
|
|
1,102
|
|
|
83
|
|
|
-
|
|
|
1,185
|
|
|
1,312
|
|
|
118
|
|
|
-
|
|
|
1,430
|
|
Equity Securities(1)
|
|
8,584
|
|
|
-
|
|
|
-
|
|
|
8,584
|
|
|
8,547
|
|
|
-
|
|
|
-
|
|
|
8,547
|
|
Total
|
$
|
483,048
|
|
$
|
812
|
|
$
|
2,949
|
|
$
|
480,911
|
|
$
|
523,412
|
|
$
|
898
|
|
$
|
1,576
|
|
$
|
522,734
|
|
|
|
|
|
|
|
|
|
|
|
|
|
|
|
|
|
|
|
|
|
|
|
|
|
|
Held to Maturity
|
|
|
|
|
|
|
|
|
|
|
|
|
|
|
|
|
|
|
|
|
|
|
|
|
U.S. Government Treasury
|
$
|
98,256
|
|
$
|
-
|
|
$
|
441
|
|
$
|
97,815
|
|
$
|
119,131
|
|
$
|
107
|
|
$
|
81
|
|
$
|
119,157
|
|
States and Political Subdivisions
|
|
6,996
|
|
|
-
|
|
|
41
|
|
|
6,955
|
|
|
8,175
|
|
|
1
|
|
|
38
|
|
|
8,138
|
|
Mortgage-Backed Securities
|
|
111,427
|
|
|
22
|
|
|
1,212
|
|
|
110,237
|
|
|
50,059
|
|
|
29
|
|
|
637
|
|
|
49,451
|
|
Total
|
$
|
216,679
|
|
$
|
22
|
|
$
|
1,694
|
|
$
|
215,007
|
|
$
|
177,365
|
|
$
|
137
|
|
$
|
756
|
|
$
|
176,746
|
|
|
|
|
|
|
|
|
|
|
|
|
|
|
|
|
|
|
|
|
|
|
|
|
|
|
Total Investment Securities
|
$
|
699,727
|
|
$
|
834
|
|
$
|
4,643
|
|
$
|
695,918
|
|
$
|
700,777
|
|
$
|
1,035
|
|
$
|
2,332
|
|
$
|
699,480
|
(1) Includes Federal Home
Loan Bank, Federal Reserve Bank and FNBB Inc. stock recorded at cost of $3.1
million, $4.8 million, and $0.8 million, respectively, at December 31, 2017 and
Federal Home Loan Bank, Federal Reserve Bank and FNBB, Inc. stock at $3.3
million, $4.8 million and $0.5 million , respectively, at December 31, 2016.
Securities with an amortized cost of $328.1 million and $332.7 million at December 31,
2017 and December 31, 2016, respectively, were pledged to secure public
deposits and for other purposes.
The Bank, as a member of the Federal Home
Loan Bank of Atlanta (“FHLB”), is required to own capital stock in the FHLB
based generally upon the balances of residential and commercial real estate
loans, and FHLB advances. FHLB stock which is included in other
securities is pledged to secure FHLB advances. No ready market
exists for this stock, and it has no quoted market value; however, redemption
of this stock has historically been at par value.
As a member of the Federal Reserve Bank of Atlanta, the Bank is
required to maintain stock in the Federal Reserve Bank of Atlanta based on a
specified ratio relative to the Bank’s capital. Federal Reserve Bank stock is
carried at cost and may be sold back to the Federal Reserve Bank at its
carrying value.
Investment Sales. There were no sales of investment
securities for each of the last three years.
Maturity Distribution. At December 31, 2017, the Company's investment securities had
the following maturity distribution based on contractual maturity. Expected
maturities may differ from contractual maturities because borrowers may have
the right to call or prepay obligations. Mortgage-backed securities and
certain amortizing U.S. government agency securities are shown separately since
they are not due at a certain maturity date.
|
|
Available for Sale
|
|
Held to Maturity
|
|
|
Amortized
|
|
Market
|
|
Amortized
|
|
Market
|
|
(Dollars in Thousands)
|
Cost
|
|
Value
|
|
Cost
|
|
Value
|
|
Due in one year or less
|
$
|
107,977
|
|
$
|
107,740
|
|
$
|
63,381
|
|
$
|
63,271
|
|
Due after one through five years
|
|
258,193
|
|
|
255,593
|
|
|
41,871
|
|
|
41,499
|
|
Mortgage-Backed Securities
|
|
1,102
|
|
|
1,185
|
|
|
111,427
|
|
|
110,237
|
|
U.S. Government Agency
|
|
107,192
|
|
|
107,809
|
|
|
-
|
|
|
-
|
|
Equity Securities
|
|
8,584
|
|
|
8,584
|
|
|
-
|
|
|
-
|
|
Total
|
$
|
483,048
|
|
$
|
480,911
|
|
$
|
216,679
|
|
$
|
215,007
|
Unrealized Losses. The following table summarizes the
investment securities with unrealized losses at December 31, aggregated by
major security type and length of time in a continuous unrealized loss
position:
|
|
Less Than 12 Months
|
|
Greater Than 12 Months
|
|
Total
|
|
|
Market
|
|
Unrealized
|
|
Market
|
|
Unrealized
|
|
Market
|
|
Unrealized
|
|
(Dollars in Thousands)
|
Value
|
|
Losses
|
|
Value
|
|
Losses
|
|
Value
|
|
Losses
|
|
December 31, 2017
|
|
|
|
|
|
|
|
|
|
|
|
|
|
|
|
|
|
|
Available for Sale
|
|
|
|
|
|
|
|
|
|
|
|
|
|
|
|
|
|
|
U.S. Government Treasury
|
$
|
155,443
|
|
$
|
963
|
|
$
|
79,900
|
|
$
|
1,201
|
|
$
|
235,343
|
|
$
|
2,164
|
|
U.S. Government Agency
|
|
45,737
|
|
|
150
|
|
|
25,757
|
|
|
257
|
|
|
71,494
|
|
|
407
|
|
States and Political Subdivisions
|
|
82,999
|
|
|
320
|
|
|
5,549
|
|
|
58
|
|
|
88,548
|
|
|
378
|
|
Mortgage-Backed Securities
|
|
2
|
|
|
-
|
|
|
-
|
|
|
-
|
|
|
2
|
|
|
-
|
|
Total
|
|
284,181
|
|
|
1,433
|
|
|
111,206
|
|
|
1,516
|
|
|
395,387
|
|
|
2,949
|
|
|
|
|
|
|
|
|
|
|
|
|
|
|
|
|
|
|
|
|
Held to Maturity
|
|
|
|
|
|
|
|
|
|
|
|
|
|
|
|
|
|
|
U.S. Government Treasury
|
|
77,861
|
|
|
298
|
|
|
14,939
|
|
|
143
|
|
|
92,800
|
|
|
441
|
|
States and Political Subdivisions
|
|
6,955
|
|
|
41
|
|
|
-
|
|
|
-
|
|
|
6,955
|
|
|
41
|
|
Mortgage-Backed Securities
|
|
56,030
|
|
|
469
|
|
|
30,216
|
|
|
743
|
|
|
86,246
|
|
|
1,212
|
|
Total
|
$
|
140,846
|
|
$
|
808
|
|
$
|
45,155
|
|
$
|
886
|
|
$
|
186,001
|
|
$
|
1,694
|
|
|
|
|
|
|
|
|
|
|
|
|
|
|
|
|
|
|
|
|
December 31, 2016
|
|
|
|
|
|
|
|
|
|
|
|
|
|
|
|
|
|
|
Available for Sale
|
|
|
|
|
|
|
|
|
|
|
|
|
|
|
|
|
|
|
U.S. Government Treasury
|
$
|
116,704
|
|
$
|
851
|
|
$
|
-
|
|
$
|
-
|
|
$
|
116,704
|
|
$
|
851
|
|
U.S. Government Agency
|
|
48,520
|
|
|
310
|
|
|
6,699
|
|
|
34
|
|
|
55,219
|
|
|
344
|
|
States and Political Subdivisions
|
|
81,521
|
|
|
380
|
|
|
294
|
|
|
1
|
|
|
81,815
|
|
|
381
|
|
Mortgage-Backed Securities
|
|
3
|
|
|
-
|
|
|
-
|
|
|
-
|
|
|
3
|
|
|
-
|
|
Total
|
|
246,748
|
|
|
1,541
|
|
|
6,993
|
|
|
35
|
|
|
253,741
|
|
|
1,576
|
|
|
|
|
|
|
|
|
|
|
|
|
|
|
|
|
|
|
|
|
Held to Maturity
|
|
|
|
|
|
|
|
|
|
|
|
|
|
|
|
|
|
|
U.S. Government Treasury
|
|
35,210
|
|
|
81
|
|
|
-
|
|
|
-
|
|
|
35,210
|
|
|
81
|
|
States and Political Subdivisions
|
|
7,491
|
|
|
38
|
|
|
-
|
|
|
-
|
|
|
7,491
|
|
|
38
|
|
Mortgage-Backed Securities
|
|
36,710
|
|
|
599
|
|
|
4,010
|
|
|
38
|
|
|
40,720
|
|
|
637
|
|
Total
|
$
|
79,411
|
|
$
|
718
|
|
$
|
4,010
|
|
$
|
38
|
|
$
|
83,421
|
|
$
|
756
|
Management evaluates securities for other than temporary
impairment at least quarterly, and more frequently when economic or market
concerns warrant such evaluation. Declines in the fair value of
held-to-maturity and available-for-sale securities below their cost that are
deemed to be other than temporary are reflected in earnings as realized
losses. In estimating other-than-temporary impairment losses, the Company
considers, (i) whether it has decided to sell the security, (ii) whether it is
more likely than not that the Company will have to sell the security before its
market value recovers, and (iii) whether the present value of expected cash
flows is sufficient to recover the entire amortized cost basis. When assessing
a security’s expected cash flows, the Company considers, among other things,
(i) the length of time and the extent to which the fair value has been less
than cost and (ii) the financial condition and near-term prospects of the
issuer. In analyzing an issuer’s financial condition, management considers
whether the securities are issued by the federal government or its agencies,
whether downgrades by rating agencies have occurred, regulatory issues, and
analysts’ reports.
At December 31, 2017, there were 532 positions (combined AFS
and HTM) with unrealized losses totaling $4.6 million. 67 of these positions were
U.S. government treasury securities guaranteed by the U.S. government. 159 of these positions were
U.S. government agency and mortgage-backed securities issued by U.S. government
sponsored entities. The remaining 306 securities are direct obligations
of the US Government (23) and municipal bonds (283). Municipal bonds are
relatively short-term in nature (less than 5 years), and hold a minimum rating
of A+, with over 70% of the municipal bond portfolio pre-refunded with US
Treasury securities. Because the declines in the market value of these
securities are attributable to changes in interest rates and not credit quality
and because the Company has the present ability and intent to hold these
investments until there is a recovery in fair value, which may be at maturity,
the Company does not consider these investments to be other-than-temporarily
impaired at December 31, 2017.
Note
3
LOANS, NET
Loan Portfolio Composition. The composition of the loan portfolio at December 31 was as
follows:
|
(Dollars in Thousands)
|
2017
|
|
2016
|
|
Commercial, Financial and Agricultural
|
$
|
218,166
|
|
$
|
216,404
|
|
Real Estate – Construction
|
|
77,966
|
|
|
58,443
|
|
Real Estate – Commercial Mortgage
|
|
535,707
|
|
|
503,978
|
|
Real Estate – Residential(1)
|
|
311,906
|
|
|
281,509
|
|
Real Estate – Home Equity
|
|
229,513
|
|
|
236,512
|
|
Consumer(2)
|
|
280,234
|
|
|
264,443
|
|
|
Loans, Net of Unearned Income
|
$
|
1,653,492
|
|
$
|
1,561,289
|
| |
|
|
|
|
|
|
(1) Includes loans in process with outstanding balances of $9.1
million and $9.6 million for 2017 and 2016,
respectively.
(2) Includes overdraft balances of $1.6
million and $1.7 million for 2017 and 2016, respectively.
Net deferred costs included in loans were
$1.5 million at December 31,
2017 and $0.5 million at December 31,
2016.
The Company has pledged a blanket floating
lien on all 1-4 family residential mortgage loans, commercial real estate
mortgage loans, and home equity loans to support available borrowing capacity
at the FHLB of Atlanta and has pledged a blanket floating lien on all consumer
loans, commercial loans, and construction loans to support available borrowing
capacity at the Federal Reserve Bank of Atlanta.
Nonaccrual Loans. Loans are generally placed on
nonaccrual status if principal or interest payments become 90 days past due
and/or management deems the collectability of the principal and/or interest to
be doubtful. Loans are returned to accrual status when the principal and
interest amounts contractually due are brought current or when future payments
are reasonably assured.
The following table presents the recorded
investment in nonaccrual loans and loans past due over 90 days and still on
accrual by class of loans at December 31:
|
|
2017
|
|
2016
|
|
(Dollars in Thousands)
|
Nonaccrual
|
|
90 + Days
|
|
Nonaccrual
|
|
90 + Days
|
|
Commercial, Financial and Agricultural
|
$
|
629
|
|
$
|
-
|
|
$
|
468
|
|
$
|
-
|
|
Real Estate – Construction
|
|
297
|
|
|
-
|
|
|
311
|
|
|
-
|
|
Real Estate – Commercial Mortgage
|
|
2,370
|
|
|
-
|
|
|
3,410
|
|
|
-
|
|
Real Estate – Residential
|
|
1,938
|
|
|
-
|
|
|
2,330
|
|
|
-
|
|
Real Estate – Home Equity
|
|
1,748
|
|
|
-
|
|
|
1,774
|
|
|
-
|
|
Consumer
|
|
177
|
|
|
36
|
|
|
240
|
|
|
-
|
|
Total Nonaccrual Loans
|
$
|
7,159
|
|
$
|
36
|
|
$
|
8,533
|
|
$
|
-
|
Loan Portfolio Aging. A loan is defined as a past due loan when one full payment is past
due or a contractual maturity is over 30 days past due (“DPD”).
The following table presents the aging of
the recorded investment in past due loans by class of loans at December 31,
|
|
30-59
|
|
60-89
|
|
90 +
|
|
Total
|
|
Total
|
|
Total
|
|
(Dollars in Thousands)
|
DPD
|
|
DPD
|
|
DPD
|
|
Past Due
|
|
Current
|
|
Loans
|
|
2017
|
|
|
|
|
|
|
|
|
|
|
|
|
|
|
|
|
|
|
Commercial, Financial and Agricultural
|
$
|
87
|
|
$
|
55
|
|
$
|
-
|
|
$
|
142
|
|
$
|
217,395
|
|
$
|
218,166
|
|
Real Estate – Construction
|
|
811
|
|
|
-
|
|
|
-
|
|
|
811
|
|
|
76,858
|
|
|
77,966
|
|
Real Estate – Commercial Mortgage
|
|
437
|
|
|
195
|
|
|
-
|
|
|
632
|
|
|
532,705
|
|
|
535,707
|
|
Real Estate – Residential
|
|
701
|
|
|
446
|
|
|
-
|
|
|
1,147
|
|
|
308,821
|
|
|
311,906
|
|
Real Estate – Home Equity
|
|
80
|
|
|
2
|
|
|
-
|
|
|
82
|
|
|
227,683
|
|
|
229,513
|
|
Consumer
|
|
1,316
|
|
|
413
|
|
|
36
|
|
|
1,765
|
|
|
278,292
|
|
|
280,234
|
|
Total Past Due Loans
|
$
|
3,432
|
|
$
|
1,111
|
|
$
|
36
|
|
$
|
4,579
|
|
$
|
1,641,754
|
|
$
|
1,653,492
|
|
|
|
|
|
|
|
|
|
|
|
|
|
|
|
|
|
|
|
|
2016
|
|
|
|
|
|
|
|
|
|
|
|
|
|
|
|
|
|
|
Commercial, Financial and Agricultural
|
$
|
209
|
|
$
|
48
|
|
$
|
-
|
|
$
|
257
|
|
$
|
215,679
|
|
$
|
216,404
|
|
Real Estate – Construction
|
|
949
|
|
|
282
|
|
|
-
|
|
|
1,231
|
|
|
56,901
|
|
|
58,443
|
|
Real Estate – Commercial Mortgage
|
|
835
|
|
|
1
|
|
|
-
|
|
|
836
|
|
|
499,732
|
|
|
503,978
|
|
Real Estate – Residential
|
|
1,199
|
|
|
490
|
|
|
-
|
|
|
1,689
|
|
|
277,490
|
|
|
281,509
|
|
Real Estate – Home Equity
|
|
577
|
|
|
51
|
|
|
-
|
|
|
628
|
|
|
234,110
|
|
|
236,512
|
|
Consumer
|
|
1,516
|
|
|
281
|
|
|
-
|
|
|
1,797
|
|
|
262,406
|
|
|
264,443
|
|
Total Past Due Loans
|
$
|
5,285
|
|
$
|
1,153
|
|
$
|
-
|
|
$
|
6,438
|
|
$
|
1,546,318
|
|
$
|
1,561,289
|
Allowance for Loan Losses. The
allowance for loan losses is a reserve established through a provision for loan
losses charged to expense, which represents management’s best estimate of
probable losses within the existing portfolio of loans. Loans are
charged-off to the allowance when losses are deemed to be probable and
reasonably quantifiable.
The following table details the activity
in the allowance for loan losses by portfolio class for the years ended
December 31. Allocation of a portion of the allowance to one category of loans
does not preclude its availability to absorb losses in other categories.
|
|
|
Commercial,
|
|
|
|
|
Real Estate
|
|
|
|
|
|
|
|
|
|
|
|
|
|
|
|
Financial,
|
|
Real Estate
|
|
Commercial
|
|
Real Estate
|
|
Real Estate
|
|
|
|
|
|
|
|
(Dollars in Thousands)
|
Agricultural
|
|
Construction
|
|
Mortgage
|
|
Residential
|
|
Home Equity
|
Consumer
|
|
Total
|
|
2017
|
|
|
|
|
|
|
|
|
|
|
|
|
|
|
|
|
|
|
|
|
|
Beginning Balance
|
$
|
1,198
|
|
$
|
168
|
|
$
|
4,315
|
|
$
|
3,445
|
|
$
|
2,297
|
|
$
|
2,008
|
|
$
|
13,431
|
|
|
Provision for Loan Losses
|
|
1,037
|
|
|
(96)
|
|
|
542
|
|
|
(444)
|
|
|
180
|
|
|
996
|
|
|
2,215
|
|
|
Charge-Offs
|
|
(1,357)
|
|
|
-
|
|
|
(685)
|
|
|
(411)
|
|
|
(190)
|
|
|
(2,193)
|
|
|
(4,836)
|
|
|
Recoveries
|
|
313
|
|
|
50
|
|
|
174
|
|
|
616
|
|
|
219
|
|
|
1,125
|
|
|
2,497
|
|
|
Net Charge-Offs
|
|
(1,044)
|
|
|
50
|
|
|
(511)
|
|
|
205
|
|
|
29
|
|
|
(1,068)
|
|
|
(2,339)
|
|
Ending Balance
|
$
|
1,191
|
|
$
|
122
|
|
$
|
4,346
|
|
$
|
3,206
|
|
$
|
2,506
|
|
$
|
1,936
|
|
$
|
13,307
|
|
|
|
|
|
|
|
|
|
|
|
|
|
|
|
|
|
|
|
|
|
|
|
|
2016
|
|
|
|
|
|
|
|
|
|
|
|
|
|
|
|
|
|
|
|
|
|
Beginning Balance
|
$
|
905
|
|
$
|
101
|
|
$
|
4,498
|
|
$
|
4,409
|
|
$
|
2,473
|
|
$
|
1,567
|
|
$
|
13,953
|
|
|
Provision for Loan Losses
|
|
817
|
|
|
67
|
|
|
(242)
|
|
|
(1,296)
|
|
|
(135)
|
|
|
1,608
|
|
|
819
|
|
|
Charge-Offs
|
|
(861)
|
|
|
-
|
|
|
(349)
|
|
|
(899)
|
|
|
(450)
|
|
|
(2,127)
|
|
|
(4,686)
|
|
|
Recoveries
|
|
337
|
|
|
-
|
|
|
408
|
|
|
1,231
|
|
|
409
|
|
|
960
|
|
|
3,345
|
|
|
Net Charge-Offs
|
|
(524)
|
|
|
-
|
|
|
59
|
|
|
332
|
|
|
(41)
|
|
|
(1,167)
|
|
|
(1,341)
|
|
Ending Balance
|
$
|
1,198
|
|
$
|
168
|
|
$
|
4,315
|
|
$
|
3,445
|
|
$
|
2,297
|
|
$
|
2,008
|
|
$
|
13,431
|
|
|
|
|
|
|
|
|
|
|
|
|
|
|
|
|
|
|
|
|
|
|
|
|
2015
|
|
|
|
|
|
|
|
|
|
|
|
|
|
|
|
|
|
|
|
|
|
Beginning Balance
|
$
|
784
|
|
$
|
843
|
|
$
|
5,287
|
|
$
|
6,520
|
|
$
|
2,882
|
|
$
|
1,223
|
|
$
|
17,539
|
|
|
Provision for Loan Losses
|
|
911
|
|
|
(742)
|
|
|
278
|
|
|
(964)
|
|
|
858
|
|
|
1,253
|
|
|
1,594
|
|
|
Charge-Offs
|
|
(1,029)
|
|
|
-
|
|
|
(1,250)
|
|
|
(1,852)
|
|
|
(1,403)
|
|
|
(1,901)
|
|
|
(7,435)
|
|
|
Recoveries
|
|
239
|
|
|
-
|
|
|
183
|
|
|
705
|
|
|
136
|
|
|
992
|
|
|
2,255
|
|
|
Net Charge-Offs
|
|
(790)
|
|
|
-
|
|
|
(1,067)
|
|
|
(1,147)
|
|
|
(1,267)
|
|
|
(909)
|
|
|
(5,180)
|
|
Ending Balance
|
$
|
905
|
|
$
|
101
|
|
$
|
4,498
|
|
$
|
4,409
|
|
$
|
2,473
|
|
$
|
1,567
|
|
$
|
13,953
|
The following table details the amount of
the allowance for loan losses by portfolio class at December 31, disaggregated
on the basis of the Company’s impairment methodology:
|
|
|
Commercial,
|
|
|
|
|
Real Estate
|
|
|
|
|
|
|
|
|
|
|
|
|
|
|
|
Financial,
|
|
Real Estate
|
|
Commercial
|
|
Real Estate
|
|
Real Estate
|
|
|
|
|
|
|
|
(Dollars in Thousands)
|
Agricultural
|
|
Construction
|
|
Mortgage
|
|
Residential
|
|
Home Equity
|
Consumer
|
|
Total
|
|
2017
|
|
|
|
|
|
|
|
|
|
|
|
|
|
|
|
|
|
|
|
|
|
Period-end amount
|
|
|
|
|
|
|
|
|
|
|
|
|
|
|
|
|
|
|
|
|
|
Allocated to:
|
|
|
|
|
|
|
|
|
|
|
|
|
|
|
|
|
|
|
|
|
|
|
Loans Individually
|
|
|
|
|
|
|
|
|
|
|
|
|
|
|
|
|
|
|
|
|
|
|
Evaluated for Impairment
|
$
|
215
|
|
$
|
1
|
|
$
|
2,165
|
|
$
|
1,220
|
|
$
|
515
|
|
$
|
1
|
|
$
|
4,117
|
|
|
Loans Collectively
|
|
|
|
|
|
|
|
|
|
|
|
|
|
|
|
|
|
|
|
|
|
|
Evaluated for Impairment
|
|
976
|
|
|
121
|
|
|
2,181
|
|
|
1,986
|
|
|
1,991
|
|
|
1,935
|
|
|
9,190
|
|
Ending Balance
|
$
|
1,191
|
|
$
|
122
|
|
$
|
4,346
|
|
$
|
3,206
|
|
$
|
2,506
|
|
$
|
1,936
|
|
$
|
13,307
|
|
|
|
|
|
|
|
|
|
|
|
|
|
|
|
|
|
|
|
|
|
|
|
|
2016
|
|
|
|
|
|
|
|
|
|
|
|
|
|
|
|
|
|
|
|
|
|
Period-end amount
|
|
|
|
|
|
|
|
|
|
|
|
|
|
|
|
|
|
|
|
|
|
Allocated to:
|
|
|
|
|
|
|
|
|
|
|
|
|
|
|
|
|
|
|
|
|
|
|
Loans Individually
|
|
|
|
|
|
|
|
|
|
|
|
|
|
|
|
|
|
|
|
|
|
|
Evaluated for Impairment
|
$
|
80
|
|
$
|
-
|
|
$
|
2,038
|
|
$
|
1,561
|
|
$
|
335
|
|
$
|
6
|
|
$
|
4,020
|
|
|
Loans Collectively
|
|
|
|
|
|
|
|
|
|
|
|
|
|
|
|
|
|
|
|
|
|
|
Evaluated for Impairment
|
|
1,118
|
|
|
168
|
|
|
2,277
|
|
|
1,884
|
|
|
1,962
|
|
|
2,002
|
|
|
9,411
|
|
Ending Balance
|
$
|
1,198
|
|
$
|
168
|
|
$
|
4,315
|
|
$
|
3,445
|
|
$
|
2,297
|
|
$
|
2,008
|
|
$
|
13,431
|
|
|
|
|
|
|
|
|
|
|
|
|
|
|
|
|
|
|
|
|
|
|
|
|
2015
|
|
|
|
|
|
|
|
|
|
|
|
|
|
|
|
|
|
|
|
|
|
Period-end amount
|
|
|
|
|
|
|
|
|
|
|
|
|
|
|
|
|
|
|
|
|
|
Allocated to:
|
|
|
|
|
|
|
|
|
|
|
|
|
|
|
|
|
|
|
|
|
|
|
Loans Individually
|
|
|
|
|
|
|
|
|
|
|
|
|
|
|
|
|
|
|
|
|
|
|
Evaluated for Impairment
|
$
|
77
|
|
$
|
-
|
|
$
|
2,049
|
|
$
|
2,118
|
|
$
|
384
|
|
$
|
18
|
|
$
|
4,646
|
|
|
Loans Collectively
|
|
|
|
|
|
|
|
|
|
|
|
|
|
|
|
|
|
|
|
|
|
|
Evaluated for Impairment
|
|
828
|
|
|
101
|
|
|
2,449
|
|
|
2,291
|
|
|
2,089
|
|
|
1,549
|
|
|
9,307
|
|
Ending Balance
|
$
|
905
|
|
$
|
101
|
|
$
|
4,498
|
|
$
|
4,409
|
|
$
|
2,473
|
|
$
|
1,567
|
|
$
|
13,953
|
The Company’s
recorded investment in loans as of December 31 related to each balance in the
allowance for loan losses by portfolio class and disaggregated on the basis of
the Company’s impairment methodology was as follows:
|
|
|
Commercial,
|
|
|
|
|
Real Estate
|
|
|
|
|
|
|
|
|
|
|
|
|
|
|
Financial,
|
|
Real Estate
|
|
Commercial
|
|
Real Estate
|
|
Real Estate
|
|
|
|
|
|
|
|
(Dollars in Thousands)
|
Agricultural
|
|
Construction
|
Mortgage
|
|
Residential
|
|
Home Equity
|
Consumer
|
|
Total
|
|
2017
|
|
|
|
|
|
|
|
|
|
|
|
|
|
|
|
|
|
|
|
|
|
Individually Evaluated for
|
|
|
|
|
|
|
|
|
|
|
|
|
|
|
|
|
|
|
|
|
|
Impairment
|
$
|
1,378
|
|
$
|
361
|
|
$
|
19,280
|
|
$
|
12,871
|
|
$
|
3,332
|
|
$
|
113
|
|
$
|
37,335
|
|
Collectively Evaluated for
|
|
|
|
|
|
|
|
|
|
|
|
|
|
|
|
|
|
|
|
|
|
Impairment
|
|
216,788
|
|
|
77,605
|
|
|
516,427
|
|
|
299,035
|
|
|
226,181
|
|
|
280,121
|
|
|
1,616,157
|
|
Total
|
$
|
218,166
|
|
$
|
77,966
|
|
$
|
535,707
|
|
$
|
311,906
|
|
$
|
229,513
|
|
$
|
280,234
|
|
$
|
1,653,492
|
|
|
|
|
|
|
|
|
|
|
|
|
|
|
|
|
|
|
|
|
|
|
|
|
2016
|
|
|
|
|
|
|
|
|
|
|
|
|
|
|
|
|
|
|
|
|
|
Individually Evaluated for
|
|
|
|
|
|
|
|
|
|
|
|
|
|
|
|
|
|
|
|
|
|
Impairment
|
$
|
1,042
|
|
$
|
247
|
|
$
|
23,855
|
|
$
|
15,596
|
|
$
|
3,375
|
|
$
|
174
|
|
$
|
44,289
|
|
Collectively Evaluated for
|
|
|
|
|
|
|
|
|
|
|
|
|
|
|
|
|
|
|
|
|
|
Impairment
|
|
215,362
|
|
|
58,196
|
|
|
480,123
|
|
|
265,913
|
|
|
233,137
|
|
|
264,269
|
|
|
1,517,000
|
|
Total
|
$
|
216,404
|
|
$
|
58,443
|
|
$
|
503,978
|
|
$
|
281,509
|
|
$
|
236,512
|
|
$
|
264,443
|
|
$
|
1,561,289
|
|
|
|
|
|
|
|
|
|
|
|
|
|
|
|
|
|
|
|
|
|
|
|
|
2015
|
|
|
|
|
|
|
|
|
|
|
|
|
|
|
|
|
|
|
|
|
|
Individually Evaluated for
|
|
|
|
|
|
|
|
|
|
|
|
|
|
|
|
|
|
|
|
|
|
Impairment
|
$
|
834
|
|
$
|
97
|
|
$
|
20,847
|
|
$
|
18,569
|
|
$
|
3,144
|
|
$
|
261
|
|
$
|
43,752
|
|
Collectively Evaluated for
|
|
|
|
|
|
|
|
|
|
|
|
|
|
|
|
|
|
|
|
|
|
Impairment
|
|
178,982
|
|
|
46,387
|
|
|
478,966
|
|
|
272,016
|
|
|
230,757
|
|
|
241,415
|
|
|
1,448,523
|
|
Total
|
$
|
179,816
|
|
$
|
46,484
|
|
$
|
499,813
|
|
$
|
290,585
|
|
$
|
233,901
|
|
$
|
241,676
|
|
$
|
1,492,275
|
Impaired Loans. Loans are deemed to be impaired when, based on current
information and events, it is probable that the Company will not be able to
collect all amounts due (principal and interest payments), according to the
contractual terms of the loan agreement. Loans, for which the terms have been
modified, and for which the borrower is experiencing financial difficulties,
are considered troubled debt restructurings and classified as impaired.
The following table presents loans
individually evaluated for impairment by class of loans at December 31:
|
|
|
Unpaid
|
|
Recorded
|
|
Recorded
|
|
|
|
|
|
|
Principal
|
|
Investment
|
|
Investment
|
|
Related
|
|
(Dollars in Thousands)
|
|
Balance
|
|
With No Allowance
|
With Allowance
|
|
Allowance
|
|
2017
|
|
|
|
|
|
|
|
|
|
|
|
|
|
Commercial, Financial and Agricultural
|
|
$
|
1,378
|
|
$
|
118
|
|
$
|
1,260
|
|
$
|
215
|
|
Real Estate – Construction
|
|
|
361
|
|
|
297
|
|
|
64
|
|
|
1
|
|
Real Estate – Commercial Mortgage
|
|
|
19,280
|
|
|
1,763
|
|
|
17,517
|
|
|
2,165
|
|
Real Estate – Residential
|
|
|
12,871
|
|
|
1,516
|
|
|
11,355
|
|
|
1,220
|
|
Real Estate – Home Equity
|
|
|
3,332
|
|
|
1,157
|
|
|
2,175
|
|
|
515
|
|
Consumer
|
|
|
113
|
|
|
45
|
|
|
68
|
|
|
1
|
|
Total
|
|
$
|
37,335
|
|
$
|
4,896
|
|
$
|
32,439
|
|
$
|
4,117
|
|
|
|
|
|
|
|
|
|
|
|
|
|
|
|
2016
|
|
|
|
|
|
|
|
|
|
|
|
|
|
Commercial, Financial and Agricultural
|
|
$
|
1,042
|
|
$
|
565
|
|
$
|
477
|
|
$
|
80
|
|
Real Estate – Construction
|
|
|
247
|
|
|
-
|
|
|
247
|
|
|
-
|
|
Real Estate – Commercial Mortgage
|
|
|
23,855
|
|
|
8,954
|
|
|
14,901
|
|
|
2,038
|
|
Real Estate – Residential
|
|
|
15,596
|
|
|
2,509
|
|
|
13,087
|
|
|
1,561
|
|
Real Estate – Home Equity
|
|
|
3,375
|
|
|
1,871
|
|
|
1,504
|
|
|
335
|
|
Consumer
|
|
|
174
|
|
|
65
|
|
|
109
|
|
|
6
|
|
Total
|
|
$
|
44,289
|
|
$
|
13,964
|
|
$
|
30,325
|
|
$
|
4,020
|
Nonaccrual loans include both smaller
balance homogenous loans that are collectively evaluated for impairment and
individually classified impaired loans. Therefore, the sum of nonaccrual loans
and accruing troubled debt restructurings will differ from the total impaired
amount.
The following table summarizes the average
recorded investment and interest income recognized for each of the last three
years by class of impaired loans:
|
|
2017
|
|
2016
|
|
2015
|
|
|
Average
|
|
Total
|
|
Average
|
|
Total
|
|
Average
|
|
Total
|
|
|
Recorded
|
|
Interest
|
|
Recorded
|
|
Interest
|
|
Recorded
|
|
Interest
|
|
(Dollars in Thousands)
|
Investment
|
|
Income
|
|
Investment
|
|
Income
|
|
Investment
|
|
Income
|
|
Commercial, Financial and Agricultural
|
$
|
1,117
|
|
$
|
48
|
|
$
|
886
|
|
$
|
49
|
|
$
|
1,002
|
|
$
|
46
|
|
Real Estate – Construction
|
|
339
|
|
|
4
|
|
|
69
|
|
|
1
|
|
|
335
|
|
|
-
|
|
Real Estate – Commercial Mortgage
|
|
21,682
|
|
|
911
|
|
|
21,376
|
|
|
920
|
|
|
27,644
|
|
|
1,093
|
|
Real Estate – Residential
|
|
14,261
|
|
|
683
|
|
|
17,314
|
|
|
786
|
|
|
19,105
|
|
|
842
|
|
Real Estate – Home Equity
|
|
3,290
|
|
|
108
|
|
|
3,076
|
|
|
115
|
|
|
3,001
|
|
|
86
|
|
Consumer
|
|
141
|
|
|
8
|
|
|
207
|
|
|
9
|
|
|
201
|
|
|
7
|
|
Total
|
$
|
40,830
|
|
$
|
1,762
|
|
$
|
42,928
|
|
$
|
1,880
|
|
$
|
51,288
|
|
$
|
2,074
|
Credit Risk Management. The Company has adopted comprehensive lending policies,
underwriting standards and loan review procedures designed to maximize loan
income within an acceptable level of risk. Management and the Board of
Directors review and approve these policies and procedures on a regular basis
(at least annually).
Reporting
systems have been implemented to monitor loan originations, loan quality,
concentrations of credit, loan delinquencies and nonperforming loans and
potential problem loans. Management and the Credit Risk Oversight Committee
periodically review our lines of business to monitor asset quality trends and
the appropriateness of credit policies. In addition, total borrower exposure
limits are established and concentration risk is monitored. As part of this
process, the overall composition of the portfolio is reviewed to gauge
diversification of risk, client concentrations, industry group, loan type,
geographic area, or other relevant classifications of loans. Specific segments
of the loan portfolio are monitored and reported to the Board on a quarterly
basis and have strategic plans in place to supplement Board approved credit
policies governing exposure limits and underwriting standards. Detailed below
are the types of loans within the Company’s loan portfolio and risk
characteristics unique to each.
Commercial,
Financial, and Agricultural – Loans in this category are primarily made based
on identified cash flows of the borrower with consideration given to underlying
collateral and personal or other guarantees. Lending policy establishes debt
service coverage ratio limits that require a borrower’s cash flow to be
sufficient to cover principal and interest payments on all new and existing
debt. The majority of these loans are secured by the assets being financed or
other business assets such as accounts receivable, inventory, or equipment.
Collateral values are determined based upon third party appraisals and
evaluations. Loan to value ratios at origination are governed by established
policy guidelines.
Real
Estate Construction – Loans in this category consist of short-term construction
loans, revolving and non-revolving credit lines and construction/permanent
loans made to individuals and investors to finance the acquisition,
development, construction or rehabilitation of real property. These loans are
primarily made based on identified cash flows of the borrower or project and
generally secured by the property being financed, including 1-4 family
residential properties and commercial properties that are either owner-occupied
or investment in nature. These properties may include either vacant or
improved property. Construction loans are generally based upon estimates of
costs and value associated with the completed project. Collateral values are determined
based upon third party appraisals and evaluations. Loan to value ratios at
origination are governed by established policy guidelines. The disbursement of
funds for construction loans is made in relation to the progress of the project
and as such these loans are closely monitored by on-site inspections.
Real
Estate Commercial Mortgage – Loans in this category consists of commercial
mortgage loans secured by property that is either owner-occupied or investment
in nature. These loans are primarily made based on identified cash flows of
the borrower or project with consideration given to underlying real estate
collateral and personal guarantees. Lending policy establishes debt service
coverage ratios and loan to value ratios specific to the property type.
Collateral values are determined based upon third party appraisals and
evaluations.
Real
Estate Residential – Residential mortgage loans held in the Company’s loan
portfolio are made to borrowers that demonstrate the ability to make scheduled
payments with full consideration to underwriting factors such as current
income, employment status, current assets, and other financial resources,
credit history, and the value of the collateral. Collateral consists of
mortgage liens on 1-4 family residential properties. Collateral values are
determined based upon third party appraisals and evaluations. The Company does
not originate sub-prime loans.
Real
Estate Home Equity – Home equity loans and lines are made to qualified
individuals for legitimate purposes generally secured by senior or junior
mortgage liens on owner-occupied 1-4 family homes or vacation homes. Borrower
qualifications include favorable credit history combined with supportive income
and debt ratio requirements and combined loan to value ratios within
established policy guidelines. Collateral values are determined based upon
third party appraisals and evaluations.
Consumer
Loans – This loan portfolio includes personal installment loans, direct and
indirect automobile financing, and overdraft lines of credit. The majority of
the consumer loan portfolio consists of indirect and direct automobile loans.
Lending policy establishes maximum debt to income ratios, minimum credit
scores, and includes guidelines for verification of applicants’ income and
receipt of credit reports.
Credit Quality Indicators. As part of the ongoing monitoring of the Company’s loan
portfolio quality, management categorizes loans into risk categories based on
relevant information about the ability of borrowers to service their debt such
as: current financial information, historical payment performance, credit
documentation, and current economic/market trends, among other
factors. Risk ratings are assigned to each loan and revised as
needed through established monitoring procedures for individual loan
relationships over a predetermined amount and review of smaller balance
homogenous loan pools. The Company uses the definitions noted below
for categorizing and managing its criticized loans. Loans categorized
as “Pass” do not meet the criteria set forth for the Special Mention,
Substandard, or Doubtful categories and are not considered criticized.
Special Mention – Loans in this category are presently protected
from loss, but weaknesses are apparent which, if not corrected, could cause
future problems. Loans in this category may not meet required
underwriting criteria and have no mitigating factors. More than the
ordinary amount of attention is warranted for these loans.
Substandard – Loans in this category exhibit well-defined
weaknesses that would typically bring normal repayment into jeopardy. These
loans are no longer adequately protected due to well-defined weaknesses that
affect the repayment capacity of the borrower. The possibility of
loss is much more evident and above average supervision is required for these
loans.
Doubtful – Loans in this category have all the weaknesses inherent
in a loan categorized as Substandard, with the characteristic that the
weaknesses make collection or liquidation in full, on the basis of currently existing
facts, conditions, and values, highly questionable and improbable.
The following table presents the risk
category of loans by segment at December 31:
|
|
|
Commercial,
|
|
|
|
|
|
|
|
Total
|
|
|
|
Financial,
|
|
|
|
|
|
|
|
Criticized
|
|
(Dollars in Thousands)
|
|
Agriculture
|
|
Real Estate
|
|
Consumer
|
|
Loans
|
|
2017
|
|
|
|
|
|
|
|
|
|
|
|
|
|
Special Mention
|
|
$
|
7,879
|
|
$
|
13,324
|
|
$
|
65
|
|
$
|
21,268
|
|
Substandard
|
|
|
1,057
|
|
|
29,291
|
|
|
654
|
|
|
31,002
|
|
Doubtful
|
|
|
-
|
|
|
-
|
|
|
-
|
|
|
-
|
|
Total Criticized Loans
|
|
$
|
8,936
|
|
$
|
42,615
|
|
$
|
719
|
|
$
|
52,270
|
|
|
|
|
|
|
|
|
|
|
|
|
|
|
|
2016
|
|
|
|
|
|
|
|
|
|
|
|
|
|
Special Mention
|
|
$
|
3,300
|
|
$
|
23,183
|
|
$
|
216
|
|
$
|
26,699
|
|
Substandard
|
|
|
1,158
|
|
|
39,800
|
|
|
549
|
|
|
41,507
|
|
Doubtful
|
|
|
-
|
|
|
-
|
|
|
-
|
|
|
-
|
|
Total Criticized Loans
|
|
$
|
4,458
|
|
$
|
62,983
|
|
$
|
765
|
|
$
|
68,206
|
Troubled Debt Restructurings (“TDRs”). TDRs are loans in which the borrower is experiencing
financial difficulty and the
Company has granted an economic concession to the borrower that it would not
otherwise consider. In these instances, as part of a work-out alternative, the
Company will make concessions including the extension of the loan term, a principal
moratorium, a reduction in the interest rate, or a combination thereof. The
impact of the TDR modifications and defaults are factored into the allowance
for loan losses on a loan-by-loan basis as all TDRs are, by definition,
impaired loans. Thus, specific reserves are established based upon the
results of either a discounted cash flow analysis or the underlying collateral
value, if the loan is deemed to be collateral dependent. A TDR classification can be
removed if the borrower’s financial condition improves such that the borrower
is no longer in financial difficulty, the loan has not had any forgiveness of
principal or interest, and the loan is subsequently refinanced or restructured
at market terms and qualifies as a new loan.
The following
table presents loans classified as TDRs at December 31:
|
|
|
2017
|
|
2016
|
|
(Dollars in Thousands)
|
|
Accruing
|
|
Nonaccruing
|
|
Accruing
|
|
Nonaccruing
|
|
Commercial, Financial and Agricultural
|
|
$
|
822
|
|
$
|
-
|
|
$
|
772
|
|
$
|
40
|
|
Real Estate – Construction
|
|
|
64
|
|
|
-
|
|
|
-
|
|
|
-
|
|
Real Estate – Commercial Mortgage
|
|
|
17,058
|
|
|
1,636
|
|
|
20,673
|
|
|
1,259
|
|
Real Estate – Residential
|
|
|
11,666
|
|
|
503
|
|
|
13,969
|
|
|
444
|
|
Real Estate – Home Equity
|
|
|
2,441
|
|
|
186
|
|
|
2,647
|
|
|
-
|
|
Consumer
|
|
|
113
|
|
|
-
|
|
|
172
|
|
|
-
|
|
Total TDRs
|
|
$
|
32,164
|
|
$
|
2,325
|
|
$
|
38,233
|
|
$
|
1,743
|
Loans classified as TDRs during 2017, 2016, and 2015 are presented
in the table below. The modifications made during the reporting period
involved either an extension of the loan term, a principal moratorium, a
reduction in the interest rate, or a combination thereof. The financial impact
of these modifications was not material.
|
|
|
2017
|
|
2016
|
|
2015
|
|
|
|
Number
|
|
|
|
Number
|
|
|
|
Number
|
|
|
|
|
|
of
|
|
Recorded
|
|
of
|
|
Recorded
|
|
of
|
|
Recorded
|
|
(Dollars in Thousands)
|
|
Contracts
|
|
Investment(1)
|
|
Contracts
|
|
Investment(1)
|
|
Contracts
|
|
Investment(1)
|
|
Commercial, Financial and Agricultural
|
|
1
|
|
$
|
22
|
|
-
|
|
$
|
-
|
|
1
|
|
$
|
40
|
|
Real Estate – Construction
|
|
1
|
|
|
65
|
|
-
|
|
|
-
|
|
-
|
|
|
-
|
|
Real Estate – Commercial Mortgage
|
|
1
|
|
|
70
|
|
3
|
|
|
5,012
|
|
4
|
|
|
631
|
|
Real Estate – Residential
|
|
2
|
|
|
283
|
|
6
|
|
|
590
|
|
14
|
|
|
1,531
|
|
Real Estate – Home Equity
|
|
4
|
|
|
203
|
|
5
|
|
|
206
|
|
21
|
|
|
1,005
|
|
Consumer
|
|
-
|
|
|
-
|
|
-
|
|
|
-
|
|
3
|
|
|
110
|
|
Total TDRs
|
|
9
|
|
$
|
643
|
|
14
|
|
$
|
5,808
|
|
43
|
|
$
|
3,317
|
|
|
|
|
|
|
|
|
|
|
|
|
|
|
|
|
|
|
(1) Recorded investment reflects charge-offs and additional funds
advanced at time of restructure, if applicable.
|
|
|
|
The following table provides information on how TDRs were modified
during the periods included.
|
|
|
2017
|
|
2016
|
|
2015
|
|
|
|
Number
|
|
Post-Modified
|
|
Number
|
|
Post-Modified
|
|
Number
|
|
Post-Modified
|
|
|
|
of
|
|
Recorded
|
|
of
|
|
Recorded
|
|
of
|
|
Recorded
|
|
(Dollars in Thousands)
|
|
Contracts
|
|
Investment
|
|
Contracts
|
|
Investment
|
|
Contracts
|
|
Investment
|
|
Extended amortization
|
|
1
|
|
$
|
70
|
|
3
|
|
$
|
4,703
|
|
16
|
|
$
|
973
|
|
Interest rate adjustment
|
|
3
|
|
|
302
|
|
-
|
|
|
-
|
|
5
|
|
|
284
|
|
Extended amortization and
|
|
|
|
|
|
|
|
|
|
|
|
|
|
|
|
|
interest rate adjustment
|
|
4
|
|
|
249
|
|
11
|
|
|
1,105
|
|
22
|
|
|
2,060
|
|
Other
|
|
1
|
|
|
22
|
|
-
|
|
|
-
|
|
-
|
|
|
-
|
|
Total TDRs
|
|
9
|
|
$
|
643
|
|
14
|
|
$
|
5,808
|
|
43
|
|
$
|
3,317
|
For the years 2017, 2016, 2015, there were no TDRs for which there
was a payment default and the loans were modified within the twelve months
prior to default.
Note 4
PREMISES AND EQUIPMENT
The composition of the Company's premises
and equipment at December 31 was as follows:
|
(Dollars in Thousands)
|
2017
|
|
2016
|
|
Land
|
$
|
24,061
|
|
$
|
24,376
|
|
Buildings
|
|
111,716
|
|
|
112,417
|
|
Fixtures and Equipment
|
|
45,012
|
|
|
45,863
|
|
Total
|
|
180,789
|
|
|
182,656
|
|
Accumulated Depreciation
|
|
(89,091)
|
|
|
(87,180)
|
|
Premises and Equipment, Net
|
$
|
91,698
|
|
$
|
95,476
|
Note 5
GOODWILL
At December 31, 2017 and
December 31, 2016, the Company had goodwill of $84.8 million. Goodwill is tested for impairment on an
annual basis, or more often if impairment indicators exist. The Company
adopted ASU 2017-04, Intangibles – Goodwill and Other
(Topic 350): Simplifying Accounting for Goodwill Impairment in 2017 which
requires a qualitative assessment of goodwill impairment indicators. If
the assessment indicates that impairment has more than likely occurred, the
Company must compare the estimated fair value of the reporting unit to its
carrying amount. If the carrying amount of the reporting unit exceeds its
estimated fair value, an impairment charge is recorded equal to the excess.
During the fourth quarter of 2017, the
Company performed its annual goodwill impairment testing and determined that no
goodwill impairment existed at December 31, 2017. The Company will continue to
evaluate goodwill for impairment as defined by ASC Topic 350.
Note 6
OTHER REAL ESTATE OWNED
The following table presents other real estate owned activity as
of December 31,
|
(Dollars in Thousands)
|
|
2017
|
|
2016
|
|
2015
|
|
Beginning Balance
|
|
$
|
10,638
|
|
$
|
19,290
|
|
$
|
35,680
|
|
Additions
|
|
|
2,384
|
|
|
4,016
|
|
|
5,752
|
|
Valuation Write-Downs
|
|
|
(1,318)
|
|
|
(2,363)
|
|
|
(1,713)
|
|
Sales
|
|
|
(7,496)
|
|
|
(10,305)
|
|
|
(20,155)
|
|
Other
|
|
|
(267)
|
|
|
-
|
|
|
(274)
|
|
Ending Balance
|
|
$
|
3,941
|
|
$
|
10,638
|
|
$
|
19,290
|
|
Net expenses applicable to other real estate owned as of December
31, was as follows:
|
|
|
|
|
|
|
|
|
|
|
|
|
|
(Dollars in Thousands)
|
|
2017
|
|
2016
|
|
2015
|
|
Gains from the Sale of Properties
|
|
$
|
(1,054)
|
|
$
|
(410)
|
|
$
|
(938)
|
|
Losses from the Sale of Properties
|
|
|
518
|
|
|
1,272
|
|
|
2,169
|
|
Rental Income from Properties
|
|
|
(76)
|
|
|
(88)
|
|
|
(250)
|
|
Property Carrying Costs
|
|
|
429
|
|
|
511
|
|
|
2,277
|
|
Valuation Adjustments
|
|
|
1,318
|
|
|
2,364
|
|
|
1,713
|
|
Total
|
|
$
|
1,135
|
|
$
|
3,649
|
|
$
|
4,971
|
At December 31, 2017, the Company had $0.9 million of loans secured by residential real
estate in the process of foreclosure.
Note 7
DEPOSITS
The composition of the
Company's interest bearing deposits at December 31 was as follows:
|
(Dollars in Thousands)
|
2017
|
|
2016
|
|
NOW Accounts
|
$
|
877,820
|
|
$
|
904,014
|
|
Money Market Accounts
|
|
239,212
|
|
|
252,800
|
|
Savings Deposits
|
|
335,140
|
|
|
304,680
|
|
Time Deposits
|
|
143,122
|
|
|
159,610
|
|
Total Interest Bearing Deposits
|
$
|
1,595,294
|
|
$
|
1,621,104
|
At December 31, 2017 and 2016, $1.6 million and $1.7 million, respectively, in
overdrawn deposit accounts were reclassified as loans.
Time deposits that meet or exceed the FDIC
insurance limit of $250,000 totaled $8.2 million and $9.8 million at December 31,
2017 and December 31, 2016, respectively.
At December 31, the scheduled maturities
of time deposits were as follows:
|
(Dollars in Thousands)
|
|
2017
|
|
2018
|
|
$
|
121,821
|
|
2019
|
|
|
11,594
|
|
2020
|
|
|
5,571
|
|
2021
|
|
|
2,323
|
|
2022 and thereafter
|
|
|
1,813
|
|
Total
|
|
$
|
143,122
|
|
Interest expense on deposits for the three years ended December
31, was as follows:
|
|
|
|
|
|
|
|
|
|
|
|
|
|
|
|
(Dollars in Thousands)
|
|
2017
|
|
2016
|
|
2015
|
|
NOW Accounts
|
|
$
|
1,094
|
|
$
|
292
|
|
$
|
254
|
|
Money Market Accounts
|
|
|
252
|
|
|
120
|
|
|
134
|
|
Savings Deposits
|
|
|
159
|
|
|
144
|
|
|
126
|
|
Time Deposits < $250,000
|
|
|
274
|
|
|
306
|
|
|
377
|
|
Time Deposits > $250,000
|
|
|
10
|
|
|
17
|
|
|
53
|
|
Total
|
|
$
|
1,789
|
|
$
|
879
|
|
$
|
944
|
Note 8
SHORT-TERM BORROWINGS
Short-term borrowings included the
following:
|
(Dollars in Thousands)
|
|
Federal Funds Purchased
|
|
|
Securities
Sold Under Repurchase
Agreements(1)
|
|
|
Other
Short-Term Borrowings(2)
|
|
|
2017
|
|
|
|
|
|
|
|
|
|
|
|
|
|
Balance at December 31
|
|
$
|
-
|
|
|
$
|
7,272
|
|
|
$
|
208
|
|
|
Maximum indebtedness at any month end
|
|
|
-
|
|
|
|
7,272
|
|
|
|
6,218
|
|
|
Daily average indebtedness outstanding
|
|
|
7
|
|
|
|
7,266
|
|
|
|
2,654
|
|
|
Average rate paid for the year
|
|
|
1.60
|
%
|
|
|
0.10
|
%
|
|
|
2.79
|
%
|
|
Average rate paid on period-end borrowings
|
|
|
-
|
%
|
|
|
0.15
|
%
|
|
|
6.13
|
%
|
|
|
|
|
|
|
|
|
|
|
|
|
|
|
|
2016
|
|
|
|
|
|
|
|
|
|
|
|
|
|
Balance at December 31
|
|
$
|
-
|
|
|
$
|
6,490
|
|
|
$
|
6,259
|
|
|
Maximum indebtedness at any month end
|
|
|
-
|
|
|
|
74,911
|
|
|
|
7,961
|
|
|
Daily average indebtedness outstanding
|
|
|
11
|
|
|
|
32,732
|
|
|
|
4,019
|
|
|
Average rate paid for the year
|
|
|
1.00
|
%
|
|
|
0.05
|
%
|
|
|
3.28
|
%
|
|
Average rate paid on period-end borrowings
|
|
|
-
|
%
|
|
|
0.05
|
%
|
|
|
3.05
|
%
|
|
|
|
|
|
|
|
|
|
|
|
|
|
|
|
2015
|
|
|
|
|
|
|
|
|
|
|
|
|
|
Balance at December 31
|
|
$
|
-
|
|
|
$
|
60,977
|
|
|
$
|
81
|
|
|
Maximum indebtedness at any month end
|
|
|
-
|
|
|
|
64,935
|
|
|
|
2,003
|
|
|
Daily average indebtedness outstanding
|
|
|
12
|
|
|
|
57,689
|
|
|
|
780
|
|
|
Average rate paid for the year
|
|
|
0.74
|
%
|
|
|
0.05
|
%
|
|
|
3.98
|
%
|
|
Average rate paid on period-end borrowings
|
|
|
-
|
%
|
|
|
0.05
|
%
|
|
|
5.23
|
%
|
|
|
|
|
|
|
|
|
|
|
|
|
|
|
|
(1) Balances are fully collateralized by government treasury or
agency securities held in the Company's investment portfolio.
|
|
|
(2) Comprised of FHLB advances.
|
|
|
|
|
Note 9
LONG-TERM BORROWINGS
Federal Home Loan Bank
Advances. FHLB
long-term advances totaled $11.3 million at December 31, 2017
and $14.9 million at December 31,
2016. The advances mature at
varying dates from 2018 through 2025 and had a weighted-average rate of 2.48%
and 2.81% at December 31, 2017 and 2016, respectively. The FHLB advances are
collateralized by a blanket floating lien on all 1-4 family residential
mortgage loans, commercial real estate mortgage loans, and home equity mortgage
loans. Interest on the FHLB advances is paid on a monthly basis.
Note Payable. Long-term note payable totaled $2.7 million at December 31,
2017. The note matures on March
30, 2027. Interest
is payable quarterly on the note equal to the
prime interest rate which is adjusted quarterly.
Scheduled minimum future principal
payments on our long-term borrowings at December 31 were as follows:
|
(Dollars in Thousands)
|
|
2017
|
|
2018
|
|
$
|
1,645
|
|
2019
|
|
|
4,763
|
|
2020
|
|
|
1,667
|
|
2021
|
|
|
1,209
|
|
2022
|
|
|
2,892
|
|
2023 and thereafter
|
|
|
1,791
|
|
Total
|
|
$
|
13,967
|
Junior Subordinated Deferrable Interest
Notes. The
Company has issued two junior subordinated deferrable interest notes to wholly
owned Delaware statutory trusts. The first note for $30.9 million was issued to CCBG
Capital Trust I. The second note for $32.0 million was issued to CCBG
Capital Trust II. The two trusts are considered variable interest entities for
which the Company is not the primary beneficiary. Accordingly, the
accounts of the trusts are not included in the Company’s consolidated financial
statements. See Note 1 - Summary of Significant Accounting Policies for
additional information about the Company’s consolidation
policy. Details of the Company’s transaction with the two trusts are
provided below.
In November 2004, CCBG Capital Trust I
issued $30.0 million of trust preferred
securities which represent interest in the assets of the trust. The
interest payments are due quarterly at 3-month LIBOR plus a margin of 1.90%,
adjusted quarterly. The trust preferred securities will mature on December 31, 2034, and are redeemable upon
approval of the Federal Reserve in whole or in part at the option of the
Company at any time after December 31, 2009 and in whole at any time upon
occurrence of certain events affecting their tax or regulatory capital
treatment. Distributions on the trust preferred securities are payable
quarterly on March 31, June 30, September 30, and December 31 of each
year. CCBG Capital Trust I also issued $928,000 of common equity
securities to CCBG. The proceeds of the offering of trust preferred
securities and common equity securities were used to purchase a $30.9 million junior
subordinated deferrable interest note issued by the Company, which has terms
similar to the trust preferred securities.
In May 2005, CCBG Capital Trust II issued
$31.0 million of trust preferred
securities which represent interest in the assets of the trust. The
interest payments are due quarterly at 3-month LIBOR plus a margin of 1.80%,
adjusted annually. The trust preferred securities will mature on June 15, 2035, and are redeemable upon
approval of the Federal Reserve in whole or in part at the option of the
Company and in whole at any time upon occurrence of certain events affecting
their tax or regulatory capital treatment. Distributions on the trust
preferred securities are payable quarterly on March 15, June 15, September 15,
and December 15 of each year. CCBG Capital Trust II also issued
$959,000 of common equity securities to CCBG. The proceeds of the
offering of trust preferred securities and common equity securities were used
to purchase a $32.0 million junior
subordinated deferrable interest note issued by the Company, which has terms
substantially similar to the trust preferred securities.
The Company has the right to defer payments of interest on the two
notes at any time or from time to time for a period of up to twenty consecutive
quarterly interest payment periods. Under the terms of each note, in
the event that under certain circumstances there is an event of default under
the note or the Company has elected to defer interest on the note, the Company
may not, with certain exceptions, declare or pay any dividends or distributions
on its capital stock or purchase or acquire any of its capital stock. As of
December 31, 2016, the
Company has paid all interest payments in full.
The Company has entered into agreements to
guarantee the payments of distributions on the trust preferred securities and
payments of redemption of the trust preferred securities. Under
these agreements, the Company also agrees, on a subordinated basis, to pay
expenses and liabilities of the two trusts other than those arising under the
trust preferred securities. The obligations of the Company under the
two junior subordinated notes, the trust agreements establishing the two
trusts, the guarantee and agreement as to expenses and liabilities, in
aggregate, constitute a full and unconditional guarantee by the Company of the
two trusts' obligations under the two trust preferred security issuances.
On April 12, 2016, we retired $10 million in face value of
trust preferred securities that were auctioned as part of a liquidation of a
pooled collateralized debt obligation fund. The trust preferred securities
were originally issued through CCBG Capital Trust I. Our winning bid equated
to approximately 75% of the $10 million par value, with the 25% discount
resulting in a pre-tax gain of approximately $2.5 million. We utilized
internal resources and a $3.75 million draw on a short-term borrowing facility
to fund the repurchase.
Despite the fact that the accounts of CCBG
Capital Trust I and CCBG Capital Trust II are not included in the Company’s
consolidated financial statements, the $20.0 million and $31.0 million, respectively, in
trust preferred securities issued by these subsidiary trusts are included in
the Tier 1 Capital of Capital City Bank Group, Inc. as allowed by Federal
Reserve guidelines.
Note 10
INCOME TAXES
The provision for income taxes reflected
in the statements of comprehensive income is comprised of the following
components:
|
(Dollars in Thousands)
|
|
2017
|
|
2016
|
|
2015
|
|
Current:
|
|
|
|
|
|
|
|
|
|
|
Federal
|
|
$
|
5,792
|
|
$
|
2,295
|
|
$
|
497
|
|
State
|
|
|
140
|
|
|
115
|
|
|
115
|
|
|
|
|
5,932
|
|
|
2,410
|
|
|
612
|
|
Deferred:
|
|
|
|
|
|
|
|
|
|
|
Federal
|
|
|
1,232
|
|
|
2,742
|
|
|
3,258
|
|
State
|
|
|
974
|
|
|
712
|
|
|
475
|
|
Expense Due to Enactment of Federal Tax Reform
|
|
|
4,066
|
|
|
-
|
|
|
-
|
|
Change in Valuation Allowance
|
|
|
(1)
|
|
|
3
|
|
|
114
|
|
|
|
|
6,271
|
|
|
3,457
|
|
|
3,847
|
|
Total:
|
|
|
|
|
|
|
|
|
|
|
Federal
|
|
|
7,024
|
|
|
5,037
|
|
|
3,755
|
|
State
|
|
|
1,114
|
|
|
827
|
|
|
590
|
|
Expense Due to Enactment of Federal Tax Reform
|
|
|
4,066
|
|
|
-
|
|
|
-
|
|
Change in Valuation Allowance
|
|
|
(1)
|
|
|
3
|
|
|
114
|
|
Total
|
|
$
|
12,203
|
|
$
|
5,867
|
|
$
|
4,459
|
On December 22, 2017, H.R.1, commonly known as the Tax Cuts and
Jobs Act (the “Tax Act”), was signed into law. Among other things, the Tax Act
reduced our corporate federal tax rate from 35% to 21% effective January 1,
2018. As a result, we were required to re-measure, through income tax expense,
our deferred tax assets and liabilities using the enacted rate at which we
expect them to be recovered or settled.
On December
22, 2017, the SEC staff issued Staff Accounting Bulletin No. 118 (“SAB 118”),
which provides guidance on accounting for the tax effects of the Tax Act. SAB
118 provides a measurement period that should not extend beyond one year from
the Tax Act enactment date for companies to complete the accounting under ASC
740, Income Taxes. The Company’s financial results reflect the income tax
effects of the Act for which the accounting under ASC Topic 740 is complete and
provisional amounts for those specific income tax effects of the 2017 Tax Act
for which the accounting under ASC Topic 740 is incomplete but a reasonable
estimate could be determined. The Company recorded a provisional amount of
$4.1 million tax expense for the impact of the re-measurement of its deferred
tax inventory. The Company is still analyzing certain aspects of the Tax Act
and refining its calculations, therefore these estimates may change as additional
information becomes available.
Income taxes provided were different than
the tax expense computed by applying the statutory federal income tax rate of
35% to pre-tax income as a result of the following:
|
(Dollars in Thousands)
|
|
2017
|
|
2016
|
|
2015
|
|
Tax Expense at Federal Statutory Rate
|
|
$
|
8,074
|
|
$
|
6,165
|
|
$
|
4,751
|
|
Increases (Decreases) Resulting From:
|
|
|
|
|
|
|
|
|
|
|
Tax-Exempt Interest Income
|
|
|
(805)
|
|
|
(662)
|
|
|
(395)
|
|
State Taxes, Net of Federal Benefit
|
|
|
724
|
|
|
538
|
|
|
390
|
|
Other
|
|
|
439
|
|
|
121
|
|
|
562
|
|
Change in Valuation Allowance
|
|
|
(1)
|
|
|
3
|
|
|
114
|
|
Tax-Exempt Cash Surrender Value Life Insurance Benefit
|
|
|
(294)
|
|
|
(298)
|
|
|
(303)
|
|
Excess Death Benefit Payment
|
|
|
-
|
|
|
-
|
|
|
(660)
|
|
Expense Due to Enactment of Federal Tax Reform
|
|
|
4,066
|
|
|
-
|
|
|
-
|
|
Actual Tax Expense
|
|
$
|
12,203
|
|
$
|
5,867
|
|
$
|
4,459
|
Deferred income tax liabilities and assets result from differences
between assets and liabilities measured for financial reporting purposes and
for income tax return purposes. These assets and liabilities are
measured using the enacted tax rates and laws that are currently in
effect. The net deferred tax asset and the temporary differences
comprising that balance at December 31, 2017 and 2016 are as follows:
|
(Dollars in Thousands)
|
|
2017
|
|
2016
|
|
Deferred Tax Assets Attributable to:
|
|
|
|
|
|
|
|
Allowance for Loan Losses
|
|
$
|
3,373
|
|
$
|
5,182
|
|
Accrued Pension/SERP
|
|
|
10,289
|
|
|
16,107
|
|
State Net Operating Loss and Tax Credit Carry-Forwards
|
|
|
5,074
|
|
|
4,804
|
|
Other Real Estate Owned
|
|
|
1,520
|
|
|
3,550
|
|
Federal Net Operating Loss and Tax Credit Carry-Forwards
|
|
|
50
|
|
|
401
|
|
Accrued SERP Liability
|
|
|
1,398
|
|
|
1,824
|
|
Other
|
|
|
1,787
|
|
|
2,414
|
|
Total Deferred Tax Assets
|
|
$
|
23,491
|
|
$
|
34,282
|
|
|
|
|
|
|
|
|
|
Deferred Tax Liabilities Attributable to:
|
|
|
|
|
|
|
|
Depreciation on Premises and Equipment
|
|
$
|
3,272
|
|
$
|
5,480
|
|
Deferred Loan Fees and Costs
|
|
|
2,266
|
|
|
3,342
|
|
Intangible Assets
|
|
|
3,035
|
|
|
4,319
|
|
Investments
|
|
|
469
|
|
|
714
|
|
Other
|
|
|
5
|
|
|
10
|
|
Total Deferred Tax Liabilities
|
|
|
9,047
|
|
|
13,865
|
|
Valuation Allowance
|
|
|
1,755
|
|
|
1,445
|
|
Net Deferred Tax Asset
|
|
$
|
12,689
|
|
$
|
18,972
|
In the opinion of management, it is more likely than not that all
of the deferred tax assets, with the exception of certain state net operating
loss carry-forwards, certain state tax credit carry-forwards, and certain
capital loss carry-forwards expected to expire prior to utilization, will be
realized. Accordingly, a valuation allowance of $1.8 million is recorded at December 31,
2017. At December 31, 2017, the Company had state loss and tax credit
carry-forwards of approximately $5.1 million, which expire at
various dates from 2018 through 2036, and federal capital loss
carry-forwards of approximately $0.1 million which expire at
various dates from 2019 through 2020.
The Company had no unrecognized tax
benefits at December 31, 2017, December 31, 2016, and December 31, 2015.
It is the Company’s policy to recognize interest and penalties
accrued relative to unrecognized tax benefits in their respective federal or
state income taxes accounts. There were no penalties and interest related to
income taxes recorded in the income statement for the years ended December 31,
2017, 2016 and 2015. There were no amounts accrued in the balance sheet for
penalties and interest at December 31, 2017 and 2016.
The Company and its subsidiaries file a
consolidated U.S. federal income tax return, as well as file various returns in
states where its banking offices are located. The Company is no
longer subject to U.S. federal or state tax examinations for years before 2014.
Note 11
STOCK-BASED COMPENSATION
At December 31, 2017, the
Company had three stock-based compensation plans, consisting of the 2011
Associate Incentive Plan (“AIP”), the 2011 Associate Stock Purchase Plan (“ASPP”), and the 2011 Director Stock Purchase Plan (“DSPP”). These plans, which were approved by the
shareowners in April 2011, replaced substantially similar plans approved by the
shareowners in 2004. Total compensation expense associated with these plans
for 2015 through 2017 was $1.4 million, $1.8 million, and $2.0 million, respectively.
AIP. The AIP allows the Company's Board of
Directors to award key associates various forms of equity-based incentive
compensation. Under the 2011 AIP there were 875,000 shares reserved for
issuance. In 2016, the Company, pursuant to the
terms and conditions of the AIP, created the 2016 Incentive Plan (“2017 Plan”),
under which all participants in the 2017 Plan were eligible to earn performance shares. Awards under the 2017 Plan were
tied to internally established performance goals. At base level targets, the
grant-date fair value of the shares eligible to be awarded in 2017 was
approximately $0.9 million. Approximately 75% of the award is in
the form of stock and 25% in the form of a cash bonus. For
2017, a total of 33,213 shares were eligible for
issuance, but additional shares could be earned if performance exceeded
established goals. A total of 28,943 shares were earned for 2017.
The Company recognized expense of $0.8 million, $1.2 million, and $1.1 million for years ended
2017, 2016 and 2015, respectively. After deducting the shares earned in 2017, 525,243 shares remain eligible for
issuance under the 2011 AIP.
Executive Long-Term Incentive Plan
(“LTIP”). In 2007, the Company established a
Performance Share Unit Plan under the provisions of the AIP that allows William
G. Smith, Jr., the Chairman, President, and Chief Executive Officer of CCBG,
Inc. to earn shares based on the compound annual growth rate in diluted
earnings per share over a three-year period. At December 31, 2017, there were
three LTIP agreements in place for the years 2015-2017. The Company recognized
$0.6 million, $0.3 million, and $0.3 million in expense for
years 2017, 2016 and 2015, respectively, under these LTIP agreements. At Mr.
Smith’s request, the Compensation Committee, with board approval, exercised its
negative discretion option whereby the grant for the three-year period
beginning 2015 was cancelled and therefore there was no pay-out. In addition,
the Company entered into similar LTIP agreements with Thomas A. Barron, the
President of CCB for the years 2015-2017 that allows shares to be earned based
on the compound annual growth rate in diluted earnings per share over a
three-year period. At December 31, 2017, there were three LTIP agreements in
place for the years 2015-2017. The Company recognized $0.4 million and $0.2 million in expense for
years 2017 and 2016, and no expense for the year ended 2015. The Company also
entered into a similar agreement with J. Kimbrough Davis, Chief Financial
Officer of the Company, which is being phased in over a three year period
(2017-2019) that allows shares to be earned based on the compound annual growth
rate in diluted earnings per share. The Company recognized $0.1 million in expense for the
year ended 2017 under this agreement.
DSPP. The Company’s DSPP allows the directors to
purchase the Company’s common stock at a price equal to 90% of the closing
price on the date of purchase. Stock purchases under the DSPP are
limited to the amount of the directors' annual retainer and meeting
fees. Under the 2011 DSPP there were 150,000 shares reserved for
issuance. For 2017, the Company issued 10,340 shares and recognized
approximately $22,000 in expense under the
DSPP. For 2016, the Company issued 15,530 shares and recognized
approximately $23,000 in expense under the
DSPP. For 2015, the Company issued 12,494
shares under the
DSPP and recognized approximately $19,000
in expense related
to this plan. At December 31, 2017, there are 48,380 shares eligible for
issuance under the 2011 DSPP.
ASPP. Under the Company’s ASPP, substantially
all associates may purchase the Company’s common stock through payroll
deductions at a price equal to 90% of the lower of the fair market value at the
beginning or end of each six-month offering period. Stock purchases
under the ASPP are limited to 10% of an associate's eligible compensation, up
to a maximum of $25,000 (fair market value on each
enrollment date) in any plan year. Under the 2011 ASPP there were 593,750 shares of common stock
reserved for issuance. For 2017, 28,874 shares were acquired and
approximately $94,000 in expense was recognized
under the ASPP. For 2016, 44,782 shares were acquired and
approximately $100,000 in expense was recognized
under the ASPP. For 2015, 21,088 shares were acquired under
the ASPP and approximately $52,000 in expense was recognized
related to this plan. At December 31, 2017, 323,576 shares remained eligible
for issuance under the ASPP.
Based on the Black-Scholes option pricing
model, the weighted average estimated fair value of each of the purchase rights
granted under the ASPP was $3.28 for 2017. For
2016 and 2015, the weighted average fair value purchase right granted was $2.22 and $2.36,
respectively. In calculating compensation, the fair value of each
stock purchase right was estimated on the date of grant using the following
weighted average assumptions:
|
|
|
2017
|
|
|
2016
|
|
|
2015
|
|
|
Dividend yield
|
|
1.2
|
%
|
|
1.1
|
%
|
|
0.8
|
%
|
|
Expected volatility
|
|
21.6
|
%
|
|
19.5
|
%
|
|
19.0
|
%
|
|
Risk-free interest rate
|
|
0.9
|
%
|
|
0.4
|
%
|
|
0.1
|
%
|
|
Expected life (in years)
|
|
0.5
|
|
|
0.5
|
|
|
0.5
|
|
Note 12
EMPLOYEE BENEFIT PLANS
Pension Plan
The Company sponsors a noncontributory pension plan covering
substantially all of its associates. Benefits under this plan generally
are based on the associate's total years of service and average of the five
highest years of compensation during the ten years immediately preceding their
departure. The Company’s general funding policy is to contribute amounts
sufficient to meet minimum funding requirements as set by law and to ensure
deductibility for federal income tax purposes.
The following table details on a
consolidated basis the changes in benefit obligation, changes in plan assets,
the funded status of the plan, components of pension expense, amounts
recognized in the Company's consolidated statements of financial condition, and
major assumptions used to determine these amounts.
|
(Dollars
in Thousands)
|
2017
|
|
2016
|
|
2015
|
|
Change in Projected Benefit Obligation:
|
|
|
|
|
|
|
|
|
|
Benefit Obligation at Beginning of Year
|
$
|
152,585
|
|
$
|
141,039
|
|
$
|
140,359
|
|
Service Cost
|
|
6,752
|
|
|
6,453
|
|
|
6,859
|
|
Interest Cost
|
|
5,750
|
|
|
5,587
|
|
|
5,750
|
|
Actuarial Loss (Gain)
|
|
10,877
|
|
|
9,118
|
|
|
(6,880)
|
|
Benefits Paid
|
|
(10,541)
|
|
|
(9,412)
|
|
|
(4,825)
|
|
Expenses Paid
|
|
(339)
|
|
|
(200)
|
|
|
(224)
|
|
Projected Benefit Obligation at End of Year
|
$
|
165,084
|
|
$
|
152,585
|
|
$
|
141,039
|
|
|
|
|
|
|
|
|
|
|
|
Change in Plan Assets:
|
|
|
|
|
|
|
|
|
|
Fair Value of Plan Assets at Beginning of Year
|
$
|
113,813
|
|
$
|
105,792
|
|
$
|
108,172
|
|
Actual Return on Plan Assets
|
|
16,786
|
|
|
7,633
|
|
|
(2,331)
|
|
Employer Contributions
|
|
10,000
|
|
|
10,000
|
|
|
5,000
|
|
Benefits Paid
|
|
(10,541)
|
|
|
(9,412)
|
|
|
(4,825)
|
|
Expenses Paid
|
|
(339)
|
|
|
(200)
|
|
|
(224)
|
|
Fair Value of Plan Assets at End of Year
|
$
|
129,719
|
|
$
|
113,813
|
|
$
|
105,792
|
|
|
|
|
|
|
|
|
|
|
|
Funded Status of Plan and Accrued Liability Recognized at End of
Year:
|
|
|
|
|
|
|
|
|
|
Other Liabilities
|
$
|
35,365
|
|
$
|
38,772
|
|
$
|
35,247
|
|
|
|
|
|
|
|
|
|
|
|
Accumulated Benefit Obligation at End of Year
|
$
|
144,139
|
|
$
|
130,109
|
|
$
|
121,609
|
|
|
|
|
|
|
|
|
|
|
|
Components of Net Periodic Benefit Costs:
|
|
|
|
|
|
|
|
|
|
Service Cost
|
$
|
6,752
|
|
$
|
6,453
|
|
$
|
6,859
|
|
Interest Cost
|
|
5,750
|
|
|
5,587
|
|
|
5,750
|
|
Expected Return on Plan Assets
|
|
(8,026)
|
|
|
(7,736)
|
|
|
(7,820)
|
|
Amortization of Prior Service Costs
|
|
223
|
|
|
278
|
|
|
309
|
|
Net Loss Amortization
|
|
3,812
|
|
|
3,201
|
|
|
3,564
|
|
Net Periodic Benefit Cost
|
$
|
8,511
|
|
$
|
7,783
|
|
$
|
8,662
|
|
|
|
|
|
|
|
|
|
|
|
Weighted-Average Assumptions Used to Determine Benefit
Obligation:
|
|
|
|
|
|
|
|
|
|
Discount Rate
|
|
3.71%
|
|
|
4.21%
|
|
|
4.52%
|
|
Rate of Compensation Increase
|
|
3.25%
|
|
|
3.25%
|
|
|
3.25%
|
|
Measurement Date
|
|
12/31/17
|
|
|
12/31/16
|
|
|
12/31/15
|
|
|
|
|
|
|
|
|
|
|
|
Weighted-Average Assumptions Used to Determine Benefit Cost:
|
|
|
|
|
|
|
|
|
|
Discount Rate
|
|
4.21%
|
|
|
4.52%
|
|
|
4.15%
|
|
Expected Return on Plan Assets
|
|
7.25%
|
|
|
7.50%
|
|
|
7.50%
|
|
Rate of Compensation Increase
|
|
3.25%
|
|
|
3.25%
|
|
|
3.25%
|
|
|
|
|
|
|
|
|
|
|
|
Amortization Amounts from Accumulated Other Comprehensive
Income:
|
|
|
|
|
|
|
|
|
|
Net Actuarial Loss
|
$
|
2,117
|
|
$
|
9,221
|
|
$
|
3,272
|
|
Prior Service Cost
|
|
(223)
|
|
|
(278)
|
|
|
(309)
|
|
Net Loss
|
|
(3,812)
|
|
|
(3,201)
|
|
|
(3,564)
|
|
Deferred Tax (Benefit) Expense
|
|
5,898
|
|
|
(2,216)
|
|
|
232
|
|
Other Comprehensive Loss (Gain), net of tax
|
$
|
3,980
|
|
$
|
3,526
|
|
$
|
(369)
|
|
|
|
|
|
|
|
|
|
|
|
Amounts Recognized in Accumulated Other Comprehensive Income:
|
|
|
|
|
|
|
|
|
|
Net Actuarial Losses
|
$
|
38,698
|
|
$
|
40,392
|
|
$
|
34,373
|
|
Prior Service Cost
|
|
265
|
|
|
488
|
|
|
766
|
|
Deferred Tax Benefit
|
|
(9,876)
|
|
|
(15,772)
|
|
|
(13,556)
|
|
Accumulated Other Comprehensive Loss, net of tax
|
$
|
29,087
|
|
$
|
25,108
|
|
$
|
21,583
|
The Company expects to recognize $3.7 million of the net actuarial
loss and $0.2 million of the prior service cost reflected in accumulated other
comprehensive income at December 31, 2017 as a component of net periodic
benefit cost during 2018.
Effective December 31, 2015, the Company
changed the method used to estimate the service and interest components of net
periodic benefit cost for the defined benefit and supplemental executive
retirement plans. This new estimation approach discounts the individual
expected cash flows underlying the service cost and interest cost using the
applicable spot rates derived from the yield curve used to discount the cash
flows for the benefit obligations. Historically, the estimated service
and interest cost components utilized a single weighted-average discount rate
derived from the yield curve used to measure the benefit obligations at the
beginning of the period. The Company elected this change to provide a more
precise measurement of service and interest costs by improving the correlation
between projected benefit cash flows to the corresponding spot yield curve
rates. The change was accounted for as a change in accounting estimate
that is inseparable from a change in accounting principle and accordingly was
accounted for prospectively, with the resulting change impacting the
recognition of net periodic benefit expense beginning January 1, 2016.
Plan Assets. The Company’s pension plan asset
allocation at year-end 2017 and 2016, and the target asset allocation for 2018
are as follows:
|
|
|
Target
|
|
|
Percentage of Plan
|
|
|
|
|
Allocation
|
|
|
Assets at Year-End(1)
|
|
|
|
|
2018
|
|
|
2017
|
|
|
2016
|
|
|
Equity Securities
|
|
70
|
%
|
|
74
|
%
|
|
66
|
%
|
|
Debt Securities
|
|
25
|
%
|
|
21
|
%
|
|
20
|
%
|
|
Cash and Cash Equivalents
|
|
5
|
%
|
|
5
|
%
|
|
14
|
%
|
|
Total
|
|
100
|
%
|
|
100
|
%
|
|
100
|
%
|
(1) Represents
asset allocation at year-end which may differ from the average target
allocation for the year due to the year-end cash contribution to the plan.
The Company’s pension plan assets are
overseen by the CCBG Retirement Committee. Capital City Trust
Company acts as the investment manager for the plan. The investment
strategy is to maximize return on investments while minimizing
risk. The Company believes the best way to accomplish this goal is
to take a conservative approach to its investment strategy by investing in
mutual funds that include various high-grade equity securities and
investment-grade debt issuances with varying investment strategies. The
overall expected long-term rate of return on assets is a weighted-average
expectation for the return on plan assets. The Company considers
historical performance data and economic/financial data to arrive at expected
long-term rates of return for each asset category.
The major categories of assets in the Company’s pension plan as of
December 31 are presented in the following table. Assets are segregated by the
level of the valuation inputs within the fair value hierarchy established by
ASC Topic 820 utilized to measure fair value (see Note 19 – Fair Value
Measurements).
|
(Dollars in Thousands)
|
|
2017
|
|
2016
|
|
Level 1:
|
|
|
|
|
|
|
|
Mutual Funds
|
|
$
|
118,474
|
|
$
|
96,079
|
|
Cash and Cash Equivalents
|
|
|
7,103
|
|
|
15,345
|
|
|
|
|
|
|
|
|
|
Level 2:
|
|
|
|
|
|
|
|
U.S. Government Agency
|
|
|
4,142
|
|
|
2,389
|
|
|
|
|
|
|
|
|
|
Total Fair Value of Plan Assets
|
|
$
|
129,719
|
|
$
|
113,813
|
|
Expected Benefit Payments. As of December 31, expected benefit
payments related to the defined benefit pension plan were as follows:
|
|
|
|
|
|
|
(Dollars in Thousands)
|
|
2017
|
|
2018
|
|
$
|
11,487
|
|
2019
|
|
|
11,471
|
|
2020
|
|
|
10,563
|
|
2021
|
|
|
12,488
|
|
2022
|
|
|
10,936
|
|
2023 through 2027
|
|
|
57,441
|
|
Total
|
|
$
|
114,386
|
Contributions. The following table details the amounts
contributed to the pension plan in 2016 and 2017, and the expected amount to be
contributed in 2018.
|
|
|
|
|
|
|
|
|
Expected
|
|
|
|
|
|
|
|
|
|
Contribution
|
|
(Dollars in Thousands)
|
|
|
2016
|
|
|
2017
|
|
2018(1)
|
|
Actual Contributions
|
|
$
|
10,000
|
|
$
|
10,000
|
|
$
|
10,000
|
(1) For 2018, the Company will have the
option to make a cash contribution to the plan or utilize pre-funding balances.
Supplemental
Executive Retirement Plan
The Company has a Supplemental Executive Retirement Plan (“SERP”) covering selected executive officers.
Benefits under this plan generally are based on the same service and
compensation as used for the pension plan, except the benefits are calculated
without regard to the limits set by the Internal Revenue Code on compensation
and benefits. The net benefit payable from the SERP is the difference
between this gross benefit and the benefit payable by the pension plan.
The following table details on a
consolidated basis the changes in benefit obligation, the funded status of the
plan, components of pension expense, amounts recognized in the Company's
consolidated statements of financial condition, and major assumptions used to
determine these amounts.
|
(Dollars in Thousands)
|
2017
|
|
2016
|
|
2015
|
|
Change in Projected Benefit Obligation:
|
|
|
|
|
|
|
|
|
|
Benefit Obligation at Beginning of Year
|
$
|
5,741
|
|
$
|
4,842
|
|
$
|
3,003
|
|
Service Cost
|
|
-
|
|
|
-
|
|
|
3
|
|
Interest Cost
|
|
191
|
|
|
162
|
|
|
133
|
|
Actuarial Loss
|
|
1,353
|
|
|
737
|
|
|
1,703
|
|
Projected Benefit Obligation at End of Year
|
$
|
7,285
|
|
$
|
5,741
|
|
$
|
4,842
|
|
|
|
|
|
|
|
|
|
|
|
Funded Status of Plan and Accrued Liability Recognized at End of
Year:
|
|
|
|
|
|
|
|
|
|
|
|
|
|
|
|
|
|
|
|
Other Liabilities
|
$
|
7,285
|
|
$
|
5,741
|
|
$
|
4,842
|
|
|
|
|
|
|
|
|
|
|
|
Accumulated Benefit Obligation at End of Year
|
$
|
6,485
|
|
$
|
4,913
|
|
$
|
4,348
|
|
|
|
|
|
|
|
|
|
|
|
Components of Net Periodic Benefit Costs:
|
|
|
|
|
|
|
|
|
|
Service Cost
|
$
|
-
|
|
$
|
-
|
|
$
|
3
|
|
Interest Cost
|
|
191
|
|
|
162
|
|
|
133
|
|
Amortization of Prior Service Cost
|
|
-
|
|
|
-
|
|
|
7
|
|
Net Loss Amortization
|
|
597
|
|
|
759
|
|
|
179
|
|
Net Periodic Benefit Cost
|
$
|
788
|
|
$
|
921
|
|
$
|
322
|
|
|
|
|
|
|
|
|
|
|
|
Weighted-Average Assumptions Used to Determine Benefit
Obligation:
|
|
|
|
|
|
|
|
|
|
Discount Rate
|
|
3.53%
|
|
|
3.92%
|
|
|
4.13%
|
|
Rate of Compensation Increase
|
|
3.25%
|
|
|
3.25%
|
|
|
3.25%
|
|
Measurement Date
|
|
12/31/17
|
|
|
12/31/16
|
|
|
12/31/15
|
|
|
|
|
|
|
|
|
|
|
|
Weighted-Average Assumptions Used to Determine Benefit Cost:
|
|
|
|
|
|
|
|
|
|
Discount Rate
|
|
3.92%
|
|
|
4.13%
|
|
|
4.15%
|
|
Rate of Compensation Increase
|
|
3.25%
|
|
|
3.25%
|
|
|
3.25%
|
|
|
|
|
|
|
|
|
|
|
|
Amortization Amounts from Accumulated Other Comprehensive
Income:
|
|
|
|
|
|
|
|
|
|
Net Actuarial Loss
|
$
|
1,353
|
|
$
|
737
|
|
$
|
1,703
|
|
Prior Service Cost
|
|
-
|
|
|
-
|
|
|
(7)
|
|
Net Loss
|
|
(597)
|
|
|
(759)
|
|
|
(179)
|
|
Deferred Tax (Benefit) Expense
|
|
(77)
|
|
|
8
|
|
|
(585)
|
|
Other Comprehensive Loss (Gain), net of tax
|
$
|
679
|
|
$
|
(14)
|
|
$
|
932
|
|
|
|
|
|
|
|
|
|
|
|
Amounts Recognized in Accumulated Other Comprehensive Income:
|
|
|
|
|
|
|
|
|
|
Net Actuarial Loss
|
$
|
1,626
|
|
$
|
870
|
|
$
|
892
|
|
Deferred Tax Benefit
|
|
(412)
|
|
|
(336)
|
|
|
(344)
|
|
Accumulated Other Comprehensive Loss, net of tax
|
$
|
1,214
|
|
$
|
534
|
|
$
|
548
|
The Company expects to recognize approximately $1.6 million of the
net actuarial loss reflected in accumulated other comprehensive income at
December 31, 2017 as a component of net periodic benefit cost during 2018.
Effective December 31, 2015, the Company
changed the method used to estimate the service and interest components of net
periodic benefit cost for the supplemental executive retirement plans to mirror
the change previously noted for the defined benefit plan.
Expected Benefit Payments. As of December 31, expected benefit
payments related to the SERP were as follows:
|
(Dollars in Thousands)
|
|
2017
|
|
2018
|
|
$
|
3,427
|
|
2019
|
|
|
3,995
|
|
2020
|
|
|
-
|
|
2021
|
|
|
-
|
|
2022
|
|
|
-
|
|
2023 through 2027
|
|
|
-
|
|
Total
|
|
$
|
7,422
|
401(k) Plan
The Company has a 401(k) Plan which
enables associates to defer a portion of their salary on a pre-tax
basis. The plan covers substantially all associates of the Company
who meet minimum age requirements. The plan is designed to enable
participants to elect to have an amount from 1% to 15% of their compensation
withheld in any plan year placed in the 401(k) Plan trust account. Matching
contributions of 50% from the Company are made up to 6% of the participant's
compensation for eligible associates. During 2017, the Company made matching
contributions of $0.6 million. For the years
2016 and 2015, the Company made matching contributions of $0.6 and $0.5 million, respectively.
The participant may choose to invest their contributions into twenty-seven
investment options available to 401(k) participants, including the Company’s
common stock. A total of 50,000 shares of CCBG common
stock have been reserved for issuance. Shares issued to participants
have historically been purchased in the open market.
Other Plans
The Company has a Dividend Reinvestment
and Optional Stock Purchase Plan. A total of 250,000 shares have been reserved
for issuance. In recent years, shares for the Dividend Reinvestment
and Optional Stock Purchase Plan have been acquired in the open market and,
thus, the Company did not issue any shares under this plan in 2017, 2016 and 2015.
Note 13
EARNINGS PER SHARE
The following table sets forth the
computation of basic and diluted earnings per share:
|
(Dollars and Per Share Data in Thousands)
|
|
2017
|
|
2016
|
|
2015
|
|
Numerator:
|
|
|
|
|
|
|
|
|
|
|
Net Income
|
|
$
|
10,863
|
|
$
|
11,746
|
|
$
|
9,116
|
|
|
|
|
|
|
|
|
|
|
|
|
Denominator:
|
|
|
|
|
|
|
|
|
|
|
Denominator for Basic Earnings Per Share Weighted-Average Shares
|
|
|
16,952
|
|
|
16,989
|
|
|
17,273
|
|
Effects of Dilutive Securities Stock Compensation Plans
|
|
|
61
|
|
|
72
|
|
|
45
|
|
|
|
|
|
|
|
|
|
|
|
|
Denominator for Diluted Earnings Per Share Adjusted
Weighted-Average
Shares and Assumed Conversions
|
|
|
17,013
|
|
|
17,061
|
|
|
17,318
|
|
|
|
|
|
|
|
|
|
|
|
|
Basic Earnings Per Share
|
|
$
|
0.64
|
|
$
|
0.69
|
|
$
|
0.53
|
|
Diluted Earnings Per Share
|
|
$
|
0.64
|
|
$
|
0.69
|
|
$
|
0.53
|
Note 14
REGULATORY MATTERS
Regulatory Capital Requirements. The Company (on a consolidated basis) and the Bank are
subject to various regulatory capital requirements administered by the federal
banking agencies. Failure to meet minimum capital requirements can initiate
certain mandatory and possible additional discretionary actions by regulators
that, if undertaken, could have a direct material effect on the Company and
Bank’s financial statements. Under capital adequacy guidelines and the regulatory framework for prompt corrective action, the Company and the Bank must meet
specific capital guidelines that involve quantitative measures of their assets,
liabilities and certain off-balance sheet items as calculated under regulatory
accounting practices. The capital amounts and classification are also subject
to qualitative judgments by the regulators about components, risk weightings,
and other factors. Prompt corrective action provisions are not applicable to
bank holding companies.
The final rules implementing Basel Committee on Banking
Supervision’s capital guidelines for U.S. banks (Basel III rules) became
effective for the Company on January 1, 2015 (subject to a phase-in period for
certain provisions). Quantitative measures established by regulation to ensure
capital adequacy require the Company and the Bank to maintain minimum amounts
and ratios (set forth in the following table) of common equity tier 1, total
capital (as defined in the regulations) to risk-weighted assets (as defined)
and of tier 1 capital (as defined) to average assets (as defined). Under the
Basel III rules, the Company must hold a capital conservation buffer above the
well capitalized risk-based capital ratios. The capital conservation buffer is
being phased in as follows: 1.25% in 2017, 1.875% in 2018, and 2.50% in 2019. Management believes, at
December 31, 2017 and 2016, that the Company and the Bank meet all capital
adequacy requirements to which they are subject.
At December 31, 2017, the most recent
notification from the Federal Deposit Insurance Corporation categorized the
Bank as well capitalized under the regulatory framework for prompt corrective
action. To be categorized as well capitalized, an institution must maintain
minimum common equity tier 1, total risk-based, tier 1 risk based and tier 1
leverage ratios as set forth in the following tables. There are not conditions
or events since the notification that management believes have changed the
Bank’s category. The Company and Bank’s actual capital amounts and ratios at
December 31, 2017 and 2016 are presented in the following table.
|
|
|
|
|
|
|
|
|
|
|
|
|
To Be Well-
|
|
|
|
|
|
|
|
|
|
|
|
|
|
Capitalized Under
|
|
|
|
|
|
|
|
|
Required
|
|
Prompt
|
|
|
|
|
|
|
|
|
For Capital
|
|
Corrective
|
|
|
|
Actual
|
|
Adequacy Purposes
|
|
Action Provisions
|
|
(Dollars in Thousands)
|
|
Amount
|
|
Ratio
|
|
Amount
|
|
Ratio
|
|
Amount
|
|
Ratio
|
|
2017
|
|
|
|
|
|
|
|
|
|
|
|
|
|
|
|
|
Common Equity Tier 1:
|
|
|
|
|
|
|
|
|
|
|
|
|
|
|
|
|
CCBG
|
|
$
|
234,477
|
|
13.42%
|
|
$
|
78,648
|
|
4.50%
|
|
|
*
|
|
*
|
|
CCB
|
|
|
275,796
|
|
15.83%
|
|
|
78,418
|
|
4.50%
|
|
$
|
113,270
|
|
6.50%
|
|
|
|
|
|
|
|
|
|
|
|
|
|
|
|
|
|
|
Tier 1 Capital:
|
|
|
|
|
|
|
|
|
|
|
|
|
|
|
|
|
CCBG
|
|
|
285,477
|
|
16.33%
|
|
|
104,864
|
|
6.00%
|
|
|
*
|
|
*
|
|
CCB
|
|
|
275,796
|
|
15.83%
|
|
|
104,557
|
|
6.00%
|
|
|
139,410
|
|
8.00%
|
|
|
|
|
|
|
|
|
|
|
|
|
|
|
|
|
|
|
Total Capital:
|
|
|
|
|
|
|
|
|
|
|
|
|
|
|
|
|
CCBG
|
|
|
298,784
|
|
17.10%
|
|
|
139,819
|
|
8.00%
|
|
|
*
|
|
*
|
|
CCB
|
|
|
289,103
|
|
16.59%
|
|
|
139,410
|
|
8.00%
|
|
|
174,262
|
|
10.00%
|
|
|
|
|
|
|
|
|
|
|
|
|
|
|
|
|
|
|
Tier 1 Leverage:
|
|
|
|
|
|
|
|
|
|
|
|
|
|
|
|
|
CCBG
|
|
|
285,477
|
|
10.47%
|
|
|
109,082
|
|
4.00%
|
|
|
*
|
|
*
|
|
CCB
|
|
|
275,796
|
|
10.14%
|
|
|
108,764
|
|
4.00%
|
|
|
135,956
|
|
5.00%
|
|
|
|
|
|
|
|
|
|
|
|
|
|
|
|
|
|
|
2016
|
|
|
|
|
|
|
|
|
|
|
|
|
|
|
|
|
Common Equity Tier 1:
|
|
|
|
|
|
|
|
|
|
|
|
|
|
|
|
|
CCBG
|
|
$
|
220,211
|
|
12.61%
|
|
$
|
78,587
|
|
4.50%
|
|
|
*
|
|
*
|
|
CCB
|
|
|
268,811
|
|
15.44%
|
|
|
78,356
|
|
4.50%
|
|
$
|
113,182
|
|
6.50%
|
|
|
|
|
|
|
|
|
|
|
|
|
|
|
|
|
|
|
Tier 1 Capital:
|
|
|
|
|
|
|
|
|
|
|
|
|
|
|
|
|
CCBG
|
|
|
270,801
|
|
15.51%
|
|
|
104,783
|
|
6.00%
|
|
|
*
|
|
*
|
|
CCB
|
|
|
268,811
|
|
15.44%
|
|
|
104,475
|
|
6.00%
|
|
|
139,300
|
|
8.00%
|
|
|
|
|
|
|
|
|
|
|
|
|
|
|
|
|
|
|
Total Capital:
|
|
|
|
|
|
|
|
|
|
|
|
|
|
|
|
|
CCBG
|
|
|
284,232
|
|
16.28%
|
|
|
139,710
|
|
8.00%
|
|
|
*
|
|
*
|
|
CCB
|
|
|
282,242
|
|
16.21%
|
|
|
139,300
|
|
8.00%
|
|
|
174,126
|
|
10.00%
|
|
|
|
|
|
|
|
|
|
|
|
|
|
|
|
|
|
|
Tier 1 Leverage:
|
|
|
|
|
|
|
|
|
|
|
|
|
|
|
|
|
CCBG
|
|
|
270,801
|
|
10.23%
|
|
|
105,909
|
|
4.00%
|
|
|
*
|
|
*
|
|
CCB
|
|
|
268,811
|
|
10.18%
|
|
|
105,652
|
|
4.00%
|
|
|
132,066
|
|
5.00%
|
|
|
|
|
|
|
|
|
|
|
|
|
|
|
|
|
|
|
* Not applicable to bank holding companies.
|
|
|
|
|
|
|
|
|
|
|
|
|
Dividend Restrictions. In the ordinary course of business, the Company is dependent
upon dividends from its banking subsidiary to provide funds for the payment of
dividends to shareowners and to provide for other cash requirements. Banking
regulations may limit the amount of dividends that may be paid. Approval by
regulatory authorities is required if the effect of dividends declared would
cause the regulatory capital of the Company’s banking subsidiary to fall below
specified minimum levels. Approval is also required if dividends declared
exceed the net profits of the banking subsidiary for that year combined with
the retained net profits for proceeding two years. In 2018, the bank
subsidiary may declare dividends without regulatory approval of $3.4 million plus an additional
amount equal to net profits of the Company’s subsidiary bank for 2018 up to the
date of any such dividend declaration.
Note 15
OTHER COMPREHENSIVE INCOME (LOSS)
FASB Topic ASC 220,
“Comprehensive Income” requires that certain transactions and other economic
events that bypass the income statement be displayed as other comprehensive
income. Total
comprehensive income is reported in the consolidated statements of
comprehensive income and changes in shareowners’ equity.
The Company elected to early adopt FASB
ASU 2018-02, Income Statement – Reporting Comprehensive Income (Topic 220):
Reclassification of Certain Tax Effects from Accumulated Other Comprehensive
Income and reclassify to retained earnings the stranded effects in
accumulated other comprehensive income related to the Tax Act.
The following table summarizes the tax
effects for each component of other comprehensive income (loss) and includes
separately the reclassification adjustment for investment securities and
benefit plans:
|
|
|
Before
|
|
Tax
|
|
Net of
|
|
|
|
Tax
|
|
(Expense)
|
|
Tax
|
|
(Dollars in Thousands)
|
|
Amount
|
|
Benefit
|
|
Amount
|
|
2017
|
|
|
|
|
|
|
|
|
|
|
Investment Securities:
|
|
|
|
|
|
|
|
|
|
|
Change in net unrealized gain/loss on securities available for
sale
|
|
$
|
(1,459)
|
|
$
|
564
|
|
$
|
(895)
|
|
Amortization of losses on securities transferred from available
for sale to
|
|
|
|
|
|
|
|
|
|
|
held to maturity
|
|
|
73
|
|
|
(29)
|
|
|
44
|
|
Total Investment Securities
|
|
|
(1,386)
|
|
|
535
|
|
|
(851)
|
|
Benefit Plans:
|
|
|
|
|
|
|
|
|
|
|
Reclassification adjustment for amortization of prior service
cost
|
|
|
223
|
|
|
(86)
|
|
|
137
|
|
Reclassification adjustment for amortization of net loss
|
|
|
4,409
|
|
|
(1,622)
|
|
|
2,787
|
|
Current year actuarial loss
|
|
|
(3,470)
|
|
|
1,159
|
|
|
(2,311)
|
|
Total Benefit Plans
|
|
|
1,162
|
|
|
(549)
|
|
|
613
|
|
|
|
|
|
|
|
|
|
|
|
|
Total Other Comprehensive Loss
|
|
$
|
(224)
|
|
$
|
(14)
|
|
$
|
(238)
|
|
|
|
|
|
|
|
|
|
|
|
|
2016
|
|
|
|
|
|
|
|
|
|
|
Investment Securities:
|
|
|
|
|
|
|
|
|
|
|
Change in net unrealized gain/loss on securities available for
sale
|
|
$
|
(828)
|
|
$
|
322
|
|
$
|
(506)
|
|
Amortization of losses on securities transferred from available
for sale to
|
|
|
|
|
|
|
|
|
|
|
held to maturity
|
|
|
82
|
|
|
(32)
|
|
|
50
|
|
Total Investment Securities
|
|
|
(746)
|
|
|
290
|
|
|
(456)
|
|
Benefit Plans:
|
|
|
|
|
|
|
|
|
|
|
Reclassification adjustment for amortization of prior service
cost
|
|
|
278
|
|
|
(107)
|
|
|
171
|
|
Reclassification adjustment for amortization of net loss
|
|
|
3,960
|
|
|
(1,528)
|
|
|
2,432
|
|
Current year actuarial loss
|
|
|
(9,958)
|
|
|
3,843
|
|
|
(6,115)
|
|
Total Benefit Plans
|
|
|
(5,720)
|
|
|
2,208
|
|
|
(3,512)
|
|
|
|
|
|
|
|
|
|
|
|
|
Total Other Comprehensive Loss
|
|
$
|
(6,466)
|
|
$
|
2,498
|
|
$
|
(3,968)
|
|
|
|
|
|
|
|
|
|
|
|
|
2015
|
|
|
|
|
|
|
|
|
|
|
Investment Securities:
|
|
|
|
|
|
|
|
|
|
|
Change in net unrealized gain/loss on securities available for
sale
|
|
$
|
(373)
|
|
$
|
143
|
|
$
|
(230)
|
|
Amortization of losses on securities transferred from available
for sale to
|
|
|
|
|
|
|
|
|
|
|
held to maturity
|
|
|
76
|
|
|
(31)
|
|
|
45
|
|
Total Investment Securities
|
|
|
(297)
|
|
|
112
|
|
|
(185)
|
|
Benefit Plans:
|
|
|
|
|
|
|
|
|
|
|
Reclassification adjustment for amortization of prior service
cost
|
|
|
316
|
|
|
(122)
|
|
|
194
|
|
Reclassification adjustment for amortization of net loss
|
|
|
3,743
|
|
|
(1,444)
|
|
|
2,299
|
|
Current year actuarial loss
|
|
|
(4,975)
|
|
|
1,919
|
|
|
(3,056)
|
|
Total Benefit Plans
|
|
|
(916)
|
|
|
353
|
|
|
(563)
|
|
|
|
|
|
|
|
|
|
|
|
|
Total Other Comprehensive Loss
|
|
$
|
(1,213)
|
|
$
|
465
|
|
$
|
(748)
|
|
Accumulated other comprehensive loss was
comprised of the following components:
|
|
|
|
|
|
|
|
|
|
|
|
|
|
|
|
|
|
|
|
|
|
|
|
Accumulated
|
|
|
|
Securities
|
|
|
|
|
Other
|
|
|
|
Available
|
|
Retirement
|
|
Comprehensive
|
|
(Dollars in Thousands)
|
|
for Sale
|
|
Plans
|
|
Loss
|
|
Balance as of January 1, 2017
|
|
$
|
(583)
|
|
$
|
(25,642)
|
|
$
|
(26,225)
|
|
Other comprehensive loss during the period
|
|
|
(851)
|
|
|
613
|
|
|
(238)
|
|
Adoption of ASU No. 2018-02
|
|
|
(309)
|
|
|
(5,272)
|
|
|
(5,581)
|
|
Balance as of December 31, 2017
|
|
$
|
(1,743)
|
|
$
|
(30,301)
|
|
$
|
(32,044)
|
|
|
|
|
|
|
|
|
|
|
|
|
Balance as of January 1, 2016
|
|
$
|
(127)
|
|
$
|
(22,130)
|
|
$
|
(22,257)
|
|
Other comprehensive loss during the period
|
|
|
(456)
|
|
|
(3,512)
|
|
|
(3,968)
|
|
Balance as of December 31, 2016
|
|
$
|
(583)
|
|
$
|
(25,642)
|
|
$
|
(26,225)
|
|
|
|
|
|
|
|
|
|
|
|
|
Balance as of January 1, 2015
|
|
$
|
59
|
|
$
|
(21,568)
|
|
$
|
(21,509)
|
|
Other comprehensive income (loss) during the period
|
|
|
(186)
|
|
|
(562)
|
|
|
(748)
|
|
Balance as of December 31, 2015
|
|
$
|
(127)
|
|
$
|
(22,130)
|
|
$
|
(22,257)
|
Note 16
RELATED PARTY TRANSACTIONS
At December 31, 2017 and 2016, certain
officers and directors were indebted to the Company’s bank subsidiary in the
aggregate amount of $7.4 million and $8.5 million,
respectively. During 2017, $7.3 million in new loans were
made and repayments totaled $8.4 million. In the
opinion of management, these loans were made on similar terms as loans to other
individuals of comparable creditworthiness and were all current at year-end.
Deposits from certain directors, executive
officers, and their related interests totaled $26.6 million and $17.9 million at December 31,
2017 and 2016, respectively.
Under a lease agreement expiring in 2024,
the Bank leases land from a partnership in which several directors and officers
have an interest. The lease agreement with Smith Interests General Partnership
L.L.P. provides for annual lease payments of approximately $170,000, to be adjusted for
inflation in future years.
In March 2017, the Company entered into an
agreement with Mettler Limited Partnership, a related party of Thomas A.
Barron, President of Capital City Bank and a director of the Company, to
acquire a $1,000,000 loan participation
interest in a loan originated by Capital City Bank. This transaction was
reviewed and approved in accordance with the Company’s Related Party
Transaction Policy.
William G. Smith, III, the son of our Chairman, President and
Chief Executive Officer, William G. Smith, Jr., is employed as a Vice President
of Capital City Bank. In 2017, William G. Smith, III’s total compensation
(consisting of annual base salary, annual bonus, and stock-based compensation)
was approximately $143,500. His compensation was
determined in accordance with our standard employment and compensation practices
applicable to associates with similar responsibilities and positions.
Note 17
OTHER NONINTEREST EXPENSE
Components of other noninterest expense in
excess of 1% of the sum of total interest income and noninterest income, which
are not disclosed separately elsewhere, are presented below for each of the
respective years.
|
(Dollars in Thousands)
|
|
2017
|
|
2016
|
|
2015
|
|
Legal Fees
|
|
|
1,933
|
|
|
2,311
|
|
|
2,506
|
|
Professional Fees
|
|
|
3,689
|
|
|
3,424
|
|
|
3,789
|
|
Telephone
|
|
|
2,405
|
|
|
2,296
|
|
|
1,976
|
|
Advertising
|
|
|
1,731
|
|
|
1,702
|
|
|
1,391
|
|
Processing Services
|
|
|
6,253
|
|
|
6,471
|
|
|
6,540
|
|
Insurance – Other
|
|
|
1,626
|
|
|
2,060
|
|
|
2,737
|
|
Other
|
|
|
7,961
|
|
|
8,021
|
|
|
8,211
|
|
Total
|
|
$
|
25,598
|
|
$
|
26,285
|
|
$
|
27,150
|
Note 18
COMMITMENTS AND CONTINGENCIES
Lending Commitments. The Company is a party to
financial instruments with off-balance sheet risks in the normal course of
business to meet the financing needs of its clients. These financial
instruments consist of commitments to extend credit and standby letters of
credit.
The Company’s maximum exposure to credit
loss under standby letters of credit and commitments to extend credit is
represented by the contractual amount of those instruments. The
Company uses the same credit policies in establishing commitments and issuing
letters of credit as it does for on-balance sheet instruments. At
December 31, the amounts associated with the Company’s off-balance sheet
obligations were as follows:
|
|
|
2017
|
|
2016
|
|
(Dollars in Thousands)
|
|
Fixed
|
|
Variable
|
|
Total
|
|
Fixed
|
|
Variable
|
|
Total
|
|
Commitments to Extend Credit(1)
|
|
$
|
78,390
|
|
$
|
366,750
|
|
$
|
445,140
|
|
$
|
69,993
|
|
$
|
332,420
|
|
$
|
402,413
|
|
Standby Letters of Credit
|
|
|
4,678
|
|
|
-
|
|
|
4,678
|
|
|
4,768
|
|
|
-
|
|
|
4,768
|
|
Total
|
|
$
|
83,068
|
|
$
|
366,750
|
|
$
|
449,818
|
|
$
|
74,761
|
|
$
|
332,420
|
|
$
|
407,181
|
|
|
|
|
|
|
|
|
|
|
|
|
|
|
|
|
|
|
|
|
|
(1) Commitments include unfunded loans, revolving lines of credit,
and other unused commitments.
|
|
|
|
Commitments to extend credit are agreements to lend to a client so
long as there is no violation of any condition established in the contract.
Commitments generally have fixed expiration dates or other termination clauses
and may require payment of a fee. Since many of the commitments are expected to
expire without being drawn upon, the total commitment amounts do not
necessarily represent future cash requirements.
Standby letters of credit are conditional
commitments issued by the Company to guarantee the performance of a client to a
third party. The credit risk involved in issuing letters of credit
is essentially the same as that involved in extending loan facilities. In
general, management does not anticipate any material losses as a result of
participating in these types of transactions. However, any potential
losses arising from such transactions are reserved for in the same manner as
management reserves for its other credit facilities.
For both on- and off-balance sheet
financial instruments, the Company requires collateral to support such
instruments when it is deemed necessary. The Company evaluates each
client’s creditworthiness on a case-by-case basis. The amount of
collateral obtained upon extension of credit is based on management’s credit
evaluation of the counterparty. Collateral held varies, but may
include deposits held in financial institutions; U.S. Treasury securities;
other marketable securities; real estate; accounts receivable; property, plant
and equipment; and inventory.
Other Commitments. In the normal course of
business, the Company enters into lease commitments which are classified as
operating leases. Rent expense incurred under these leases was
approximately $0.5 million in 2017, $0.5 million in 2016, and $0.5 million in
2015. Minimum lease payments under these leases due in each of the
five years subsequent to December 31, 2017, are as follows (dollars in
millions): 2018, $0.5; 2019, $0.4; 2020, $0.4; 2021, $0.4, thereafter, $2.0.
Contingencies. The Company is a party to
lawsuits and claims arising out of the normal course of business. In
management's opinion, there are no known pending claims or litigation, the
outcome of which would, individually or in the aggregate, have a material
effect on the consolidated results of operations, financial position, or cash
flows of the Company.
Indemnification Obligation. The Company is a member of the Visa
U.S.A. network. Visa U.S.A believes that its member banks are required to
indemnify it for potential future settlement of certain litigation (the “Covered
Litigation”) that relates to several antitrust lawsuits challenging the
practices of Visa and MasterCard International. In 2008, the Company, as a
member of the Visa U.S.A. network, obtained Class B shares of Visa, Inc. upon
its initial public offering. Since its initial public offering, Visa, Inc. has
funded a litigation reserve for the Covered Litigation resulting in a reduction
in the Class B shares held by the Company. During the first quarter of 2011,
the Company sold its remaining Class B shares resulting in a $3.2 million pre-tax gain.
Associated with this sale, the Company entered into a swap contract with the
purchaser of the shares that requires a payment to the counterparty in the
event that Visa, Inc. makes subsequent revisions to the conversion ratio for
its Class B shares. Further information on the swap contract is contained
within Note 19 below. Fixed charges included in the swap liability are payable
quarterly until the litigation reserve is fully liquidated and at which time the
aforementioned swap contract will be terminated. Quarterly payments during
2017 totaled $371,000. Conversion ratio
payments and ongoing fixed quarterly charges are reflected in earnings in the
period incurred.
Note
19
FAIR
VALUE MEASUREMENTS
The fair value of
an asset or liability is the price that would be received to sell that asset or
paid to transfer that liability in an orderly transaction occurring in the
principal market (or most advantageous market in the absence of a principal
market) for such asset or liability. In estimating fair value, the Company
utilizes valuation techniques that are consistent with the market approach, the
income approach and/or the cost approach. Such valuation techniques are
consistently applied. Inputs to valuation techniques include the assumptions
that market participants would use in pricing an asset or liability. ASC
Topic 820 establishes a fair value hierarchy for valuation inputs that gives
the highest priority to quoted prices in active markets for identical assets or
liabilities and the lowest priority to unobservable inputs. The fair value
hierarchy is as follows:
·
Level 1 Inputs - Unadjusted quoted prices in
active markets for identical assets or liabilities that the reporting entity
has the ability to access at the measurement date.
·
Level 2 Inputs - Inputs other than quoted
prices included in Level 1 that are observable for the asset or liability,
either directly or indirectly. These might include quoted prices for similar
assets or liabilities in active markets, quoted prices for identical or similar
assets or liabilities in markets that are not active, inputs other than quoted prices
that are observable for the asset or liability (such as interest rates,
volatilities, prepayment speeds, credit risks, etc.) or inputs that are derived
principally from, or corroborated, by market data by correlation or other means.
·
Level 3 Inputs - Unobservable inputs for
determining the fair values of assets or liabilities that reflect an entity's
own assumptions about the assumptions that market participants would use in
pricing the assets or liabilities.
Assets and
Liabilities Measured at Fair Value on a Recurring Basis
Securities
Available for Sale. U.S.
Treasury securities are reported at fair value utilizing Level 1 inputs. Other
securities classified as available for sale are reported at fair value
utilizing Level 2 inputs. For these securities, the Company obtains fair value
measurements from an independent pricing service. The fair value measurements
consider observable data that may include dealer quotes, market spreads, cash
flows, the U.S. Treasury yield curve, live trading levels, trade execution
data, credit information and the bond’s terms and conditions, among other
things.
In general, the
Company does not purchase securities that have a complicated structure. The
Company’s entire portfolio consists of traditional investments, nearly all of
which are U.S. Treasury obligations, federal agency bullet or mortgage
pass-through securities, or general obligation or revenue based municipal
bonds. Pricing for such instruments is easily obtained. From time to time,
the Company will validate, on a sample basis, prices supplied by the
independent pricing service by comparison to prices obtained from third-party
sources or derived using internal models.
Fair Value Swap. The Company entered into a stand-alone
derivative contract with the purchaser of its Visa Class B shares. The
valuation represents the amount due and payable to the counterparty based upon
the revised share conversion rate, if any, during the period. At December 31,
2017, there were no amounts payable.
A summary of fair values for assets and liabilities at December 31
consisted of the following:
|
(Dollars in Thousands)
|
|
Level 1
|
|
Level 2
|
|
Level 3
|
|
Total Fair
|
|
|
|
Inputs
|
|
Inputs
|
|
Inputs
|
|
Value
|
|
2017
|
|
|
|
|
|
|
|
|
|
|
|
|
|
Securities Available for Sale:
|
|
|
|
|
|
|
|
|
|
|
|
|
|
U.S. Government Treasury
|
|
$
|
235,341
|
|
$
|
-
|
|
$
|
-
|
|
$
|
235,341
|
|
U.S. Government Agency
|
|
|
-
|
|
|
144,644
|
|
|
-
|
|
|
144,644
|
|
States and Political Subdivisions
|
|
|
-
|
|
|
91,157
|
|
|
-
|
|
|
91,157
|
|
Mortgage-Backed Securities
|
|
|
-
|
|
|
1,185
|
|
|
-
|
|
|
1,185
|
|
Equity Securities
|
|
|
-
|
|
|
8,584
|
|
|
-
|
|
|
8,584
|
|
|
|
|
|
|
|
|
|
|
|
|
|
|
|
2016
|
|
|
|
|
|
|
|
|
|
|
|
|
|
Securities Available for Sale:
|
|
|
|
|
|
|
|
|
|
|
|
|
|
U.S. Government Treasury
|
|
$
|
286,278
|
|
$
|
-
|
|
$
|
-
|
|
$
|
286,278
|
|
U.S. Government Agency
|
|
|
-
|
|
|
131,640
|
|
|
-
|
|
|
131,640
|
|
State and Political Subdivisions
|
|
|
-
|
|
|
94,839
|
|
|
-
|
|
|
94,839
|
|
Mortgage-Backed Securities
|
|
|
-
|
|
|
1,430
|
|
|
-
|
|
|
1,430
|
|
Equity Securities
|
|
|
-
|
|
|
8,547
|
|
|
-
|
|
|
8,547
|
Assets Measured at Fair Value on a Non-Recurring Basis
Certain assets are measured at fair value on a
non-recurring basis (i.e., the assets are not measured at fair value on an
ongoing basis but are subject to fair value adjustments in certain
circumstances). An example would be assets exhibiting evidence of impairment.
The following is a description of valuation methodologies used for assets
measured on a non-recurring basis.
Impaired Loans. Impairment for collateral dependent loans is
measured using the fair value of the collateral less selling costs. The fair
value of collateral is determined by an independent valuation or professional
appraisal in conformance with banking regulations. Collateral values are
estimated using Level 3 inputs due to the volatility in the real estate market,
and the judgment and estimation involved in the real estate appraisal process.
Impaired loans are reviewed and evaluated on at least a quarterly basis for
additional impairment and adjusted accordingly. Valuation techniques are
consistent with those techniques applied in prior periods. Impaired collateral
dependent loans had a carrying value of $6.1 million with a valuation
allowance of $1.1 million at December 31,
2017 and $6.3 million and $0.6 million, respectively, at
December 31, 2016.
Loans Held for Sale. These loans are carried at the lower of cost
or fair value and are adjusted to fair value on a non-recurring basis. Fair
value is based on observable markets rates for comparable loan products, which
is considered a Level 2 fair value measurement.
Other Real Estate Owned. During 2017 and 2016,
certain foreclosed assets, upon initial recognition, were measured and reported
at fair value through a charge-off to the allowance for loan losses based on
the fair value of the foreclosed asset less estimated cost to sell. The fair
value of the foreclosed asset is determined by an independent valuation or
professional appraisal in conformance with banking regulations. On an ongoing
basis, we obtain updated appraisals on foreclosed assets and record valuation
adjustments as necessary. The fair value of foreclosed assets is estimated using
Level 3 inputs due to the judgment and estimation involved in the real estate
valuation process.
Assets and Liabilities
Disclosed at Fair Value
The Company is required to
disclose the estimated fair value of financial instruments, both assets and
liabilities, for which it is practical to estimate fair value and the following
is a description of valuation methodologies used for those assets and
liabilities.
Cash and Short-Term
Investments. The
carrying amount of cash and short-term investments is used to approximate fair
value, given the short time frame to maturity and as such assets do not present
unanticipated credit concerns.
Securities Held to Maturity. Securities held to maturity
are valued in accordance with the methodology previously noted in the caption
“Assets and Liabilities Measured at Fair Value on a Recurring Basis –
Securities Available for Sale”.
Loans. The loan portfolio is segregated into categories and the
fair value of each loan category is calculated using present value techniques
based upon projected cash flows and estimated discount rates that reflect the
credit, interest rate, and liquidity risks inherent in each loan category. The
calculated present values are then reduced by an allocation of the allowance
for loan losses against each respective loan category.
Deposits. The fair value of Noninterest Bearing
Deposits, NOW Accounts, Money Market Accounts and Savings Accounts are the
amounts payable on demand at the reporting date. The fair value of fixed
maturity certificates of deposit is estimated using present value techniques
and rates currently offered for deposits of similar remaining maturities.
Subordinated Notes Payable. The fair value of each note is calculated
using present value techniques, based upon projected cash flows and estimated
discount rates as well as rates being offered for similar obligations.
Short-Term and Long-Term Borrowings. The fair value of each note is calculated
using present value techniques, based upon projected cash flows and estimated
discount rates as well as rates being offered for similar debt.
A summary of estimated fair values
of significant financial instruments at December 31 consisted of the following:
|
|
|
2017
|
|
(Dollars in Thousands)
|
|
Carrying
|
|
Level 1
|
|
Level 2
|
|
Level 3
|
|
|
|
Value
|
|
Inputs
|
|
Inputs
|
|
Inputs
|
|
ASSETS:
|
|
|
|
|
|
|
|
|
|
|
|
|
|
Cash
|
|
$
|
58,419
|
|
$
|
58,419
|
|
$
|
-
|
|
$
|
-
|
|
Short-Term Investments
|
|
|
227,023
|
|
|
227,023
|
|
|
-
|
|
|
-
|
|
Investment Securities, Available for Sale
|
|
|
480,911
|
|
|
235,341
|
|
|
245,570
|
|
|
-
|
|
Investment Securities, Held to Maturity
|
|
|
216,679
|
|
|
97,815
|
|
|
117,192
|
|
|
-
|
|
Loans Held for Sale
|
|
|
4,817
|
|
|
-
|
|
|
4,817
|
|
|
-
|
|
Loans, Net of Allowance for Loan Losses
|
|
|
1,640,185
|
|
|
-
|
|
|
-
|
|
|
1,625,310
|
|
|
|
|
|
|
|
|
|
|
|
|
|
|
|
LIABILITIES:
|
|
|
|
|
|
|
|
|
|
|
|
|
|
Deposits
|
|
$
|
2,469,877
|
|
$
|
-
|
|
$
|
2,382,818
|
|
$
|
-
|
|
Short-Term Borrowings
|
|
|
7,480
|
|
|
-
|
|
|
7,482
|
|
|
-
|
|
Subordinated Notes Payable
|
|
|
52,887
|
|
|
-
|
|
|
41,718
|
|
|
-
|
|
Long-Term Borrowings
|
|
|
13,967
|
|
|
-
|
|
|
14,081
|
|
|
-
|
|
|
|
2016
|
|
(Dollars in Thousands)
|
|
Carrying
|
|
Level 1
|
|
Level 2
|
|
Level 3
|
|
|
|
Value
|
|
Inputs
|
|
Inputs
|
|
Inputs
|
|
ASSETS:
|
|
|
|
|
|
|
|
|
|
|
|
|
|
Cash
|
|
$
|
48,268
|
|
$
|
48,268
|
|
$
|
-
|
|
$
|
-
|
|
Short-Term Investments
|
|
|
247,779
|
|
|
247,779
|
|
|
-
|
|
|
-
|
|
Investment Securities, Available for Sale
|
|
|
522,734
|
|
|
286,278
|
|
|
236,456
|
|
|
-
|
|
Investment Securities, Held to Maturity
|
|
|
177,365
|
|
|
119,157
|
|
|
57,589
|
|
|
-
|
|
Loans Held for Sale
|
|
|
10,886
|
|
|
-
|
|
|
10,886
|
|
|
-
|
|
Loans, Net of Allowance for Loan Losses
|
|
|
1,547,858
|
|
|
-
|
|
|
-
|
|
|
1,543,576
|
|
|
|
|
|
|
|
|
|
|
|
|
|
|
|
LIABILITIES:
|
|
|
|
|
|
|
|
|
|
|
|
|
|
Deposits
|
|
$
|
2,412,286
|
|
$
|
-
|
|
$
|
2,272,572
|
|
$
|
-
|
|
Short-Term Borrowings
|
|
|
12,749
|
|
|
-
|
|
|
12,802
|
|
|
-
|
|
Subordinated Notes Payable
|
|
|
52,887
|
|
|
-
|
|
|
42,024
|
|
|
-
|
|
Long-Term Borrowings
|
|
|
14,881
|
|
|
-
|
|
|
15,122
|
|
|
-
|
All non-financial instruments are excluded from the above
table. The disclosures also do not include
goodwill. Accordingly, the aggregate fair value amounts presented do
not represent the underlying value of the Company.
Note 20
PARENT COMPANY FINANCIAL INFORMATION
The following are condensed statements of
financial condition of the parent company at December 31:
Parent Company Statements of Financial
Condition
|
(Dollars in Thousands, Except Per Share Data)
|
2017
|
|
2016
|
|
ASSETS
|
|
|
|
|
|
|
Cash and Due From Subsidiary Bank
|
$
|
17,515
|
|
$
|
9,618
|
|
Investment in Subsidiary Bank
|
|
327,416
|
|
|
325,337
|
|
Other Assets
|
|
5,112
|
|
|
5,563
|
|
Total Assets
|
$
|
350,043
|
|
$
|
340,518
|
|
|
|
|
|
|
|
|
LIABILITIES
|
|
|
|
|
|
|
Short-Term Borrowings
|
$
|
-
|
|
$
|
3,000
|
|
Long-Term Borrowings
|
|
2,700
|
|
|
-
|
|
Subordinated Notes Payable
|
|
52,887
|
|
|
52,887
|
|
Other Liabilities
|
|
10,246
|
|
|
9,463
|
|
Total Liabilities
|
|
65,833
|
|
|
65,350
|
|
|
|
|
|
|
|
|
SHAREOWNERS’ EQUITY
|
|
|
|
|
|
|
Common Stock, $.01 par value; 90,000,000 shares authorized;
16,988,951 and 16,844,698 shares
issued and outstanding at December 31, 2017 and December
31, 2016, respectively
|
|
170
|
|
|
168
|
|
Additional Paid-In Capital
|
|
36,674
|
|
|
34,188
|
|
Retained Earnings
|
|
279,410
|
|
|
267,037
|
|
Accumulated Other Comprehensive Loss, Net of Tax
|
|
(32,044)
|
|
|
(26,225)
|
|
Total Shareowners’ Equity
|
|
284,210
|
|
|
275,168
|
|
Total Liabilities and Shareowners’ Equity
|
$
|
350,043
|
|
$
|
340,518
|
The operating results of the parent company for the three years
ended December 31 are shown below:
Parent Company Statements of Operations
|
(Dollars in Thousands)
|
|
2017
|
|
2016
|
|
2015
|
|
OPERATING INCOME
|
|
|
|
|
|
|
|
|
|
|
Income Received from Subsidiary Bank:
|
|
|
|
|
|
|
|
|
|
|
Overhead Fees
|
|
$
|
4,813
|
|
$
|
4,700
|
|
$
|
4,604
|
|
Dividends
|
|
|
12,000
|
|
|
9,300
|
|
|
9,200
|
|
Other Income
|
|
|
124
|
|
|
2,675
|
|
|
424
|
|
Total Operating Income
|
|
|
16,937
|
|
|
16,675
|
|
|
14,228
|
|
|
|
|
|
|
|
|
|
|
|
|
OPERATING EXPENSE
|
|
|
|
|
|
|
|
|
|
|
Salaries and Associate Benefits
|
|
|
4,384
|
|
|
4,247
|
|
|
3,395
|
|
Interest on Subordinated Notes Payable
|
|
|
1,761
|
|
|
1,527
|
|
|
1,368
|
|
Professional Fees
|
|
|
1,072
|
|
|
1,114
|
|
|
1,078
|
|
Advertising
|
|
|
130
|
|
|
160
|
|
|
105
|
|
Legal Fees
|
|
|
140
|
|
|
167
|
|
|
168
|
|
Other
|
|
|
737
|
|
|
718
|
|
|
699
|
|
Total Operating Expense
|
|
|
8,224
|
|
|
7,933
|
|
|
6,813
|
|
Earnings Before Income Taxes and Equity in Undistributed
|
|
|
|
|
|
|
|
|
|
|
Earnings of Subsidiary Bank
|
|
|
8,713
|
|
|
8,742
|
|
|
7,415
|
|
Income Tax Expense (Benefit)
|
|
|
166
|
|
|
(1,492)
|
|
|
(342)
|
|
Earnings Before Equity in Undistributed Earnings of Subsidiary
Bank
|
|
|
8,547
|
|
|
10,234
|
|
|
7,757
|
|
Equity in Undistributed Earnings of Subsidiary Bank
|
|
|
2,316
|
|
|
1,512
|
|
|
1,359
|
|
Net Income
|
|
$
|
10,863
|
|
$
|
11,746
|
|
$
|
9,116
|
The cash flows for the parent company for the three years ended
December 31 were as follows:
Parent Company Statements of Cash Flows
|
(Dollars in Thousands)
|
|
2017
|
|
2016
|
|
2015
|
|
CASH FLOWS FROM OPERATING ACTIVITIES:
|
|
|
|
|
|
|
|
|
|
|
Net Income
|
|
$
|
10,863
|
|
$
|
11,746
|
|
$
|
9,116
|
|
Adjustments to Reconcile Net Income to Net Cash Provided
By
Operating Activities:
|
|
|
|
|
|
|
|
|
|
|
Equity in Undistributed Earnings of Subsidiary Bank
|
|
|
(2,316)
|
|
|
(1,512)
|
|
|
(1,359)
|
|
Stock Compensation
|
|
|
1,502
|
|
|
1,260
|
|
|
1,109
|
|
Gain on Retirement of Trust Preferred Securities
|
|
|
-
|
|
|
(2,487)
|
|
|
-
|
|
Decrease (Increase) in Other Assets
|
|
|
450
|
|
|
(399)
|
|
|
191
|
|
Increase in Other Liabilities
|
|
|
960
|
|
|
345
|
|
|
444
|
|
Net Cash Provided By Operating Activities
|
|
|
11,459
|
|
|
8,953
|
|
|
9,501
|
|
|
|
|
|
|
|
|
|
|
|
|
CASH FROM FINANCING ACTIVITIES:
|
|
|
|
|
|
|
|
|
|
|
Redemption of Subordinated Notes
|
|
|
-
|
|
|
(7,500)
|
|
|
-
|
|
Proceeds from Short-Term Borrowings
|
|
|
-
|
|
|
3,750
|
|
|
-
|
|
Repayment of Short-Term Borrowings
|
|
|
-
|
|
|
(750)
|
|
|
-
|
|
Repayment of Long-Term Borrowings
|
|
|
(300)
|
|
|
-
|
|
|
-
|
|
Dividends Paid
|
|
|
(4,071)
|
|
|
(2,890)
|
|
|
(2,241)
|
|
Issuance of Common Stock Under Compensation Plans
|
|
|
809
|
|
|
840
|
|
|
507
|
|
Payments to Repurchase Common Stock
|
|
|
-
|
|
|
(6,312)
|
|
|
(5,981)
|
|
Net Cash Used In Financing Activities
|
|
|
(3,562)
|
|
|
(12,862)
|
|
|
(7,715)
|
|
|
|
|
|
|
|
|
|
|
|
|
Net Increase (Decrease) in Cash
|
|
|
7,897
|
|
|
(3,909)
|
|
|
1,786
|
|
Cash at Beginning of Year
|
|
|
9,618
|
|
|
13,527
|
|
|
11,741
|
|
Cash at End of Year
|
|
$
|
17,515
|
|
$
|
9,618
|
|
$
|
13,527
|
Item 9. Changes in and Disagreements with Accountants on
Accounting and Financial Disclosure
None.
Item 9A. Controls
and Procedures
Evaluation of Disclosure Controls and
Procedures. At December
31, 2017, the end of the period covered by this Annual Report on Form 10-K, our
management, including our Chief Executive Officer and Chief Financial Officer,
evaluated the effectiveness of our disclosure controls and procedures (as
defined in Rule 13a-15(e) under the Securities Exchange Act of 1934). Based
upon that evaluation, our Chief Executive Officer and Chief Financial Officer each
concluded that at December 31, 2017, the end of the period covered by this
Annual Report on Form 10-K, we maintained effective disclosure controls and
procedures.
Management’s Report on Internal Control
Over Financial Reporting.
Our management is responsible for establishing and maintaining effective
internal control over financial reporting. Internal control over financial
reporting is a process designed to provide reasonable assurance regarding the
reliability of financial reporting and the preparation of financial statements
for external purposes in accordance with U.S. generally accepted accounting principles.
Under the supervision and with the
participation of management, including the Chief Executive Officer and Chief
Financial Officer, we conducted an evaluation of the effectiveness of internal
control over financial reporting based on the framework in Internal Control—Integrated Framework
issued by the Committee of Sponsoring Organizations of the Treadway Commission
(2013 framework) (the COSO criteria). Based on this evaluation under the framework in Internal Control -
Integrated Framework, our management has concluded we maintained effective
internal control over financial reporting, as such term is defined in
Securities Exchange Act of 1934 Rule 13a-15(f), at December 31, 2017.
Internal control over financial reporting
cannot provide absolute assurance of achieving financial reporting objectives
because of its inherent limitations. Internal control over financial reporting
is a process that involves human diligence and compliance and is subject to
lapses in judgment and breakdowns resulting from human failures. Internal
control over financial reporting can also be circumvented by collusion or improper
management override. Because of such limitations, there is a risk that material
misstatements may not be prevented or detected on a timely basis by internal
control over financial reporting. However, these inherent limitations are known
features of the financial reporting process. Therefore, it is possible to
design into the process safeguards to reduce, though not eliminate, this risk.
Management is also responsible for the
preparation and fair presentation of the consolidated financial statements and
other financial information contained in this report. The accompanying
consolidated financial statements were prepared in conformity with U.S.
generally accepted accounting principles and include, as necessary, best
estimates and judgments by management.
Ernst & Young LLP, an independent
registered certified public accounting firm, has audited our consolidated financial
statements as of and for the year ended December 31, 2017, and opined as to the
effectiveness of internal control over financial reporting at December 31,
2017, as stated in its attestation report, which is included herein on page
110.
Change in Internal Control. Our management, including the Chief
Executive Officer and Chief Financial Officer, has reviewed our internal
control. There have been no changes in our internal control during our most
recently completed fiscal quarter that materially affected, or is likely to
materially affect our internal control over financial reporting.
Item 9B. Other
Information
None.
|
|
Ernst & Young
LLP
One Tampa City
Center
Suite 2400
201 North Franklin
Street
Tampa, Florida 33602
|
Tel: +1 813 225 4800
Fax: +1 813 225 4711
ey.com
|
|

Report of
Independent Registered Certified Public Accounting Firm
To
the Shareowners and Board of Directors of
Capital
City Bank Group, Inc.
Opinion on Internal Control over
Financial Reporting
We have audited Capital City Bank Group,
Inc.’s internal control over financial reporting as of December 31, 2017, based
on criteria established in Internal Control—Integrated Framework issued by the
Committee of Sponsoring Organizations of the Treadway Commission (2013
framework) (the COSO criteria). In our opinion, Capital City Bank Group, Inc.
(the Company) maintained, in all material respects, effective internal control
over financial reporting as of December 31, 2017, based on the COSO criteria.
We also
have audited, in accordance with the standards of the Public Company Accounting
Oversight Board (United States) (PCAOB), the consolidated statements of
financial condition of the Company as of December 31, 2017 and 2016, and the
related consolidated statements of income, comprehensive income, changes in
shareowners’ equity, and cash flows for each of the three years in the period
ended December 31, 2017, and the related notes of the Company and our report
dated March
5, 2018 expressed an unqualified opinion thereon.
Basis for Opinion
The Company’s management is responsible
for maintaining effective internal control over financial reporting and for its
assessment of the effectiveness of internal control over financial reporting
included in the accompanying Management’s Report on Internal Control over
Financial Reporting. Our responsibility is to express an opinion on the
Company’s internal control over financial reporting based on our audit. We are
a public accounting firm registered with the PCAOB and are required to be
independent with respect to the Company in accordance with the U.S. federal
securities laws and the applicable rules and regulations of the Securities and
Exchange Commission and the PCAOB.
We conducted our audit in accordance
with the standards of the PCAOB. Those standards require that we plan and perform
the audit to obtain reasonable assurance about whether effective internal
control over financial reporting was maintained in all material respects.
Our audit included obtaining an
understanding of internal control over financial reporting, assessing the risk
that a material weakness exists, testing and evaluating the design and
operating effectiveness of internal control based on the assessed risk, and
performing such other procedures as we considered necessary in the
circumstances. We believe that our audit provides a reasonable basis for our
opinion.
Definition and Limitations of Internal
Control Over Financial Reporting
A company’s internal control over
financial reporting is a process designed to provide reasonable assurance
regarding the reliability of financial reporting and the preparation of
financial statements for external purposes in accordance with generally
accepted accounting principles. A company’s internal control over financial
reporting includes those policies and procedures that (1) pertain to the
maintenance of records that, in reasonable detail, accurately and fairly
reflect the transactions and dispositions of the assets of the company; (2)
provide reasonable assurance that transactions are recorded as necessary to
permit preparation of financial statements in accordance with generally
accepted accounting principles, and that receipts and expenditures of the
company are being made only in accordance with authorizations of management and
directors of the company; and (3) provide reasonable assurance regarding
prevention or timely detection of unauthorized acquisition, use, or disposition
of the company’s assets that could have a material effect on the financial
statements.
Because
of its inherent limitations, internal control over financial reporting may not
prevent or detect misstatements. Also, projections of any evaluation of
effectiveness to future periods are subject to the risk that controls may
become inadequate because of changes in conditions, or that the degree of
compliance with the policies or procedures may deteriorate.

Tampa, Florida
March 5, 2018
Part III
Item 10. Directors,
Executive Officers, and Corporate Governance
Incorporated herein by reference to
the sections entitled “Proposal No. 1 – Election of Directors”, “Corporate
Governance at Capital City,” “Share Ownership” and “Board Committee Membership”
in the Registrant’s Proxy Statement relating to its Annual Meeting of
Shareowners to be held April 24, 2018.
Item 11. Executive
Compensation
Incorporated herein by reference to the sections entitled
“Compensation Discussion and Analysis,” “Executive Compensation” and “Director
Compensation” in the Registrant’s Proxy Statement relating to its Annual
Meeting of Shareowners to be held April 24, 2018.
Item 12. Security
Ownership of Certain Beneficial Owners and Management and Related Shareowners Matters
The 2011 Associate Incentive Plan, 2011 Associate Stock Purchase
Plan, and 2011 Director Stock Purchase Plan were approved by the Registrant’s
shareowners. The following table provides certain information regarding the
Registrant’s equity compensation plans.
|
|
|
|
|
|
|
Number of securities
remaining
|
|
|
Number of securities to
be
|
Weighted-average
|
available for future
issuance
|
|
|
issued upon exercise of
|
exercise price
|
under equity
compensation
|
|
|
outstanding options,
warrants
|
of outstanding options,
|
plans (excluding
securities
|
|
Plan Category
|
and rights
|
warrants and rights
|
reflected in column (a))
|
|
|
(a)
|
|
|
(b)
|
|
(c)
|
|
Equity Compensation Plans
|
|
|
|
|
|
|
|
Approved by Securities Holders
|
—
|
|
$
|
—
|
|
897,199(1)
|
|
Equity Compensation Plans Not
|
|
|
|
|
|
|
|
Approved by Securities Holders
|
—
|
|
|
—
|
|
—
|
|
Total
|
—
|
|
$
|
—
|
|
897,199
|
|
(1)
|
Consists of 525,243 shares available for issuance under our 2011 Associate
Incentive Plan, 323,576 shares available for issuance under our 2011 Associate
Stock Purchase Plan, and 48,380 shares available for issuance under our 2011 Director
Stock Purchase Plan. Of these plans, the only plan under which options may be
granted in the future is our 2011
Associate Incentive Plan.
|
The other information
required by Item 12 of Form 10-K is incorporated by reference from the
information contained in the section captioned “Share Ownership” in the
Registrant’s Proxy Statement relating to its Annual Meeting of Shareowners to
be held April 24, 2018.
Item 13. Certain Relationships and Related Transactions, and
Director Independence
Incorporated herein by reference to the sections entitled “Transactions
With Related Persons” and “Corporate Governance at Capital City” in the
Registrant’s Proxy Statement relating to its Annual Meeting of Shareowners to
be held April 24, 2018.
Item 14. Principal Accountant Fees and Services
Incorporated herein by reference to the section entitled “Audit Committee
Matters” in the Registrant’s Proxy Statement relating to its Annual Meeting of
Shareowners to be held April 24, 2018.
PART IV
Item 15. Exhibits and Financial Statement Schedules
The following documents are filed as part of this
report
1. Financial
Statements
Report of
Independent Registered Certified Public Accounting Firm
Consolidated
Statements of Financial Condition at the End of Fiscal Years 2017 and 2016
Consolidated Statements of Income for
Fiscal Years 2017, 2016, and 2015
Consolidated Statements of
Comprehensive Income for Fiscal Years 2017, 2016, and 2015
Consolidated
Statements of Changes in Shareowners’ Equity for Fiscal Years 2017, 2016, and 2015
Consolidated Statements of Cash Flows
for Fiscal Years 2017, 2016, and 2015
Notes to Consolidated Financial
Statements
2. Financial
Statement Schedules
Other schedules and exhibits are omitted because the required
information either is not applicable or is shown in the financial statements or
the notes thereto.
3. Exhibits Required to be Filed by Item
601 of Regulation S-K
Reg. S-K
Exhibit
Table
Item
No. Description of
Exhibit
3.1 Amended and Restated Articles of Incorporation - incorporated
herein by reference to Exhibit 3 of the Registrant’s 1996 Proxy Statement
(filed 4/11/96) (No. 0-13358).
3.2 Amended and Restated Bylaws - incorporated herein by reference
to Exhibit 3.2 of the Registrant’s Form 8-K (filed 11/30/07) (No. 0-13358).
4.1 See
Exhibits 3.1 and 3.2 for provisions of Amended and Restated Articles of
Incorporation and Amended and Restated Bylaws, which define the rights of the
Registrant’s shareowners.
4.2 Capital City Bank Group, Inc. 2011 Director Stock Purchase
Plan - incorporated herein by reference to Exhibit 10.2 of the Registrant’s
Form 8-K (filed 5/2/11) (No. 0-13358).
4.3 Capital City Bank Group, Inc. 2011 Associate Stock Purchase
Plan - incorporated herein by reference to Exhibit 10.1 of the Registrant’s
Form 8-K (filed 5/2/11) (No. 0-13358).
4.4 Capital City Bank Group, Inc. 2011 Associate Incentive Plan - incorporated herein by reference to Exhibit 10.3 of the Registrant’s Form 8-K (filed 5/2/11) (No. 0-13358).
4.5 In accordance with Regulation S-K, Item
601(b)(4)(iii)(A) certain instruments defining the rights of holders of
long-term debt of Capital City Bank Group, Inc. not exceeding 10% of the total
assets of Capital City Bank Group, Inc. and its consolidated subsidiaries have
been omitted; the Registrant agrees to furnish a copy of any such instruments
to the Commission upon request.
10.1 Capital City Bank Group, Inc. 1996 Dividend Reinvestment and
Optional Stock Purchase Plan - incorporated herein by reference to Exhibit 10
of the Registrant’s Form S-3 (filed 01/30/97) (No. 333-20683).
10.2 Capital City Bank Group, Inc. Supplemental Executive
Retirement Plan - incorporated herein by reference to Exhibit 10(d) of the
Registrant’s Form 10-K (filed 3/27/03) (No. 0-13358).
10.3 Capital City Bank Group, Inc. 401(k) Profit Sharing Plan –
incorporated herein by reference to Exhibit 4.3 of Registrant’s Form S-8 (filed
09/30/97) (No. 333-36693).
10.6 Form of Participant Agreement for Long-Term Incentive Plan. -
incorporated by reference herein to Exhibit 10.6 of the Registrant’s Annual
Report on Form 10-K (filed 3/6/15)(No. 0-13358).
10.7 Participant Agreement, dated February 25, 2015, by and between
Thomas A. Barron and the Registrant – incorporated by reference herein to
Exhibit 10.1 of the Registrant’s Form 8-K (filed 2/25/15)(No. 0-13358).
10.8 Participant Agreement, dated February 21, 2017, by and between
J. Kimbrough Davis and the Registrant – incorporated by reference herein to
Exhibit 10.1 of the Registrant’s Form 8-K (filed 2/27/17)(No. 0-13358).
11 Statement
re Computation of Per Share Earnings.*
14 Capital City Bank Group, Inc. Code of Ethics for the Chief
Financial Officer and Senior Financial Officers - incorporated herein by
reference to Exhibit 14 of the Registrant’s Form 8-K (filed 3/11/05) (No.
0-13358).
21 Capital
City Bank Group, Inc. Subsidiaries, as of December 31, 2017.**
23.1 Consent
of Independent Registered Certified Public Accounting Firm.**
31.1 Certification
of CEO pursuant to Securities and Exchange Act Section 302 of the
Sarbanes-Oxley Act of 2002.**
31.2 Certification
of CFO pursuant to Securities and Exchange Act Section 302 of the
Sarbanes-Oxley Act of 2002.**
32.1 Certification
of CEO pursuant to 18 U.S.C. Section 1350, as adopted pursuant to Section 906
of the Sarbanes-Oxley Act of 2002.**
32.2 Certification
of CFO pursuant to 18 U.S.C. Section 1350, as adopted pursuant to Section 906
of the Sarbanes-Oxley Act of 2002.**
101.INS XBRL
Instance Document**
101.SCH XBRL
Taxonomy Extension Schema Document**
101.CAL XBRL
Taxonomy Extension Calculation Linkbase Document**
101.LAB XBRL
Taxonomy Extension Label Linkbase Document**
101.PRE XBRL
Taxonomy Extension Presentation Linkbase Document**
101.DEF XBRL
Taxonomy Extension Definition Linkbase Document**
|
*
|
Information required to be presented in Exhibit 11 is provided in
Note 13 to the consolidated financial statements under Part II, Item 8 of
this Form 10-K in accordance with the provisions of U.S. generally accepted
accounting principles.
|
|
**
|
Filed electronically herewith.
|
Item 16. Form 10-K Summary
None.
Signatures
Pursuant to the requirements
of Section 13 or 15(d) of the Securities Exchange Act of 1934, the registrant
has duly caused this report to be signed on March 5, 2018, on its behalf by the
undersigned, thereunto duly authorized.
CAPITAL CITY BANK GROUP, INC.
/s/ William G. Smith, Jr.
William G. Smith, Jr.
Chairman, President and Chief Executive Officer
(Principal Executive Officer)
Pursuant to the requirements
of the Securities Exchange Act of 1934, this report has been signed on March 5,
2018 by the following persons in the capacities indicated.
/s/ William G. Smith, Jr.
William G. Smith, Jr.
Chairman, President and Chief Executive Officer
(Principal Executive Officer)
/s/ J. Kimbrough Davis
J. Kimbrough Davis
Executive Vice President and Chief Financial Officer
(Principal Financial and Accounting Officer)
Pursuant to
the requirements of Section 13 or 15(d) of the Securities Exchange Act of 1934,
the registrant has duly caused this report to be signed on March 5, 2018, on
its behalf by the undersigned, thereunto duly authorized.
|
Directors:
|
|
|
|
|
|
|
|
/s/ Thomas A. Barron
|
|
/s/ Eric Grant
|
|
Thomas A. Barron
|
|
Eric Grant
|
|
|
|
|
|
/s/ Allan G. Bense
|
|
/s/ John K. Humphress
|
|
Allan G. Bense
|
|
John K. Humphress
|
|
|
|
|
|
/s/ Frederick Carroll, III
|
|
/s/ Laura Johnson
|
|
Frederick Carroll, III
|
|
Laura Johnson
|
|
|
|
|
|
/s/ Cader B. Cox, III
|
|
/s/ Henry Lewis III
|
|
Cader B. Cox, III
|
|
Henry Lewis III
|
|
|
|
|
|
/s/ Stanley W. Connally, Jr.
|
|
/s/ John G. Sample, Jr
|
|
Stanley W. Connally, Jr
|
|
John G. Sample, Jr
|
|
|
|
|
|
/s/ J. Everitt Drew
|
|
/s/ William G. Smith, Jr.
|
|
J. Everitt Drew
|
|
William G. Smith, Jr.
|
|
|
|
|
|
|
|
|
|
|
|
|
|
|
|
|
|
|
|
|
|
|
|
|