UNITED STATES
SECURITIES AND EXCHANGE COMMISSION
WASHINGTON, DC 20549
___________________________________
FORM
ANNUAL REPORT PURSUANT TO SECTION 13 OR 15(d) OF THE
SECURITIES EXCHANGE ACT OF 1934
For the
fiscal year
December 31
, 2025OR
TRANSITION REPORT PURSUANT TO SECTION 13 OR 15(d) OF THE
SECURITIES EXCHANGE ACT OF 1934
For the transition period from ____________ to ____________
(Exact name of Registrant as specified in its charter)
(State of Incorporation)
(Commission File Number)
(IRS Employer Identification No.)
,
,
(Address of principal executive offices)
(Zip Code)
(
)
(Registrant’s telephone number, including area code)
Securities registered pursuant to Section 12(b) of the Act:
Title of Each Class Trading Symbol(s) Name of Each Exchange on Which Registered
Securities registered pursuant to Section 12(g) of the Act:
None
Indicate by check mark if the registrant is a well-known seasoned issuer, as defined in Rule 405 of the Securities Act. Yes
☐
☒
Indicate by check mark if the registrant is not required to file reports pursuant to Section 13 or Section 15(d) of the Exchange Act. Yes
☐
☒
Indicate by check mark whether the registrant (1) has filed all reports required to be filed by Section 13 or 15(d) of the Securities Exchange Act of 1934 during the
preceding 12 months (or for such shorter period that the registrant was required to file such reports), and (2) has been subject to such filing requirements for the past
90 days. Yes
☒
☐
Indicate by check mark whether the registrant has submitted electronically every Interactive Data File required to be submitted pursuant to Rule 405 of Regulation S-
T (§232.405 of this chapter) during the preceding 12 months (or for such shorter period that the registrant was required to submit such files). Yes
☒
☐
Indicate by check mark whether the registrant is a large accelerated filer, an accelerated filer, a non-accelerated filer, a smaller reporting company, or an emerging
growth company. See definition of “large accelerated filer,” “accelerated filer,” “smaller reporting company,” and “emerging growth company” in Rule 12b-2 of the
Exchange Act
Large accelerated filer
☐
☒
Non-accelerated filer
☐
Smaller reporting company
If an emerging growth company, indicate by check mark if the registrant has elected not to use the extended transition period for complying with any new or revised
financial accounting standards provided pursuant to Section 13(a) of the Exchange Act.
☐
Indicate by check mark whether the registrant has filed a report on and attestation to its management’s assessment of the effectiveness of its internal control over
financial reporting under Section 404(b) of the Sarbanes-Oxley Act (15 U.S.C. 7262(b)) by the registered public accounting firm that prepared or issued its audit
report.
If securities are registered pursuant to Section 12(b) of the Act, indicate by check mark whether the financial statements of the registrant included in the filing reflect
the correction of an error to previously issued financial statements
.
Indicate by check mark whether any of those error corrections are restatements that required a recovery analysis of incentive-based compensation received by any of
the registrant’s executive officers during the relevant recovery period pursuant to §240.10D-1(b).
☐
Indicate by check mark whether the registrant is a shell company (as defined in Rule 12b-2 of the Exchange Act). Yes
☐
☒
The aggregate market value of the registrant’s common stock, $0.01 par value per share, held by non-affiliates of the registrant on June 30, 2025, the last business day
of the registrant’s most recently completed second fiscal quarter, was approximately $
on that date). Shares of the registrant’s common stock held by each officer and director and each person known to the registrant to own 10% or more of the
outstanding voting power of the registrant have been excluded in that such persons may be deemed to be affiliates. This determination of affiliate status is not a
determination for other purposes.
Indicate the number of shares outstanding of each of the issuer’s classes of common stock, as of the latest practicable date.
Class
Outstanding at February 24, 2026
Common Stock, $0.01 par value per share
DOCUMENTS INCORPORATED BY REFERENCE
Portions of our Proxy Statement for the Annual Meeting of Shareowners held on April 21, 2026, are incorporated by reference in Part III.
2
CAPITAL CITY BANK GROUP, INC.
ANNUAL REPORT FOR 2025 ON FORM 10-K
TABLE OF CONTENTS
PART I
PAGE
Item 1.
5
Item 1A.
23
Item 1B.
39
Item 1C.
39
Item 2.
40
Item 3.
40
Item 4.
40
PART II
Item 5.
41
Item 6.
43
Item 7.
45
Item 7A.
69
Item 8.
70
Item 9.
130
Item 9A.
130
Item 9B.
132
PART III
Item 10.
133
Item 11.
133
Item 12.
133
Item 13.
133
Item 14.
133
PART IV
Item 15.
134
Item 16.
135
136
3
INTRODUCTORY NOTE
This Annual Report on Form 10-K contains “forward-looking statements” within the meaning of the Private Securities Litigation
Reform Act of 1995. These forward-looking statements include, among others, statements about our beliefs, plans, objectives,
goals, expectations, estimates and intentions that are subject to significant risks and uncertainties and are subject to change based
on various factors, many of which are beyond our control. The words “may,” “could,” “should,” “would,” “believe,”
“anticipate,” “estimate,” “expect,” “intend,” “plan,” “target,” “vision,” “goal,” and similar expressions are intended to identify
forward-looking statements.
All forward-looking statements, by their nature, are subject to risks and uncertainties. Forward-looking statements are based on
current assumptions and expectations that are subject to change and may prove to be inaccurate. Our actual future results may
differ materially from those set forth in our forward-looking statements.
In addition to those risks discussed in this Annual Report under Item 1A Risk Factors, factors that could cause our actual results
to differ materially from those in the forward-looking statements, include, without limitation:
●
Changes in trade, monetary, and fiscal policies and laws, including actual changes in interest rates and the Fed Funds
rate and changes in international trade policies, tariffs and treaties affecting imports and exports, and their related
impacts on macroeconomic conditions, customer behavior, funding costs and loan and securities portfolios;
●
Inflation, interest rate, market and monetary fluctuations;
●
Local, regional, national, and international economic conditions (including the value of the U.S. Dollar in relation to
the currencies of other advanced and emerging market countries and the performance of both domestic and
international equity and debt markets and valuation of securities traded on recognized domestic and international
exchanges), and the impact they may have on us and our clients and our assessment of that impact;
●
The costs and effects of legal and regulatory developments, the outcomes of legal proceedings or regulatory or other
governmental inquiries, the results of regulatory examinations or reviews and the ability to obtain required regulatory
approvals;
●
The effect of changes in laws and regulations (including laws and regulations concerning taxes, banking, securities,
and insurance) and their application with which we and our subsidiaries must comply;
●
The effect of changes in accounting policies and practices, as may be adopted by the regulatory agencies, as well as
other accounting standard setters;
●
The accuracy of our financial statement estimates and assumptions;
●
Changes in the creditworthiness, financial performance and/or condition of our borrowers;
●
Changes in the mix of loan geographies, sectors and types or the level of non-performing assets and charge-offs;
●
Changes in estimates of future credit loss reserve requirements based upon the periodic review thereof under relevant
regulatory and accounting requirements;
●
Changes in our liquidity position;
●
Changes in our capital levels, capital requirements or our ability to maintain adequate regulatory capital ratios;
●
The timely development and acceptance of new products and services as well as risks (including reputational and
litigation) attendant thereto, and perceived overall value of these products and services by users;
●
Changes in consumer spending, borrowing, and saving habits;
●
Changes in deposit levels, deposit mix, pricing, or the availability and cost of other funding sources;
●
Greater than expected costs or difficulties related to the integration of new products and lines of business;
●
Technological changes;
●
Risks associated with the development and use of artificial intelligence;
●
The cost and effects of cyber incidents or other failures, interruptions, or security breaches of our systems or those of
our customers or third-party providers;
●
Fraud or misconduct by internal or external parties which we may not be able to prevent, detect or mitigate;
●
Dispositions, acquisitions and integration of acquired businesses;
●
Impairment of our goodwill or other intangible assets;
●
Changes in the reliability of our vendors, internal control systems, or information systems;
●
Our ability to increase market share and control expenses;
●
Our ability to attract and retain qualified employees;
●
Changes in our organization, compensation, and benefit plans;
●
The soundness of other financial institutions;
●
Volatility and disruption in national and international financial and commodity markets;
●
Changes in the competitive environment in our markets and among banking organizations and other financial service
providers;
●
Action or inaction by the federal government, including as a result of any prolonged government shutdown or
government intervention in the U.S. financial system;
4
●
A deterioration of the credit rating for U.S. long-term sovereign debt, actions that the U.S. government may take to
avoid exceeding the debt ceiling, and uncertainties surrounding the federal budget and economic policy;
●
The effects of natural disasters (including hurricanes), widespread health emergencies (including pandemics), military
conflict, terrorism, civil unrest, climate change or other geopolitical events;
●
Our ability to declare and pay dividends;
●
Structural changes in the markets for origination, sale and servicing of residential mortgages;
●
Any inability to implement and maintain effective internal control over financial reporting and/or disclosure control;
●
Potential claims, damages, penalties, fines, costs and reputational damage resulting from pending or future litigation,
regulatory proceedings and enforcement actions;
●
Negative publicity and the impact on our reputation; including the speed and scale at which information can spread
through social media or digital channels, which could amplify adverse market or customer reactions; and
●
The limited trading activity and concentration of ownership of our common stock.
However, other factors besides those listed in Item 1A Risk Factors or discussed in this Annual Report and our other filings with
the Securities and Exchange Commission (the “SEC”) also could adversely affect our results, and you should not consider any
such list of factors to be a complete set of all potential risks or uncertainties. Any forward-looking statements made by us or on
our behalf speak only as of the date they are made. We do not undertake to update or revise any forward-looking statement,
except as required by applicable law.
5
PART I
Item 1. Business
About Us
General
Capital City Bank Group, Inc. (“CCBG”) is a financial holding company headquartered in Tallahassee, Florida. CCBG was
incorporated under Florida law on December 13, 1982, to acquire five national banks and one state bank that all subsequently
became part of CCBG’s bank subsidiary, Capital City Bank (“CCB” or the “Bank”). The Bank commenced operations in 1895. In
this report, the terms “Company,” “we,” “us,” or “our” mean CCBG and all subsidiaries included in our consolidated financial
statements.
CCBG is one of the largest publicly traded financial holding companies headquartered in Florida and has approximately $4. 4
billion in assets.
We
provide a full range of banking services, including traditional deposit and credit services, mortgage banking,
asset management, trust, merchant services, bankcards, securities brokerage services and financial advisory services, including the
sale of life insurance, risk management and asset protection services. The Bank has 62 banking offices and 108 ATMs/ITMs in
Florida, Georgia, and Alabama. Through Capital City Home Loans, LLC (“CCHL”), we have 28 additional offices in the
Southeast for our mortgage banking business. The majority of the revenue, approximately 81%, is derived from our Florida
market areas while approximately 17% and 2% of the revenue is derived from our Georgia and other market areas, respectively.
Below is a summary of our financial condition and results of operations for the past three fiscal years, which we believe is a
sufficient period for understanding our general business development. Our financial condition and results of operations are more
fully discussed in our Management’s Discussion and Analysis on page 45 and our consolidated financial statements on page 70.
Dollars in millions
Year Ended
December 31,
Assets
Deposits
Shareowners’
Equity
Revenue
(1)
Net Income
2025
$4,385.8
$3,662.3
$552.9
$286.7
$61.6
2024
$4,324.9
$3,672.0
$495.3
$270.6
$52.9
2023
$4,304.5
$3,701.8
$440.6
$252.7
$52.3
(1)
Revenue represents interest income plus noninterest income
Dividends and management fees received from the Bank are CCBG’s primary source of income. Dividend payments by the Bank
to CCBG depend on the capitalization, earnings and projected growth of the Bank, and are limited by various regulatory
restrictions, including compliance with a minimum Common Equity Tier 1 Capital conservation buffer. See the section entitled
“Regulatory Considerations” in this Item 1 and Note 17 in the Notes to Consolidated Financial Statements for a discussion of the
restrictions.
Item 6 contains other financial and statistical information about us.
Subsidiaries of CCBG
CCBG’s principal asset is the capital stock of CCB, our wholly owned banking subsidiary, which accounted for nearly 100% of
consolidated assets and net income attributable to CCBG at December 31, 2025. CCBG previously maintained an insurance
subsidiary, Capital City Strategic Wealth, LLC, which was sold in August 2025. CCB has three primary subsidiaries, Capital
City Trust Company and Capital City Banc Investments, Inc. (or “Capital City Investments”) which are wholly owned, and
CCHL which became wholly owned effective January 1, 2025.
Operating Segment
We have one reportable segment with two principal services: Banking Services and Wealth Management Services. Banking
Services are operated at CCB, and Wealth Management Services are operated under two divisions (Capital City Trust Company
and Capital City Investments). Revenues from these principal services for the year ended 2025 totaled approximately 92.8% and
7.2% of our total revenue, respectively. In 2024 and 2023, Banking Services (CCB) revenue was approximately 92.6% and
93.5% of our total revenue for each respective year.
6
Capital City Bank
CCB is a Florida-chartered full-service bank engaged in the commercial and retail banking business. Significant services offered
by CCB include:
●
Business Banking
for a wide variety of general business purposes, including financing for commercial business properties, equipment,
inventories and accounts receivable, as well as commercial leasing and letters of credit. We also provide treasury
management services, and, through a marketing alliance with Elavon, Inc., merchant credit card transaction processing
services.
●
Commercial Real Estate Lending
developers and investors, residential builders and developers, and community development. Credit products are available
to purchase land and build structures for business use and for investors who are developing residential or commercial
property.
●
Residential Real Estate Lending
home financing needs of consumers, including conventional permanent and construction-to-permanent (fixed, adjustable,
or variable rate) financing arrangements as well as FHA, VA and USDA rural development loan products. CCHL also
offers both fixed and adjustable-rate residential mortgage (ARM) loans. CCHL offers these products through its network
of locations. We do not offer subprime residential real estate loans
●
Retail Credit
automobile loans, boat/RV loans, home equity loans, and through a marketing alliance with ELAN, we offer credit card
programs.
●
Institutional Banking –
We provide banking services to meet the needs of state and local governments, public schools
and colleges, charities, membership and not-for-profit associations including customized checking and savings accounts,
cash management systems, tax-exempt loans, lines of credit, and term loans.
●
Retail Banking
– We provide a full-range of consumer banking services, including checking accounts, savings programs,
interactive/automated teller machines (ATMs/ITMs), debit/credit cards, night deposit services, safe deposit facilities,
online banking, and mobile banking.
Capital City Home Loans, LLC
Capital City Home Loans, LLC, or CCHL, originates, sells and services residential mortgage loans through its retail origination
channel. CCHL provides an array of the aforementioned loan products to meet the needs of our consumers within the areas that
we operate. CCHL is an approved Title II, non -supervised direct endorsement mortgagee with the United States Department of
Housing and Urban Development (HUD). In addition, CCHL is an approved issuer with the Government Federal National
Mortgage Association (GNMA), as well as an approved seller and servicer with the Federal National Mortgage Association
(FNMA) and Federal Home Loan Mortgage Corporation (FHLMC).
Capital City Trust Company
Capital City Trust Company, or the Trust Company, provides asset management for individuals through agency, personal trust,
IRA, and personal investment management accounts. Associations, endowments, and other nonprofit entities hire the Trust
Company to manage their investment portfolios. Additionally, a staff of well-trained professionals serves individuals requiring the
services of a trustee, personal representative, or a guardian. The market value of trust assets under discretionary management
exceeded $1.326 billion at December 31, 2025, with total assets under administration exceeding $1.375 billion.
Capital City Investments
We offer our customers retail investment products through LPL Financial. LPL offers a full line of retail securities products,
including U.S. Government bonds, tax-free municipal bonds, stocks, mutual funds, unit investment trusts, annuities, life
insurance and long-term health care. Non-deposit investment and insurance products are: (i) not FDIC insured; (ii) not deposits,
obligations, or guarantees by any bank; and (iii) subject to investment risk, including the possible loss of principal amount
invested. The market value of total asset under administration exceeded $1.541 billion at December 31, 2025.
7
Capital City Strategic Wealth, LLC.
Capital City Strategic Wealth, LLC provides a multi-disciplinary strategic planning approach that requires examining all facets of
our clients’ financial lives through our business, estate, financial, insurance and business planning, tax planning, and asset
protection advisory services. Insurance sales within this division include life, health, disability, long-term care, and annuity
solutions. This subsidiary was sold in August 2025. Revenues were not material to the Company’s ongoing operations or future
financial results.
Lending Activities
One of our core goals is to support the communities in which we operate.
We
seek loans from within our primary market area,
which is defined as the counties in which our banking offices are located.
We
will also originate loans within our secondary
market area, defined as counties adjacent to those in which we have banking offices. There may also be occasions when we will
have opportunities to make loans that are out of both the primary and secondary market areas, including participation loans.
These loans are only approved if the underwriting is consistent with our criteria and generally the project or applicant’s primary
business is in or near our primary or secondary market areas. Approval of all loans is subject to our policies and standards
described in more detail below.
We
have adopted comprehensive lending policies, underwriting standards and loan review procedures. Management and our
Board of Directors reviews and approves these policies and procedures on a regular basis (at least annually).
Management has also implemented reporting systems designed to monitor loan originations, loan quality, concentrations of
credit, loan delinquencies, nonperforming loans, and potential problem loans. Our management and the Credit Risk Oversight
Committee periodically review our lines of business to monitor asset quality trends and the appropriateness of credit policies. In
addition, we establish total borrower exposure limits and monitor concentration risk. As part of this process, the overall
composition of the portfolio is reviewed to gauge diversification of risk, client concentrations, industry group, loan type,
geographic area, or other relevant classifications of loans. Specific segments of the portfolio are monitored and reported to our
Board on a quarterly basis, and we have strategic plans in place to supplement Board approved credit policies governing exposure
limits and underwriting standards.
We
recognize that exceptions to the below-listed policy guidelines may occasionally occur and
have established procedures for approving exceptions to these policy guidelines.
Residential Real Estate Loans
We originate 1-4 family, owner-occupied residential real estate loans for sale in the secondary market. Historically, a vast
majority of residential loan originations are fixed-rate loans which are sold in the secondary market on a non-recourse basis. We
will frequently sell loans and retain the servicing rights. Note 4 – Mortgage Banking Activities in the Notes to Our Consolidated
Financial Statements provides additional information on our servicing portfolio.
We also maintain a portfolio of residential loans held for investment and will periodically originate new 1-4 family secured
adjustable-rate loans for that portfolio. Residential loans held for investment are generally underwritten in accordance with
secondary market guidelines in effect at the time of origination, including loan-to-value, or LTV, and documentation
requirements.
Residential real estate loans also include home equity lines of credit, or HELOCs, and home equity loans. Our home equity
portfolio includes revolving open-ended equity loans with interest-only or minimal monthly principal payments and closed-end
amortizing loans. Open-ended equity loans typically have an interest only 10-year draw period followed by a five-year repayment
period of 0.75% of principal balance monthly and balloon payment at maturity. As of December 31, 2025, approximately 47% of
our residential home equity loan portfolio consisted of first mortgages. Interest rates may be fixed or adjustable. Adjustable-rate
loans are tied to the Prime Rate with a typical margin of 1.0% or more.
Commercial Loans
Our policy sets forth guidelines for debt service coverage ratios, LTV ratios and documentation standards. Commercial loans are
primarily made based on identified cash flows of the borrower with consideration given to underlying collateral and personal or
other guarantees.
We
have established debt service coverage ratio limits that require a borrower’s cash flow to be sufficient to
cover principal and interest payments on all new and existing debt. The majority of our commercial loans are secured by the
assets being financed or other business assets such as accounts receivable or inventory. Many of the loans in the commercial
portfolio have variable interest rates tied to the Prime Rate or U.S. Treasury indices.
8
Commercial Real Estate Loans
We
have adopted guidelines for debt service coverage ratios, LTV ratios and documentation standards for commercial real estate
loans. These loans are primarily made based on identified cash flows of the borrower with consideration given to underlying real
estate collateral and personal guarantees. Our policy establishes a maximum LTV specific to property type and minimum debt
service coverage ratio limits that require a borrower’s cash flow to be sufficient to cover principal and interest payments on all
new and existing debt. Commercial real estate loans may be fixed or variable-rate loans with interest rates tied to the Prime Rate
or U.S. Treasury indices.
We
require appraisals for loans in excess of $500,000 that are secured by real property unless we deem
the real property used as security to be a complex property type, in which case we require appraisals for loans in excess of
$250,000. For loans secured by real property that fall beneath the applicable thresholds above, we will generally use a third-party
evaluation to assess the value of the real property used as security.
Consumer Loans
Our consumer loan portfolio includes personal installment loans, direct and indirect automobile financing, and overdraft lines of
credit. The majority of the consumer loan portfolio consists of indirect and direct automobile loans. The majority of our consumer
loans are short-term and have fixed rates of interest that are priced based on current market interest rates and the financial
strength of the borrower. Our policy establishes maximum debt-to-income ratios, minimum credit scores, and includes guidelines
for verification of applicants’ income and receipt of credit reports.
Expansion of Business
See Item 7. Management’s Discussion and Analysis of Financial Condition and Results of Operations under the section captioned
“Business Overview” for discussion related to the expansion of our Business.
Competition
We face significant competition in our market areas. We compete against a wide range of banking and nonbanking institutions
including banks, savings and loan associations, credit unions, money market funds, mutual fund advisory companies, mortgage
banking companies, investment banking companies, insurance agencies and companies, securities firms, brokerage firms,
financial technology firms, personal and commercial finance companies , peer-to-peer lending businesses and other types of
financial institutions. In addition to traditional competitors, we also face increasing competition from a rapidly expanding group
of nontraditional financial service providers. These include established and emerging wealth technology companies
(“wealthtechs”), financial technology companies (“fintechs”), technology -enabled lenders, digital-only banks, crowdfunding
platforms, and mobile-based payment applications. These firms often leverage advanced technologies, agile product development
cycles, and streamlined digital interfaces that allow them to deliver certain financial products and services—such as unsecured
consumer loans, small business working-capital loans, digital wallets, and peer-to-peer payments—more quickly or conveniently
than traditional banking institutions. Some fintech competitors operate with lower overhead and, in some cases, are subject to
fewer regulatory requirements than banks and bank holding companies. This can allow them to offer competitive pricing, faster
decision making or funding, and simplified user experiences. Some of our competitors are larger financial institutions with greater
resources and, as such, may have higher lending limits and may offer other services that are not provided by us. Industry
consolidation also intensifies competition in our markets. Mergers among financial institutions have created larger,
better-capitalized, and more geographically diverse competitors with expanded digital capabilities and broader product sets. These
institutions may be better positioned to make significant investments in technology, marketing, and infrastructure, which can
enhance their ability to compete for both clients and talent. However, we believe that the larger financial institutions are less
familiar with the markets in which we operate and typically target a different client base. We also believe clients who bank at
community banks tend to prefer the relationship style service of community banks compared to larger banks and financial
services companies.
As a result, we expect to be able to effectively compete in our markets with larger financial institutions through providing
superior client service and leveraging our knowledge and experience in providing banking products and services in our market
areas. See Item 1A. Risk Factors under the section captioned “Our future success is dependent on our ability to compete
effectively in the highly competitive banking and financial services industry” for further discussion related to the competitive
environment in which we operate.
Our primary market area consists of 21 counties in Florida, six counties in Georgia, and one county in Alabama. Most of Florida’s
major banking concerns have a presence in Leon County, where our main office is located. Our Leon County deposits totaled
$1.195 billion, or 32.6% of our consolidated deposits at December 31, 2025.
9
The table below depicts our market share percentage within each county, based on commercial bank deposits within the county.
Market Share as of June 30,
(1)
County
2025
2024
2023
Florida
4.8%
4.9%
5.1%
0.4%
0.2%
0.3%
37.0%
34.3%
37.1%
3.7%
4.3%
4.4%
2.8%
2.2%
2.4%
22.6%
21.5%
17.5%
82.3%
81.8%
81.9%
41.1%
41.6%
42.2%
11.2%
11.2%
12.4%
5.2%
5.2%
4.9%
27.2%
24.6%
28.3%
16.8%
15.5%
16.9%
24.3%
26.4%
26.4%
13.3%
13.5%
13.5%
22.7%
28.3%
34.4%
0.7%
0.7%
0.8%
6.0%
6.4%
6.6%
69.4%
73.7%
75.0%
14.7%
8.4%
8.4%
0.7%
0.6%
0.3%
7.0%
7.8%
9.2%
Georgia
3.2%
3.1%
2.9%
0.1%
0.1%
0.1%
(2)
0.1%
0.0%
0.0%
15.0%
14.0%
13.8%
6.3%
6.0%
6.7%
5.2%
5.4%
5.6%
Alabama
8.2%
9.0%
8.6%
(1)
Obtained from the FDIC Summary of Deposits Report for the year indicated.
(2)
Bank office opened in the second quarter of 2023.
Seasonality
We believe our commercial banking operations are not generally seasonal in nature; however, public deposits tend to increase
with tax collections in the fourth and first quarters of each year and decline as a result of governmental spending thereafter.
Human Capital Matters
Our culture distinguishes us from our competitors and is the driving force behind our continued success. Our leadership is
committed to a culture that values people alongside results.
Our brand promise (“More than your bank. Your banker.”) and purpose (“We empower our clients’ financial wellness and help
them build secure futures”), together with our core values statement (“Do the Right Thing, Build Relationships & Loyalty,
Embrace Individuality & Value Others, Promote Career Growth, Be Committed to Community, and Represent the Star (our bank)
Proudly”), are the foundation on which our culture is built.
10
The bank has grown significantly since its beginnings in 1895. Our commitment to fostering a culture that values our associates
across our entire footprint remains unwavering. We have a Chief Culture Officer and a Chief Inclusion Officer who make it a
priority to ensure our culture is maintained and associates exemplify our values. We reinforce these cultural priorities through
ongoing communication, leadership engagement across our markets, and programs designed to strengthen associate connection,
belonging, and service to our clients and communities.
At December 31, 2025, we had approximately 902 full-time associates and approximately 25 part-time associates. At December
31, 2025, approximately 68% of our workforce was female, 32% was male, and approximately 22% was ethnic minorities. None
of our associates are represented by a labor union or covered by a collective bargaining agreement. All of our associates are hired
on the basis of their individual skills, qualifications, merit, and in accordance with applicable law.
Our commitment to people and being an employer with integrity and heart has earned us numerous accolades including: one of
the “Best Companies to Work for in Florida” by Florida Trend for 14 consecutive years, a “Best Bank to Work For” by American
Banker for 13 consecutive years and being named World’s Best Banks, America’s Best Banks (ranked #13) and America’s Best-
in-State Banks (Ranked #5 in Florida and Ranked #4 in Georgia) by Forbes in 2025, a selection made from direct consumer
feedback and online reviews.
The average tenure of our associates is approximately 9.8 years, and the average tenure of our management team is 24.3 years.
Tenure statistics support these accolades and further demonstrate that associates enjoy working for CCBG.
Compensation and Benefits Program
. To attract and retain experienced associates we offer a competitive compensation and
benefits program, foster a culture where everyone feels included and empowered to do to their best work, and give associates the
opportunity to give back to their communities and make a social impact.
Our compensation program is designed to attract and reward talented individuals who possess the skills necessary to support our
business objectives, assist in the achievement of our strategic goals and create long-term value for our shareowners. We provide
our associates with compensation packages that include base salary and annual incentive bonuses, and certain associates can
receive equity awards tied to the Company’s performance.
Experience has taught us that a compensation program with both short- and long-term awards provides fair and competitive
compensation and aligns associate and shareowner interests by incentivizing business and individual performance. This dual
approach also encourages long-term company performance and integrates compensation with our business plans.
In addition to cash and equity compensation, we offer associates benefits including life and health (medical, dental & vision)
insurance, paid time off, an associate stock purchase plan, and a 401(k) plan. Associates hired prior to 2020 are eligible to
participate in a pension plan. We periodically evaluate our benefits and total rewards offerings to ensure they remain competitive
within our industry and responsive to the evolving needs of our workforce.
A core value is providing associates the ability to “grow a career.” To that end, we support and encourage associates to develop a
life-long habit of continuous learning that focuses on personal and professional development through higher education. We offer
an educational Tuition Assistance Plan to help eligible associates continue or begin post-high school education, develop skills,
increase knowledge and aid in career development.
We have invested in tools and capabilities that allow our team members to work remotely as appropriate. These tools also
support flexible work arrangements, increased collaboration, and the ability to maintain continuity while meeting the needs of
associates and clients.
Talent Acquisition, Development, Retention and Culture
. Our culture emphasizes our longstanding dedication to being respectful
to others and having a workforce that is representative of the communities we serve. We believe in attracting, retaining and
promoting quality talent. Our success depends on our ability to attract, retain and develop employees, and our talent acquisition
teams partner with hiring managers in sourcing and presenting a slate of qualified candidates to strengthen our organization.
Professional development is a key priority, which is facilitated through our many corporate development initiatives including
extensive training programs, corporate mentoring, leadership programs, educational reimbursement and professional speaker
series. Our talent acquisition, development and retention focuses on rewarding merit and achievement while nurturing and
progressing skilled talent across various business segments.
Integral to our culture and values is a commitment to an equal-opportunity and inclusive work environment whereby respect,
acceptance and belonging are practiced and experienced by all.
Our associates are our most valuable assets, and our differences make us stronger, produce more creative solutions, offer better
client service and are vital to attracting and retaining talent. The individual perspectives, life experiences, capabilities and talents,
which our associates invest in their work, represent a significant part of our culture, reputation and collective achievements.
11
Health and Safety
. Our business success is fundamentally connected to our associates’ well-being. We make available to our
associates a voluntary wellness program, StarFit, that provides associates with resources and good-health opportunities through
exercise, diet and preventive care. We continue to evaluate and enhance our well-being programs to support physical, emotional,
and financial wellness across our workforce.
In response to emerging workplace practices, we made changes to our flex–work program to assist our associates in maintaining a
work/life balance consistent with their professional and personal goals. We remain committed to providing tools, support and
flexibility that enable associates to perform their roles effectively while managing personal commitments.
Social Matters
Community Involvement.
We aim to give back to the communities where we live and work and believe that this commitment
helps in our efforts to attract and retain associates. Our commitment to help our community starts with our associates. Community
involvement is a hallmark for our organization, and it comes naturally to our associates. We encourage our associates to volunteer
their hours with service organizations and philanthropic groups in the communities we serve.
We recorded 7,914 community service hours in 2025, and 9,542, and 10,526 hours in 202 4 and 2023, respectively. Additionally,
the CCBG Foundation donated approximately $0.3 million in 2025, 2024 and 2023 to various non-profit organizations in the
communities we serve.
Since 2015, we have annually supported the United Way of the Big Bend in analyzing financial information for its annual grant
review process. Many of these grants are provided to low-moderate income communities in the Big Bend area.
Access, affordability, and financial inclusion.
Our community commitment to further financial literacy in the markets we service
remains an ongoing focus. In 2025, the CCBG Foundation made grants totaling $173,000 to Community Reinvestment Act of
1977 (“CRA”) eligible organizations in our market area. We are committed to providing educational outreach regarding home
ownership and financial access for minorities. We are a long-time supporter of Habitat for Humanity, with our associates
providing volunteer hours on home builds. Further, we continue to originate loans under the Habitat for Humanity loan program
and community development loans under various affordable housing, community service, and revitalization projects.
During tax season, we provide locations for community residents to access Volunteer Income Tax Assistance (VITA) services.
VITA is a nationwide IRS program that offers free tax preparation assistance to people who generally make $60,000 or less,
persons with disabilities, the elderly, and limited English-speaking taxpayers who need assistance in preparing their own tax
returns.
Regulatory Considerations
We
must comply with state and federal banking laws and regulations that control virtually all aspects of our operations. These
laws and regulations generally aim to protect our depositors, not necessarily our shareowners or our creditors. Any changes in
applicable laws or regulations may materially affect our business and prospects. Proposed legislative or regulatory changes may
also affect our operations. The following description summarizes some of the laws and regulations to which we are subject.
References to applicable statutes and regulations are brief summaries, do not purport to be complete, and are qualified in their
entirety by reference to such statutes and regulations.
Capital City Bank Group, Inc.
We are extensively regulated under federal and state law. The following is a brief summary that does not purport to be a complete
description of all regulations that affect us or all aspects of those regulations. This discussion is qualified in its entirety by
reference to the particular statutory and regulatory provisions described below and is not intended to be an exhaustive description
of the statutes or regulations applicable to the Company’s and the Bank’s business. In addition, proposals to change the laws and
regulations governing the banking industry are frequently raised at both the state and federal levels. The likelihood and timing of
any changes in these laws and regulations, and the impact such changes may have on us and the Bank, are difficult to predict.
Regulatory agencies may issue enforcement actions, policy statements, interpretive letters, and similar written guidance
applicable to us or to the Bank. Changes in applicable laws, regulations, or regulatory guidance, or their interpretation by
regulatory agencies or courts may have a material adverse effect on our and the Bank’s business, operations, and earnings.
12
We and the Bank must undergo regular examinations by the Board of Governors of the Federal Reserve System (the “Federal
Reserve”), which will examine for adherence to a range of legal and regulatory compliance responsibilities. A bank regulator
conducting an examination has complete access to the books and records of the examined institution. The results of the
examination are confidential. Supervision and regulation of banks, their holding companies, and affiliates is intended primarily
for the protection of depositors and clients, the Deposit Insurance Fund (“DIF”) of the Federal Deposit Insurance Corporation
(“FDIC”), and the U.S. banking and financial system rather than holders of our securities.
We are registered as a bank holding company with the Federal Reserve under the Bank Holding Company Act (“BHC Act”) and
have elected to be treated as a financial holding company. As such, we are subject to comprehensive supervision and regulation
by the Federal Reserve and are subject to its regulatory reporting requirements. Federal law subjects bank holding companies,
such as the Company, to restrictions on the types of activities in which they may engage, and to a range of supervisory
requirements produce more creative solutions, offer better client service and are vital to attracting and retaining talent. In addition,
the Florida Office of Financial Regulation (“Florida OFR”) regulates bank holding companies that own Florida-chartered banks,
such as us, under the bank holding company laws of the State of Florida. Various federal and state bodies regulate and supervise
our non-bank activities including our brokerage, investment advisory, and insurance agency activities. These include, but are not
limited to, the Securities and Exchange Commission (“SEC”), the Financial Industry Regulatory Authority, federal and state
banking regulators, and various state regulators of insurance and brokerage activities.
Violations of laws and regulations, or other unsafe and unsound practices, may result in regulatory agencies imposing fines or
penalties, cease and desist orders, or taking other enforcement actions. Under certain circumstances, these agencies may enforce
these remedies directly against officers, directors, employees, and other parties participating in the affairs of a bank or bank
holding company. Like all bank holding companies, we are regulated extensively under federal and state law. Under federal and
state laws and regulations pertaining to the safety and soundness of insured depository institutions, state banking regulators, the
Federal Reserve, and separately the FDIC as the insurer of bank deposits have the authority to compel or restrict certain actions
on our part if they determine that we have insufficient capital or other resources, or are otherwise operating in a manner that may
be deemed to be inconsistent with safe and sound banking practices. Under this authority, our regulators can require us or our
subsidiaries to enter into informal or formal supervisory agreements, including board resolutions, memoranda of understanding,
written agreements, and consent or cease and desist orders pursuant to which we would be required to take identified corrective
actions to address cited concerns and to refrain from taking certain actions.
If we become subject to and are unable to comply with the terms of any regulatory actions or directives, supervisory agreements
or orders, then we could become subject to additional, heightened supervisory actions and orders, possibly including prompt
corrective action restrictions and/or other regulatory actions, including prohibitions on the payment of dividends on our common
stock and preferred stock. If our regulators were to take such supervisory actions, then we could, among other things, become
subject to significant restrictions on our ability to develop any new business, as well as restrictions on our existing business, and
we could be required to raise additional capital, dispose of certain assets and liabilities within a prescribed period of time, or both.
The terms of any such action could have a material negative effect on our business, reputation, operating flexibility, financial
condition, and the value of our capital stock.
13
Permitted Activities
As a financial holding company, we are permitted to engage directly or indirectly in a broader range of activities than those
permitted for a bank holding company that has not elected to be a financial holding company. Bank holding companies are
generally restricted to engaging in the business of banking, managing, or controlling banks and certain other activities determined
by the Federal Reserve to be closely related to banking. Financial holding companies may also engage in activities that are
considered to be financial in nature, as well as those incidental or, if determined by the Federal Reserve, complementary to
financial activities. If the Bank ceases to be “well capitalized” or “well managed” under applicable regulatory standards, or if the
Bank receives a rating of less than satisfactory under the CRA, the Federal Reserve may, among other things, place limitations on
our ability to conduct these broader financial activities or, if the deficiencies persist, require us to divest the banking subsidiary or
the businesses engaged in activities permissible only for financial holding companies.
In addition, the Federal Reserve has the power to order a bank holding company or its subsidiaries to terminate any nonbanking
activity or terminate its ownership or control of any nonbank subsidiary when it has reasonable cause to believe that continuation
of such activity or such ownership or control constitutes a serious risk to the financial safety, soundness, or stability of any bank
subsidiary of that bank holding company. As further described below, each of the Company and the Bank is well-capitalized
under applicable regulatory standards as of December 31, 2025, and the Bank has an overall rating of “Satisfactory” in its most
recent CRA evaluation.
Source of Strength Obligations
A bank holding company, such as us, is required to act as a source of financial and managerial strength to its subsidiary bank. The
term “source of financial strength” means the ability of a company, such as us, that directly or indirectly owns or controls an
insured depository institution, such as the Bank, to provide financial assistance to such insured depository institution in the event
of financial distress. The appropriate federal banking agency for the depository institution (in the case of the Bank, this agency is
the Federal Reserve) may require reports from us to assess our ability to serve as a source of strength and to enforce compliance
with the source of strength requirements by requiring us to provide financial assistance to the Bank in the event of financial
distress. If we were to enter bankruptcy or become subject to the orderly liquidation process established by the Dodd-Frank Wall
Street Reform and Consumer Protection Act (“Dodd-Frank Act”), any commitment by us to a federal bank regulatory agency to
maintain the capital of the Bank would be assumed by the bankruptcy trustee or the FDIC, as appropriate, and entitled to a
priority of payment. In addition, the FDIC provides that any insured depository institution generally will be liable for any loss
incurred by the FDIC in connection with the default of, or any assistance provided by the FDIC to, a commonly controlled insured
depository institution. The Bank is an FDIC-insured depository institution and thus subject to these requirements.
Acquisitions
The BHC Act permits acquisitions of banks by bank holding companies, such that we and any other bank holding company,
whether located in Florida or elsewhere, may acquire a bank located in any other state, subject to certain deposit-percentage, age
of bank charter requirements, and other restrictions. The BHC Act requires that a bank holding company obtain the prior approval
of the Federal Reserve before (i) acquiring direct or indirect ownership or control of more than 5% of the voting shares of any
additional bank or bank holding company, (ii) taking any action that causes an additional bank or bank holding company to
become a subsidiary of the bank holding company, or (iii) merging or consolidating with any other bank holding company. The
Federal Reserve may not approve any such transaction that would result in a monopoly or would be in furtherance of any
combination or conspiracy to monopolize or attempt to monopolize the business of banking in any section of the United States, or
the effect of which may be substantially to lessen competition or to tend to create a monopoly in any section of the country, or
that in any other manner would be in restraint of trade unless the anticompetitive effects of the proposed transaction are clearly
outweighed in the public interest by the probable effect of the transaction in meeting the convenience and needs of the community
to be served. The Federal Reserve is also required to consider: (i) the financial and managerial resources of the companies
involved, including pro forma capital ratios; (ii) the risk to the stability of the United States banking or financial system; (iii) the
convenience and needs of the communities to be served, including performance under the CRA; and (iv) the effectiveness of the
company in combatting money laundering.
Change in Control
Federal law restricts the amount of voting stock of a bank holding company or a bank that a person may acquire without the prior
approval of banking regulators. Under the Change in Bank Control Act and the regulations thereunder, a person or group must
give advance notice to the Federal Reserve before acquiring control of any bank holding company, such as the Company, or
before acquiring control of any FDIC-insured bank, such as the Bank. Upon receipt of such notice, the Federal Reserve may
approve or disapprove the acquisition. The Change in Bank Control Act creates a rebuttable presumption of control if a person or
group acquires the power to vote 10% or more of our outstanding common stock.
14
Under Florida law, a person or entity proposing to directly or indirectly acquire control of a Florida chartered bank must also
obtain permission from the Florida Office of Financial Regulation (the “Florida OFR”). The Florida Statutes define “control” as
either (i) indirectly or directly owning, controlling or having power to vote 25% or more of the voting securities of a bank; (ii)
controlling the election of a majority of directors of a bank; (iii) owning, controlling, or having power to vote 10% or more of the
voting securities as well as directly or indirectly exercising a controlling influence over management or policies of a bank; or (iv)
as determined by the Florida OFR. These requirements will affect us because the Bank is chartered under Florida law and
changes in control of the Company are indirect changes in control of the Bank.
The overall effect of such laws is to make it more difficult to acquire a bank holding company and a bank by tender offer or
similar means than it might be to acquire control of another type of corporation. Consequently, shareholders of the Company may
be less likely to benefit from the rapid increases in stock prices that may result from tender offers or similar efforts to acquire
control of other companies. Investors should be aware of these requirements when acquiring shares of our stock.
Incentive Compensation
The Dodd-Frank Act required the federal banking agencies and the SEC to establish joint rules or guidelines for financial
institutions with more than $1 billion in assets, such as us and the Bank, which prohibit incentive compensation arrangements that
the agencies determine to encourage inappropriate risks by the institution. The federal banking agencies issued proposed rules in
2011 and previously issued guidance on sound incentive compensation policies. In 2016, the federal banking agencies and the
SEC proposed rules that would, depending upon the assets of the institution, directly regulate incentive compensation
arrangements and would require enhanced oversight and recordkeeping. As of December 31, 2025, these rules have not been
implemented, although the SEC did adopt final rules implementing the clawback provisions of the Dodd-Frank Act in 2022.
We
and the Bank have undertaken efforts to ensure that our incentive compensation plans do not encourage inappropriate risks,
consistent with three key principles - that incentive compensation arrangements should appropriately balance risk and financial
rewards, be compatible with effective controls and risk management, and be supported by strong corporate governance.
Source of Strength Obligations
A bank holding company, such as us, is required to act as a source of financial and managerial strength to its subsidiary bank. The
term “source of financial strength” means the ability of a company, such as us, that directly or indirectly owns or controls an
insured depository institution, such as the Bank, to provide financial assistance to such insured depository institution in the event
of financial distress. The appropriate federal banking agency for the depository institution (in the case of the Bank, this agency is
the Federal Reserve) may require reports from us to assess our ability to serve as a source of strength and to enforce compliance
with the source of strength requirements by requiring us to provide financial assistance to the Bank in the event of financial
distress. If we were to enter bankruptcy or become subject to the orderly liquidation process established by the Dodd-Frank Act,
any commitment by us to a federal bank regulatory agency to maintain the capital of the Bank would be assumed by the
bankruptcy trustee or the FDIC, as appropriate, and entitled to a priority of payment. In addition, the FDIC provides that any
insured depository institution generally will be liable for any loss incurred by the FDIC in connection with the default of, or any
assistance provided by the FDIC to, a commonly controlled insured depository institution. The Bank is an FDIC-insured
depository institution and thus subject to these requirements.
Capital Requirements
We
and the Bank are required under federal law to maintain certain minimum capital levels based on ratios of capital to total
assets and capital to risk-weighted assets. The required capital ratios are minimums, and the Federal Reserve may determine that a
banking organization based on its size, complexity, or risk profile must maintain a higher level of capital in order to operate in a
safe and sound manner. Risks such as concentration of credit risks and the risk arising from nontraditional activities, as well as the
institution’s exposure to a decline in the economic value of its capital due to changes in interest rates, and an institution’s ability
to manage those risks, are important factors that are to be taken into account in assessing an institution’s overall capital adequacy.
The following is a brief description of the relevant provisions of these capital rules and their potential impact on our capital levels.
We
and the Bank are subject to the following risk-based capital ratios: a CET1 risk-based capital ratio, a Tier 1 risk-based capital
ratio, which includes CET1 and additional Tier 1 capital, and a total risk-based capital ratio, which includes Tier 1 and Tier 2
capital. CET1 is primarily comprised of the sum of common stock instruments and related surplus net of treasury stock plus
retained earnings less certain adjustments and deductions, including with respect to goodwill, intangible assets, mortgage
servicing assets, and deferred tax assets subject to temporary timing differences. Additional Tier 1 capital is primarily comprised
of noncumulative perpetual preferred stock. Tier 2 capital consists of instruments disqualified from Tier 1 capital, including
qualifying subordinated debt and a limited amount of loan loss reserves up to a maximum of 1.25% of risk-weighted assets,
subject to certain eligibility criteria. The capital rules also define the risk-weights assigned to assets and off-balance sheet items to
determine the risk-weighted asset components of the risk-based capital rules, including, for example, certain “high volatility”
commercial real estate, past due assets, structured securities, and equity holdings.
15
The leverage capital ratio, which serves as a minimum capital standard, is the ratio of Tier 1 capital to quarterly average total
consolidated assets net of goodwill, certain other intangible assets, and certain required deduction items. The required minimum
leverage ratio for all banks and bank holding companies is 4%.
In addition, effective January 1, 2019, the capital rules required a capital conservation buffer of 2.5% above each of the minimum
risk-based capital ratio requirements (CET1, Tier 1, and total capital), which is designed to absorb losses during periods of
economic stress. These buffer requirements must be met for a bank or bank holding company to be able to pay dividends, engage
in share buybacks, or make discretionary bonus payments to executive management without restriction.
The Federal Deposit Insurance Corporation Improvement Act (“FDICIA”), among other things, requires the federal bank
regulatory agencies to take “prompt corrective action” regarding depository institutions that do not meet minimum capital
requirements. FDICIA establishes five regulatory capital tiers: “well capitalized,” “adequately capitalized,” “undercapitalized,”
“significantly undercapitalized,” and “critically undercapitalized.” A depository institution’s capital tier will depend upon how its
capital levels compare to various relevant capital measures and certain other factors, as established by regulation. FDICIA
generally prohibits a depository institution from making any capital distribution (including payment of a dividend) or paying any
management fee to its holding company if the depository institution would thereafter be undercapitalized. The FDICIA imposes
progressively more restrictive restraints on operations, management, and capital distributions depending on the category in which
an institution is classified. Undercapitalized depository institutions are subject to restrictions on borrowing from the Federal
Reserve System. In addition, undercapitalized depository institutions may not accept brokered deposits absent a waiver from the
FDIC, are subject to growth limitations, and are required to submit capital restoration plans for regulatory approval. A depository
institution's holding company must guarantee any required capital restoration plan up to an amount equal to the lesser of 5% of
the depository institution's assets at the time it becomes undercapitalized or the amount of the capital deficiency when the
institution fails to comply with the plan. Federal banking agencies may not accept a capital plan without determining, among
other things, that the plan is based on realistic assumptions and is likely to succeed in restoring the depository institution's capital.
If a depository institution fails to submit an acceptable plan, it is treated as if it is significantly undercapitalized.
To be well-capitalized, the Bank must maintain at least the following capital ratios:
●
6.5% CET1 to risk-weighted assets;
●
8.0% Tier 1 capital to risk-weighted assets;
●
10.0% Total capital to risk-weighted assets; and
●
5.0% leverage ratio.
The Federal Reserve has not yet revised the well-capitalized standard for bank holding companies to reflect the higher capital
requirements imposed under the current capital rules applicable to banks. For purposes of the Federal Reserve’s Regulation
Y,
including determining whether a bank holding company meets the requirements to be a financial holding company, bank holding
companies, such as the Company, must maintain a Tier 1 risk-based capital ratio of 6.0% or greater and a total risk-based capital
ratio of 10.0% or greater to be well-capitalized. Also, the Federal Reserve may require bank holding companies, including the
Company, to maintain capital ratios substantially in excess of mandated minimum levels depending upon general economic
conditions and a bank holding company’s particular condition, risk profile, and growth plans.
Failure to be well-capitalized or to meet minimum capital requirements could result in certain mandatory and possible additional
discretionary actions by regulators that, if undertaken, could have an adverse material effect on our operations or financial
condition. Failure to meet minimum capital requirements could also result in restrictions on the Company’s or the Bank’s ability
to pay dividends or otherwise distribute capital or to receive regulatory approval of applications or other restrictions on its growth.
In 2025, the Company’s and the Bank’s regulatory capital ratios were above the applicable well-capitalized standards and met the
capital conservation buffer. Based on current estimates, we expect the Company and the Bank to exceed all applicable well-
capitalized regulatory capital requirements and the capital conservation buffer in 2026.
Payment of Dividends
We
are a legal entity separate and distinct from the Bank and our other subsidiaries. Under the laws of the State of Florida, we, as
a business corporation, may declare and pay dividends in cash or property unless the payment or declaration would be contrary to
restrictions contained in our Articles of Incorporation, or unless, after payment of the dividend, we would not be able to pay our
debts when they become due in the usual course of our business or our total assets would be less than the sum of our total
liabilities. In addition, we are also subject to federal regulatory capital requirements that effectively limit the amount of cash
dividends that we may pay.
16
Under a Federal Reserve policy adopted in 2009, the board of directors of a bank holding company must consider different factors
to ensure that its dividend level is prudent relative to maintaining a strong financial position and is not based on overly optimistic
earnings scenarios, such as potential events that could affect its ability to pay, while still maintaining a strong financial position.
As a general matter, the Federal Reserve has indicated that the board of directors of a bank holding company should consult with
the Federal Reserve and eliminate, defer, or significantly reduce the bank holding company’s dividends if:
●
its net income available to shareholders for the past four quarters, net of dividends previously paid during that period, is
not sufficient to fully fund the dividends;
●
its prospective rate of earnings retention is not consistent with its capital needs and overall current and prospective
financial condition; or
●
it will not meet, or is in danger of not meeting, its minimum regulatory capital adequacy ratios.
The primary sources of funds for our payment of dividends to our shareholders are cash on hand and dividends from the Bank and
our non-bank subsidiaries. The Bank is subject to legal limitations on the frequency and amount of dividends that can be paid to
the Company. The Federal Reserve may restrict the ability of the Bank to pay dividends if such payments would constitute an
unsafe or unsound banking practice.
In addition, Florida law and Federal regulation place restrictions on the declaration of dividends from state-chartered banks to
their holding companies. Under the Florida Financial Institutions Code, the board of directors of a state-chartered bank, after it
charges off bad debts, depreciation and other worthless assets, if any, and makes provisions for reasonably anticipated future
losses on loans and other assets, may quarterly, semi-annually or annually declare a dividend of up to the aggregate net profits of
that period combined with the bank’s retained net profits for the preceding two years. In addition, with the approval of the Florida
OFR and Federal Reserve, the bank’s board of directors may declare a dividend from retained net profits which accrued prior to
the preceding two years. Before declaring such dividends, 20% of the net profits for the preceding period as is covered by the
dividend must be transferred to the surplus fund of the bank until this fund becomes equal to the amount of the bank’s common
stock then issued and outstanding. However, a Florida state-chartered bank may not declare any dividend if (i) its net income
(loss) from the current year combined with the retained net income (loss) for the preceding two years aggregates a loss or (ii) the
payment of such dividend would cause the capital account of the bank to fall below the minimum amount required by law,
regulation, order or any written agreement with the Florida OFR or a federal regulatory agency. Under Federal Reserve
regulations, a state member bank may, without the prior approval of the Federal Reserve, pay a dividend in an amount that, when
taken together with all dividends declared during the calendar year, does not exceed the sum of the bank’s net income during the
current calendar year and the retained net income of the prior two calendar years. The Federal Reserve may approve greater
amounts.
In addition, we and the Bank are subject to various general regulatory policies and requirements relating to the payment of
dividends, including requirements to maintain adequate capital above regulatory minimums. The Federal Reserve has indicated
that paying dividends that deplete a bank’s capital base to an inadequate level would be an unsafe and unsound banking practice.
The Federal Reserve has indicated that depository institutions and their holding companies should generally pay dividends only
out of current operating earnings.
Safe and Sound Banking Practices
Bank holding companies and their nonbanking subsidiaries are prohibited from engaging in activities that represent unsafe and
unsound banking practices or that constitute a violation of law or regulations. Under certain conditions the Federal Reserve may
conclude that some actions of a bank holding company, such as a payment of a cash dividend, would constitute an unsafe and
unsound banking practice. The Federal Reserve also has the authority to regulate the debt of bank holding companies, including
the authority to impose interest rate ceilings and reserve requirements on such debt. The Federal Reserve may also require a bank
holding company to file written notice and obtain its approval prior to purchasing or redeeming its equity securities, unless certain
conditions are met.
Capital City Bank
Capital City Bank is a state-chartered commercial banking institution that is chartered by and headquartered in the State of Florida
and is subject to supervision and regulation by the Florida OFR. The Florida OFR supervises and regulates all areas of our
operations including, without limitation, the making of loans, the issuance of securities, the conduct of our corporate affairs, the
satisfaction of capital adequacy requirements, the payment of dividends, and the establishment or closing of banking centers. We
are also a member bank of the Federal Reserve System, which makes our operations subject to broad federal regulation and
oversight by the Federal Reserve. In addition, our deposit accounts are insured by the FDIC up to the maximum extent permitted
by law, and the FDIC has certain supervisory enforcement powers over us.
17
As a Florida state-chartered bank, we are empowered by statute, subject to the limitations contained in those statutes, to take and
pay interest on savings and time deposits, to accept demand deposits, to make loans on residential and other real estate, to make
consumer and commercial loans, to invest (with certain limitations) in equity securities and in debt obligations of banks and
corporations and to provide various other banking services for the benefit of our clients. Various consumer laws and regulations
also affect our operations, including state usury laws, laws relating to fiduciaries, consumer credit and equal credit opportunity
laws, and fair credit reporting. In addition, FDICIA prohibits insured state-chartered institutions from conducting activities as
principal that are not permitted for national banks. A bank, however, may engage in certain otherwise prohibited activity if it
meets its minimum capital requirements and the FDIC determines that the activity does not present a significant risk to the DIF.
Safety and Soundness Standards / Risk Management
The Federal Deposit Insurance Act requires the federal bank regulatory agencies to prescribe, by regulation or guideline,
operational and managerial standards for all insured depository institutions relating to: (i) internal controls; (ii) information
systems and audit systems; (iii) loan documentation; (iv) credit underwriting; (v) interest rate risk exposure; and (vi) asset quality.
The federal banking agencies have adopted regulations and Interagency Guidelines Establishing Standards for Safety and
Soundness to implement these required standards. These guidelines set forth the safety and soundness standards used to identify
and address problems at insured depository institutions before capital becomes impaired. Under the regulations, if a regulator
determines that a bank fails to meet any standards prescribed by the guidelines, the regulator may require the bank to submit an
acceptable plan to achieve compliance, consistent with deadlines for the submission and review of such safety and soundness
compliance plans.
The bank regulatory agencies have increasingly emphasized the importance of sound risk management processes and strong
internal controls when evaluating the activities of the financial institutions they supervise. Properly managing risks has been
identified as critical to the conduct of safe and sound banking activities and has become even more important as new
technologies, product innovation and the size and speed of financial transactions have changed the nature of banking markets. The
agencies have identified a spectrum of risks facing a banking institution including, but not limited to, credit, market, liquidity,
operational, legal and reputational risk. A particular area of focus for regulators has been operational risk, which arises from the
potential that inadequate information systems, operational problems, breaches in internal controls, fraud or unforeseen
catastrophes will result in unexpected losses. New products and services, third party risk management and cybersecurity are
critical sources of operational risk that financial institutions are expected to address in the current environment. The Bank is
expected to have active board and senior management oversight; adequate policies, procedures and limits; adequate risk
measurement, monitoring and management information systems; and comprehensive internal controls.
Insurance of Accounts and Other Assessments
The Bank’s deposits are insured by the FDIC’s DIF up to the limits under applicable law, which currently are set at $250,000 per
depositor, per insured bank, for each account ownership category. The Bank is subject to FDIC assessments for its deposit
insurance. The FDIC calculates quarterly deposit insurance assessments based on an institution’s average total consolidated assets
less its average tangible equity and applies one of four risk categories determined by reference to its capital levels, supervisory
ratings, and certain other factors. The assessment rate schedule can change from time to time, at the discretion of the FDIC,
subject to certain limits.
As of June 30, 2020, the DIF reserve ratio fell to 1.30%, below the statutory minimum of 1.35%. The FDIC, as required under the
Federal Deposit Insurance Act, established a plan on September 15, 2020 to restore the DIF reserve ratio to meet or exceed the
statutory minimum of 1.35% within eight years. On October 18, 2022, the FDIC adopted an amended restoration plan to increase
the likelihood that the reserve ratio would be restored to at least 1.35% by September 30, 2028. The FDIC's amended restoration
plan increased the initial base deposit insurance assessment rate schedules uniformly by 2 bps, beginning with the first quarterly
assessment period of 2023. The FDIC could further increase the deposit insurance assessments for certain insured depository
institutions, including the Bank, if the DIF reserve ratio is not restored as projected.
In November 2023, the FDIC approved a final rule to implement a special assessment to recover the loss to the DIF associated
with several bank failures that occurred during the first half of 2023. The assessment base for the special assessment is equal to a
bank's uninsured deposits reported as of December 31, 2022, adjusted to exclude the first $5 billion, to be collected at an annual
rate of approximately 13.4 bps for an anticipated total of eight quarterly assessment periods, beginning with the first quarterly
assessment period of 2024. The final rule does not apply to any banking organization with less than $5 billion in total
consolidated assets and therefore the special assessment did not directly impact the Bank.
18
Insurance of deposits may be terminated by the FDIC upon a finding that the institution has engaged in unsafe and unsound
practices, is in an unsafe or unsound condition to continue operations, or has violated any applicable law, regulation, rule, order,
or condition imposed by a bank’s federal regulatory agency. In addition, the Federal Deposit Insurance Act provides that, in the
event of the liquidation or other resolution of an insured depository institution, the claims of depositors of the institution,
including the claims of the FDIC as subrogee of insured depositors, and certain claims for administrative expenses of the FDIC as
a receiver, will have priority over other general unsecured claims against the institution, including those of the parent bank
holding company.
Transactions with Affiliates and Insiders
The Bank is subject to restrictions on extensions of credit and certain other transactions between the Bank and the Company or
any nonbank affiliate. Generally, these covered transactions with either the Company or any affiliate are limited to 10% of the
Bank’s capital and surplus, and all such transactions between the Bank and the Company and all of its nonbank affiliates
combined are limited to 20% of the Bank’s capital and surplus. Loans and other extensions of credit from the Bank to the
Company or any affiliate generally are required to be secured by eligible collateral in specified amounts. In addition, any
transaction between the Bank and the Company or any affiliate are required to be on an arm’s length basis. Federal banking laws
also place similar restrictions on certain extensions of credit by insured banks, such as the Bank, to their directors, executive
officers, and principal shareholders.
Anti-Tying Restrictions
In general, a bank may not extend credit, lease, sell property, or furnish any services or fix or vary the consideration for them on
the condition that (i) the client obtain or provide some additional credit, property, or services from or to the bank or bank holding
company or their subsidiaries or (ii) the client not obtain some other credit, property, or services from a competitor, except to the
extent reasonable conditions are imposed to assure the soundness of the credit extended. A bank may, however, offer combined-
balance products and may otherwise offer more favorable terms if a client obtains two or more traditional bank products. The law
also expressly permits banks to engage in other forms of tying and authorizes the Federal Reserve Board to grant additional
exceptions by regulation or order. Also, certain foreign transactions are exempt from the general rule.
Community Reinvestment Act
The Bank is subject to the provisions of the CRA, which imposes a continuing and affirmative obligation, consistent with safe and
sound operation, to help meet the credit needs of entire communities where the bank accepts deposits, including low- and
moderate-income neighborhoods. The Federal Reserve’s assessment of the Bank’s CRA record is made available to the public.
CRA agreements with private parties must be disclosed and annual CRA reports must be made to the Federal Reserve. A bank
holding company will not be permitted to become or remain a financial holding company and no new activities authorized under
GLB may be commenced by a holding company or by a bank financial subsidiary if any of its bank subsidiaries received less than
a “satisfactory” CRA rating in its latest CRA examination. Federal CRA regulations require, among other things, that evidence of
discrimination against applicants on a prohibited basis and illegal or abusive lending practices be considered in the CRA
evaluation. The Bank has a rating of “Satisfactory” in its most recent CRA evaluation.
In 2023 the Federal Reserve, OCC, and FDIC issued a final rule to modernize their respective CRA regulations. The revised rules
would substantially alter the methodology for assessing compliance with the CRA, with material aspects taking effect January 1,
2026 and revised data reporting requirements taking effect January 1, 2027. The revised CRA regulations have been subject to an
injunction since March 29, 2024. On July 16, 2025, the Federal Reserve, OCC, and FDIC issued a joint proposal to rescind the
2023 modernization rule. The agencies continue to apply the CRA rules as they existed before the 2023 modernization,
considering the injunction and pending finalization of the recission of the modernization rule.
Commercial Real Estate Concentration Guidelines
The federal banking regulators have implemented guidelines to address increased concentrations in commercial real estate loans.
These guidelines describe the criteria regulatory agencies will use as indicators to identify institutions potentially exposed to
commercial real estate concentration risk. An institution that has (i) experienced rapid growth in commercial real estate lending,
(ii) notable exposure to a specific type of commercial real estate, (iii) total reported loans for construction, land development, and
other land representing 100% or more of total risk-based capital, or (iv) total commercial real estate (including construction) loans
representing 300% or more of total risk-based capital and the outstanding balance of the institutions commercial real estate
portfolio has increased by 50% or more in the prior 36 months, may be identified for further supervisory analysis of a potential
concentration risk.
19
At December 31, 2025, CCB’s ratio of construction, land development and other land loans to total tier 1 risk-based capital was
49%, its ratio of commercial real estate loans to total tier 1 risk-based capital was 119% and, therefore, CCB was under the 100%
and 300% thresholds, respectively, set forth in clauses (iii) and (iv) above. As a result, we are not deemed to have a concentration
in commercial real estate lending under applicable regulatory guidelines.
Interstate Banking and Branching
The Dodd-Frank Act relaxed interstate branching restrictions by modifying the federal statute governing de novo interstate
branching by state member banks. Consequently, a state member bank may open its initial branch in a state outside of the bank’s
home state by way of an interstate bank branch, so long as a bank chartered under the laws of that state would be permitted to
open a branch at that location.
Anti-money Laundering
A continued focus of governmental policy relating to financial institutions in recent years has been combating money laundering
and terrorist financing. The USA PATRIOT Act broadened the application of anti-money laundering regulations to apply to
additional types of financial institutions such as broker-dealers, investment advisors, and insurance companies, and strengthened
the ability of the U.S. government to help prevent, detect, and prosecute international money laundering and the financing of
terrorism. The principal provisions of Title III of the USA PATRIOT Act require that regulated financial institutions, including
state member banks: (i) establish an anti-money laundering program that includes training and audit components; (ii) comply with
regulations regarding the verification of the identity of any person seeking to open an account; (iii) take additional required
precautions with non-U.S. owned accounts; and (iv) perform certain verification and certification of money laundering risk for
their foreign correspondent banking relationships. Failure of a financial institution to comply with the USA PATRIOT Act’s
requirements could have serious legal and reputational consequences for the institution. The Bank has augmented its systems and
procedures to meet the requirements of these regulations and will continue to revise and update its policies, procedures, and
controls to reflect changes required by law.
FinCEN has adopted rules that require financial institutions to obtain beneficial ownership information with respect to legal
entities with which such institutions conduct business, subject to certain exclusions and exemptions. Bank regulators are focusing
their examinations on anti-money laundering compliance, and we continue to monitor and augment, where necessary, our anti-
money laundering compliance programs. Banking regulators will consider compliance with the USA PATRIOT Act’s money
laundering provisions in acting upon merger and acquisition proposals. Bank regulators routinely examine institutions for
compliance with these obligations and have been active in imposing cease and desist and other regulatory orders and civil money
penalties against institutions found to be violating these obligations. Sanctions for violations of the USA PATRIOT Act can be
imposed in an amount equal to twice the sum involved in the violating transaction up to $1 million. The Anti-Money Laundering
Act (“AMLA”), which amends the BSA, was enacted in early 2021. The AMLA is intended to be a comprehensive reform and
modernization of U.S. bank secrecy and anti-money laundering laws. In particular, it codifies a risk-based approach to anti-money
laundering compliance for financial institutions, requires the U.S. Department of the Treasury to promulgate priorities for anti-
money laundering and countering the financing of terrorism policy, requires the development of standards for testing technology
and internal processes for BSA compliance, expands enforcement - and investigation-related authority (including increasing
available sanctions for certain BSA violations), and expands BSA whistleblower incentives and protections.
Many AMLA provisions require additional rulemakings, reports, and other measures, and the impact of the AMLA will depend
on, among other things, rulemaking and implementation guidance. In June 2021, the Financial Crimes Enforcement Network, a
bureau of the U.S. Department of the Treasury, issued the priorities for anti-money laundering and countering the financing of
terrorism policy required under the AMLA. The priorities include corruption, cybercrime, terrorist financing, fraud, transnational
crime, drug trafficking, human trafficking and proliferation financing.
Economic Sanctions
OFAC is responsible for helping to ensure that U.S. entities do not engage in transactions with certain prohibited parties, as
defined by various executive orders and acts of Congress. OFAC publishes, and routinely updates, lists of names of persons and
organizations suspected of aiding, harboring, or engaging in terrorist acts, including the Specially Designated Nationals and
Blocked Persons List. If we find a name on any transaction, account, or wire transfer that is on an OFAC list, we must undertake
certain specified activities, which could include blocking or freezing the account or transaction requested, and we must notify the
appropriate authorities.
20
Privacy, Credit Reporting, and Data Security
The Gramm-Leach-Bliley Act (“GLB”) generally prohibits disclosure of non-public consumer information to non-affiliated third
parties unless the consumer has been given the opportunity to object and has not objected to such disclosure. Financial institutions
are further required to disclose their privacy policies to clients annually. Financial institutions, however, will be required to
comply with state law if it is more protective of consumer privacy than the GLB. The GLB also directed federal regulators to
prescribe standards for the security of consumer information. The Bank is subject to such standards, as well as standards for
notifying clients in the event of a security breach. The Bank utilizes credit bureau data in underwriting activities. Use of such data
is regulated under the Fair Credit Reporting Act and Regulation V on a uniform, nationwide basis, including credit reporting,
prescreening, and sharing of information between affiliates and the use of credit data. The Fair and Accurate Credit Transactions
Act, which amended the Fair Credit Reporting Act, permits states to enact identity theft laws that are not inconsistent with the
conduct required by the provisions of that Act. Clients must be notified when unauthorized disclosure involves sensitive client
information that may be misused. On November 18, 2021, the federal banking agencies issued a new rule effective in 2022 that
requires banks to notify their primary federal regulator within 36 hours of a “computer-security incident” that rises to the level of
a “notification incident.” In addition, effective in December 2023, the SEC issued a new rule that generally requires SEC
registrants to disclose on Form 8-K certain information about a material cybersecurity incident within four business days of
determining it is material, with periodic updates as to the status of the incident in subsequent filings, as necessary. The SEC rule
also requires registrants to disclose certain information concerning cybersecurity risk management, strategy and governance on
Form 10-K.
The federal banking regulators regularly issue guidance regarding cybersecurity intended to enhance cyber risk management
standards among financial institutions. As a result, financial institutions, like the Company and the Bank, are expected to establish
multiple lines of defense and to ensure their risk management processes address the risk posed by potential threats to the
institution. A financial institution’s management is expected to maintain sufficient processes to effectively respond and recover
the institution’s operations after a cyber-attack. A financial institution is also expected to develop appropriate processes to enable
recovery of data and business operations if a critical service provider of the institution falls victim to this type of cyber-attack. In
addition, effective in December 2023, the SEC enhanced and standardized the disclosure obligations related to a registrant's
cybersecurity risk management, strategy, and governance. Our information security protocols are designed in part to adhere to the
requirements of bank regulatory guidance and these enhanced SEC disclosure requirements. See "Part I - Item 1C. Cybersecurity"
of this Report for additional information on cybersecurity.
State regulators have also been increasingly active in implementing privacy and cybersecurity standards and regulations.
Recently, several states have adopted regulations requiring certain financial institutions to implement cybersecurity programs and
providing detailed requirements with respect to these programs, including data encryption requirements. Many states have also
recently implemented or modified their data breach notification and data privacy requirements. We expect this trend of state-level
activity in those areas to continue and are continually monitoring developments in the states in which our clients are located.
See Item 1A. Risk Factors for a further discussion of risks related to cybersecurity and Item 1C. Cybersecurity for a further
discussion of risk management strategies and governance processes related to cybersecurity.
21
Consumer Laws and Regulations
Activities of the Bank are subject to a variety of statutes and regulations designed to protect consumers. These laws and
regulations include, among numerous other things, provisions that:
●
limit the interest and other charges collected or contracted for by the Bank, including rules respecting the terms of credit
cards and of debit card overdrafts;
●
govern the Bank’s disclosures of credit terms to consumer borrowers;
●
require the Bank to provide information to enable the public and public officials to determine whether it is fulfilling its
obligation to help meet the housing needs of the communities it serves;
●
prohibit the Bank from discriminating on the basis of race, creed, or other prohibited factors when it makes decisions to
extend credit;
●
govern the manner in which the Bank may collect consumer debts; and
●
prohibit unfair, deceptive, or abusive acts or practices in the provision of consumer financial products and services.
The Consumer Financial Protection Bureau (“CFPB”) adopted a rule that implements the ability-to-repay and qualified mortgage
provisions of the Dodd-Frank Act (the “ATR/QM rule”), which requires lenders to consider, among other things, income,
employment status, assets, payment amounts, and credit history before approving a mortgage, and provides a compliance “safe
harbor” for lenders that issue certain “qualified mortgages.” The ATR/QM rule defines a “qualified mortgage” to have certain
specified characteristics and generally prohibits loans with negative amortization, interest-only payments, balloon payments, or
terms exceeding 30 years from being qualified mortgages. The rule also establishes general underwriting criteria for qualified
mortgages, including that monthly payments be calculated based on the highest payment that will apply in the first five years of
the loan and that the borrower have a total debt-to-income ratio that is less than or equal to 43%. While “qualified mortgages” will
generally be afforded safe harbor status, a rebuttable presumption of compliance with the ability-to-repay requirements will attach
to “qualified mortgages” that are “higher priced mortgages” (which are generally subprime loans). In addition, the securitizer of
asset-backed securities must retain not less than 5% of the credit risk of the assets collateralizing the asset-backed securities,
unless subject to an exemption for asset-backed securities that are collateralized exclusively by residential mortgages that qualify
as “qualified residential mortgages.”
The CFPB has also issued rules to implement requirements of the Dodd-Frank Act pertaining to mortgage loan origination
(including with respect to loan originator compensation and loan originator qualifications) as well as integrated mortgage
disclosure rules. In addition, the CFPB has issued rules that require servicers to comply with certain standards and practices with
regard to error correction; information disclosure; force-placement of insurance; information management policies and
procedures; requiring information about mortgage loss mitigation options be provided to delinquent borrowers; providing
delinquent borrowers access to servicer personnel with continuity of contact about the borrower’s mortgage loan account; and
evaluating borrowers’ applications for available loss mitigation options. These rules also address initial rate adjustment notices for
adjustable-rate mortgages, periodic statements for residential mortgage loans, and prompt crediting of mortgage payments and
response to requests for payoff amounts.
Future Legislative Developments
Various bills are from time to time introduced in the U.S. Congress and the Florida legislature. This legislation may change
banking and tax statutes and the environment in which our banking subsidiary and we operate in substantial and unpredictable
ways. We cannot determine the ultimate effect that potential legislation, if enacted, or implementing regulations with respect
thereto, would have upon our financial condition or results of operations or that of our banking subsidiary.
Effect of Governmental Monetary Policies
The commercial banking business is affected not only by general economic conditions, but also by the monetary policies of the
Federal Reserve. Changes in the discount rate on member bank borrowing, availability of borrowing at the “discount window,”
open market operations, changes in the Fed Funds target interest rate, changes in interest rates payable on reserve accounts, the
imposition of changes in reserve requirements against member banks’ deposits and assets of foreign banking centers and the
imposition of and changes in reserve requirements against certain borrowings by banks and their affiliates are some of the
instruments of monetary policy available to the Federal Reserve. These monetary policies are used in varying combinations to
influence overall growth and distributions of bank loans, investments and deposits, which may affect interest rates charged on
loans or paid on deposits. The monetary policies of the Federal Reserve have had a significant effect on the operating results of
commercial banks and are expected to continue to do so in the future. The Federal Reserve’s policies are primarily influenced by
its dual mandate of price stability and full employment, and, to a lesser degree by short-term and long-term changes in the
international trade balance and in the fiscal policies of the U.S. Government. Future changes in monetary policy and the effect of
such changes on our business and earnings in the future cannot be predicted.
22
Website Access to Company’s Reports
Our Internet website is www.ccbg.com. Our annual reports on Form 10-K, quarterly reports on Form 10-Q, current reports on
Form 8-K, including any amendments to those reports filed or furnished pursuant to section 13(a) or 15(d), and reports filed
pursuant to Section 16, 13(d), and 13(g) of the Exchange Act are available free of charge through our website as soon as
reasonably practicable after they are electronically filed with, or furnished to, the SEC. The information on our website is not
incorporated by reference into this report.
23
Item 1A. Risk Factors
An investment in our common stock contains a high degree of risk. You should consider carefully the following risk factors before
deciding whether to invest in our common stock. Our business, including our operating results and financial condition, could be
harmed by any of these risks. Additional risks and uncertainties not currently known to us or that we currently deem to be
immaterial also may materially and adversely affect our business. The trading price of our common stock could decline due to
any of these risks, and you may lose all or part of your investment. In assessing these risks, you should also refer to the other
information contained in our filings with the SEC, including our financial statements and related notes.
Market Risks
We may incur losses if we are unable to successfully manage interest rate risk.
Our profitability depends to a large extent on Capital City Bank’s net interest income, which is the difference between income on
interest-earning assets, such as loans and investment securities, and expense on interest-bearing liabilities such as deposits and
borrowings. We are unable to predict changes in market interest rates, which are affected by many factors beyond our control,
including inflation, changes in trade policies by the United States or other countries, such as tariffs or retaliatory tariffs, recession,
unemployment, federal funds target rate, money supply, domestic and international events and changes in the United States and
other financial markets. Our net interest income may be reduced if: (i) more interest-earning assets than interest-bearing liabilities
reprice or mature during a time when interest rates are declining or (ii) more interest-bearing liabilities than interest-earning assets
reprice or mature during a time when interest rates are rising.
Changes in the difference between short-term and long-term interest rates may also harm our business. We generally use short-
term deposits to fund longer-term assets. When interest rates change, assets and liabilities with shorter terms reprice more quickly
than those with longer terms, which could have a material adverse effect on our net interest margin. During 2022 and 2023, the
Federal Reserve raised the federal funds rate 11 times for a cumulative increase of 5.25%. In 2024, the Federal Reserve began
lowering the federal funds rate and lowered it three times during the year for a cumulative decrease of 1.00%. We are currently
operating in an environment in which the Federal Reserve has shifted toward reducing interest rates, although modestly, with cuts
implemented in September, October and December 2025. However, the inflationary outlook remains uncertain and if the Federal
Reserve were to further decrease interest rates, this may constrain our interest rate spread due to our asset sensitivity and may
adversely affect our business forecasts. On the other hand, rapid increases in the target federal funds rate may result in a change in
the mix of noninterest and interest-bearing accounts and effect our interest rate spread. New appointments to the Board of
Governors at the Federal Reserve could result in a change in monetary policy and interest rates, and the potential erosion of
Federal Reserve independence could negatively impact financial markets and impact our profitability. We are unable to predict
changes in interest rates, which are affected by factors beyond our control, including inflation, deflation, recession,
unemployment, money supply and other changes in financial markets.
Although we continuously monitor interest rates and have a number of tools to manage our interest rate risk exposure, changes in
market assumptions regarding future interest rates could significantly impact our interest rate risk strategy, our financial position
and results of operations. If we do not properly monitor our interest rate risk management strategies, these activities may not
effectively mitigate our interest rate sensitivity or have the desired impact on our results of operations or financial condition.
Interest rates and economic conditions affect consumer demand for housing and can create volatility in the mortgage industry.
These risks can have a material impact on the volume of mortgage originations and refinancings, adversely affecting mortgage
banking revenues and the profitability of our mortgage banking business.
See Item 7. Management’s Discussion and Analysis of Financial Condition and Results of Operations under the section captioned
“Net Interest Income” and “Market Risk and Interest Rate Sensitivity” elsewhere in this report for further discussion related to
interest rate sensitivity and our management of interest rate risk.
The impact of interest rates on our mortgage banking business can have a significant impact on revenues.
Changes in interest rates can impact our mortgage-related revenues and net revenues associated with our mortgage activities.
A
decline in mortgage rates generally increases the demand for mortgage loans as borrowers refinance, but also generally leads to
accelerated payoffs. Conversely, in a constant or increasing rate environment, we would expect fewer loans to be refinanced and a
decline in payoffs. Although we use models to assess the impact of interest rates on mortgage-related revenues, the estimates of
revenues produced by these models are dependent on estimates and assumptions of future loan demand, prepayment speeds and
other factors which may differ from actual subsequent experience.
24
Inflationary pressures and rising prices may affect our results of operations and financial condition.
Small to medium-sized businesses may be impacted more during periods of high inflation as they are not able to leverage
economies of scale to mitigate cost pressures compared to larger businesses. Consequently, the ability of our business customers
to repay their loans may deteriorate, and in some cases this deterioration may occur quickly, which would adversely impact our
results of operations and financial condition. Furthermore, a prolonged period of inflation could cause wages and other costs to
further increase which could adversely affect our results of operations and financial condition. Sustained higher interest rates by
the Federal Reserve may be needed to tame persistent inflationary price pressures, which could push down asset prices and
weaken economic activity. A deterioration in economic conditions in the United States and our markets could result in an increase
in loan delinquencies and non-performing assets, decreases in loan collateral values and a decrease in demand for our products
and services, all of which, in turn, would adversely affect our business, financial condition and results of operations.
Our profitability depends significantly on economic conditions in the States of Florida and Georgia.
Our profitability and the success of our business depends substantially on the general economic conditions of the States of Florida
and, to a lesser extent, Georgia, as well as the specific local markets in which we operate. Unlike larger national or other regional
banks that are more geographically diversified, we provide banking and financial services primarily to customers across northern
Florida and Georgia. The local economic conditions in these areas have a significant impact on the demand for our products and
services as well as the ability of our customers to repay loans, the value of the collateral securing loans and the stability of our
deposit funding sources. As a result, a significant decline in general economic conditions in Florida or Georgia, whether caused
by recession, inflation, unemployment, in-flows and out-flows of residents, shifts in political landscape, changes in securities
markets, acts of terrorism, pandemics, natural disasters, climate change, outbreak of hostilities or other occurrences or other
factors could have a material adverse effect on our business, financial condition and results of operations.
Changes in customer behavior may have a negative impact on our business, financial condition, and results of operations.
Individual, economic, political, industry -specific conditions and other factors outside of our control, such as fuel prices, energy
costs, real estate values, inflation, tariffs and trade wars, taxes or other factors that affect customer income levels, could alter
anticipated customer behavior, including borrowing, repayment, investment and deposit practices. Such a change in these
practices could materially adversely affect our ability to anticipate business needs and meet regulatory requirements. Further,
difficult economic conditions may negatively affect consumer confidence levels. A decrease in consumer confidence levels would
likely aggravate the adverse effects of these difficult market conditions on us and our customers.
The fair value of our investments could decline, which would cause a reduction in shareowners’ equity.
A portion of our investment securities portfolio (62.9%) at December 31, 2025 has been designated as available-for-sale pursuant
to U.S. generally accepted accounting principles relating to accounting for investments. Such principles require that unrealized
gains and losses in the estimated value of the available-for-sale portfolio be “marked to market” and reflected as a separate item in
shareowners’ equity (net of tax) as accumulated other comprehensive income/losses. Shareowners’ equity will continue to reflect
the unrealized gains and losses (net of tax) of these investments. The fair value of our investment portfolio may decline, causing a
corresponding decline in shareowners’ equity.
Management believes that several factors will affect the fair values of our investment portfolio. These include, but are not limited
to, changes in interest rates or expectations of changes in interest rates, the degree of volatility in the securities markets, inflation
rates or expectations of inflation and the slope of the interest rate yield curve (the yield curve refers to the differences between
short-term and long-term interest rates; a positively sloped yield curve means short -term rates are lower than long-term rates).
These and other factors may impact specific categories of the portfolio differently, and we cannot predict the effect these factors
may have on any specific category.
Shares of our common stock are not an insured deposit and may lose value.
The shares of our common stock are not a bank deposit and will not be insured or guaranteed by the FDIC or any other
government agency. Your investment will be subject to investment risk, and you must be capable of affording the loss of your
entire investment.
Limited trading activity for shares of our common stock may contribute to price volatility.
While our common stock is listed and traded on the Nasdaq Global Select Market, there has historically been limited trading
activity in our common stock. The average daily trading volume of our common stock over the 12-month period ending
December 31, 2025 was approximately 37,371 shares. Due to the limited trading activity of our common stock, relativity small
trades may have a significant impact on the price of our common stock. Similarly, significant sales of our common stock, or the
expectation of these sales, could cause our stock prices to fall.
25
Securities analysts may not initiate coverage or continue to cover our common stock, and this may have a negative impact
on its market price.
The trading market for our common stock will depend in part on the research and reports that securities analysts publish about us
and our business. We do not have any control over securities analysts, and they may not initiate coverage or continue to cover our
common stock. If any securities analysts covering our common stock publishes an unfavorable report, our stock price would
likely decline. If one or more of analysts covering our common stock ceases to cover our Company or fails to publish regular
reports on us, the lack of research coverage and lose of visibility in the financial markets may cause our stock price or trading
volume to decline.
Credit Risks
Our loan portfolio includes loans with a higher risk of loss which could lead to higher loan losses and nonperforming
assets.
We originate commercial real estate loans, commercial loans, construction loans, vacant land loans, consumer loans, and
residential mortgage loans primarily within our market area. Commercial real estate, commercial, construction, vacant land, and
consumer loans may expose a lender to greater credit risk than traditional fixed-rate fully amortizing loans secured by residential
real estate because the collateral securing these loans may not be sold as easily as residential real estate. In addition, these loan
types tend to involve larger loan balances to a single borrower or groups of related borrowers and are more susceptible to a risk of
loss during a downturn in the business cycle. These loans also have historically had greater credit risk than other loans for the
following reasons:
●
Commercial Real Estate Loans
. Repayment is dependent on income being generated in amounts sufficient to cover
operating expenses and debt service. These loans also involve greater risk because they are generally not fully amortizing
over the loan period, but rather have a balloon payment due at maturity. A borrower’s ability to make a balloon payment
typically will depend on the borrower’s ability to either refinance the loan or timely sell the underlying property. Further,
these loans generally are more affected by adverse conditions in the economy. Because payments on loans secured by
commercial real estate often depend upon the successful operation and management of the properties and the businesses
which operate from within them, repayment of such loans may be affected by factors outside the borrower’s control,
such as adverse conditions in the real estate market or the economy or changes in government regulations. At December
31, 2025, commercial mortgage loans comprised approximately 30.2% of our total loan portfolio.
●
Commercial Loans
. Repayment is generally dependent upon the successful operation of the borrower’s business. In
addition, the collateral securing the loans may depreciate over time, be difficult to appraise, be illiquid, or fluctuate in
value based on the success of the business. These loans are also sensitive to broader economic conditions, competitive
pressures, and industry-specific trends, any of which may disproportionately impact certain segments during periods of
stress and increase the likelihood of credit deterioration. At December 31, 2025, commercial loans comprised
approximately 7.1% of our total loan portfolio.
●
Construction Loans
. The risk of loss is largely dependent on our initial estimate of whether the property’s value at
completion equals or exceeds the cost of property construction and the availability of take-out financing. During the
construction phase, a number of factors can result in delays or cost overruns. If our estimate is inaccurate or if actual
construction costs exceed estimates,
which could be impacted by factors outside of our control, including tariff, trade,
and immigration policies, the value of the property securing our loan may be insufficient to ensure full repayment when
completed through a permanent loan, sale of the property, or by seizure of collateral. At December 31, 2025,
construction loans comprised approximately 5.8% of our total loan portfolio.
●
Vacant Land Loans
. Because vacant or unimproved land is generally held by the borrower for investment purposes or
future use, payments on loans secured by vacant or unimproved land will typically rank lower in priority to the borrower
than a loan the borrower may have on their primary residence or business. These loans are susceptible to adverse
conditions in the real estate market and local economy. At December 31, 2025, vacant land loans comprised
approximately 3.8% of our total loan portfolio.
●
HELOCs
. Our open-ended home equity loans have an interest-only draw period followed by a five-year repayment
period of 0.75% of the principal balance monthly and a balloon payment at maturity. Upon the commencement of the
repayment period, the monthly payment can increase significantly, thus, there is a heightened risk that the borrower will
be unable to pay the increased payment. Further, these loans also involve greater risk because they are generally not fully
amortizing over the loan period but rather have a balloon payment due at maturity. A borrower’s ability to make a
balloon payment may depend on the borrower’s ability to either refinance the loan or timely sell the underlying property.
At December 31, 2025, HELOCs comprised approximately 9.5% of our total loan portfolio.
26
●
Consumer Loans
. Consumer loans (such as automobile loans and personal lines of credit) are collateralized, if at all,
with assets that may not provide an adequate source of payment of the loan due to depreciation, damage, or loss. At
December 31, 2025, consumer loans comprised approximately 7.2% of our total loan portfolio, with indirect auto loans
making up a majority of this portfolio at approximately 85.9% of the total balance.
The increased risks associated with these types of loans result in a correspondingly higher probability of default on such loans (as
compared to fixed-rate fully amortizing single-family real estate loans). Loan defaults would likely increase our loan losses and
nonperforming assets and could adversely affect our allowance for credit losses and our results of operations.
In addition, credit
risk may be elevated by borrower or third party fraud, inaccuracies in financial information, or misrepresentations in loan
documentation. As seen across the banking industry, evolving fraud schemes and greater digitization of financial transactions can
increase the risk that loans are underwritten based on incomplete, inaccurate, or falsified information, which may heighten the risk
of unexpected credit losses.
Our loan portfolio is heavily concentrated in mortgage loans secured by properties in Florida and Georgia which causes
our risk of loss to be higher than if we had a more geographically diversified portfolio.
Our interest-earning assets are heavily concentrated in mortgage loans secured by real estate, particularly real estate located in
Florida and Georgia. At December 31, 2025, approximately 85.7% of our loans included real estate as a primary, secondary, or
tertiary component of collateral. The real estate collateral in each case provides an alternate source of repayment in the event of
default by the borrower; however, the value of the collateral may decline during the time the credit is extended. If we are required
to liquidate the collateral securing a loan during a period of reduced real estate values to satisfy the debt, our earnings and capital
could be adversely affected.
Additionally, at December 31, 2025, a significant number of our loans secured by real estate are secured by commercial and
residential properties located in Florida and Georgia. The concentration of our loans in these areas subjects us to risk that a
downturn in the economy or recession in these areas could result in a decrease in loan originations and increases in delinquencies
and foreclosures, which would more greatly affect us than if our lending were more geographically diversified. In addition, since
a large portion of our portfolio is secured by properties located in Florida and Georgia, the occurrence of a natural disaster, such
as a hurricane, or a man-made disaster could result in a decline in loan originations, a decline in the value or destruction of
mortgaged properties and an increase in the risk of delinquencies, foreclosures or loss on loans originated by us. Severe weather
events, catastrophic natural disasters, or other large-scale disruptions may also rapidly impair collateral values and borrower
repayment capacity across an entire geographic market, increasing both credit losses and required credit-loss reserves. We may
suffer further losses due to the decline in the value of the properties underlying our mortgage loans, which would have an adverse
impact on our results of operations and financial condition.
Our concentration in loans secured by real estate may increase our credit losses, which would negatively affect our
financial results.
Due to the lack of diversified industry within some of the markets served by CCB and the relatively close proximity of our
geographic markets, we have both geographic concentrations as well as concentrations in the types of loans funded. Specifically,
due to the nature of our markets, a significant portion of the portfolio has historically been secured with real estate. At December
31, 2025, approximately 31.5% and 54.2% of our $2.546 billion loan portfolio was secured by commercial real estate and
residential real estate, respectively. As of this same date, approximately 5.8% was secured by property under construction. Due to
the exposure in these concentrations, disruptions in markets, economic conditions, changes in laws or regulations or other events
could cause a significant impact on the ability of borrowers to repay and may have a material adverse effect on our business,
financial condition and results of operations.
In weak economies, or in areas where real estate market conditions are distressed, we may experience a higher than normal level
of nonperforming real estate loans. The collateral value of the portfolio and the revenue stream from those loans could come
under stress, and additional provisions for the allowance for credit losses could be necessitated. In the event we are required to
foreclose on a property securing one of our mortgage loans or otherwise pursue our remedies in order to protect our investment,
we may be unable to recover funds in an amount equal to our projected return on our investment or in an amount sufficient to
prevent a loss to us due to prevailing economic conditions, real estate values and other factors associated with the ownership of
real property. As a result, the market value of the real estate or other collateral underlying our loans may not, at any given time, be
sufficient to satisfy the outstanding principal amount of the loans, and consequently, we would sustain loan losses.
27
An inadequate allowance for credit losses would reduce our earnings.
We are exposed to the risk that our clients may be unable to repay their loans according to their terms and that any collateral
securing the payment of their loans may not be sufficient to assure full repayment. This could result in credit losses that are
inherent in the lending business. We evaluate the collectability of our loan portfolio and provide an allowance for credit losses
that we believe is adequate based upon such factors as: the risk characteristics of various classifications of loans; previous loan
loss experience; specific loans that have loss potential; delinquency trends; estimated fair market value of the collateral; current
and future economic conditions; and geographic and industry loan concentrations.
At December 31, 2025, our allowance for credit losses for loans held for investment was $31.0 million, which represented
approximately 1.22% of our total loans held for investment. We had $8.6 million in nonaccruing loans at December 31, 2025.
We cannot provide any assurance that our monitoring procedures and policies will reduce certain lending risks, and while the
allowance is based on management’s reasonable estimate and may not prove sufficient to cover future loan losses. Although
management uses the best information available to make determinations with respect to the allowance for credit losses, future
adjustments may be necessary if economic conditions differ substantially from the assumptions used or adverse developments
arise with respect to our nonperforming or performing loans. In addition, regulatory agencies, as an integral part of their
examination process, periodically review our estimated losses on loans. Our regulators may require us to recognize additional
losses based on their judgments about information available to them at the time of their examination. Accordingly, the allowance
for credit losses may not be adequate to cover all future loan losses and significant increases to the allowance may be required in
the future if, for example, economic conditions worsen. A material increase in our allowance for credit losses would adversely
impact our net income and capital in future periods, while having the effect of overstating our current period earnings.
Failures in the analytical and forecasting models relied upon for our accounting estimates and risk management processes
could have a material adverse effect on our business, financial condition, and results of operations.
The processes we use to estimate our expected credit losses and to measure the fair value of financial instruments, as well as the
processes used to estimate the effects of changing interest rates and other market measures on our financial condition and results
of operations, depends upon the use of analytical and forecasting models. These models reflect assumptions that may not be
accurate, particularly in times of market stress or other unforeseen circumstances. Even if these assumptions are adequate, the
models may prove to be inadequate or inaccurate because of other flaws in their design or their implementation, including flaws
caused by failures in controls, data management, human error or from the reliance on technology. If the models we use for interest
rate risk and asset-liability management are inadequate, we may incur increased or unexpected losses upon changes in market
interest rates or other market measures. If the models we use for estimating our expected credit losses are inadequate, the
allowance for credit losses may not be sufficient to support future charge-offs. If the models we use to measure the fair value of
financial instruments are inadequate, the fair value of such financial instruments may fluctuate unexpectedly or may not
accurately reflect what we could realize upon sale or settlement of such financial instruments. Any such failure in our analytical
or forecasting models could have a material adverse effect on our business, financial condition, and results of operations.
We may incur significant costs associated with the ownership of real property as a result of foreclosures, which could
reduce our net income.
Since we originate loans secured by real estate, we may have to foreclose on the collateral property to protect our investment and
may thereafter own and operate such property, in which case we would be exposed to the risks inherent in the ownership of real
estate.
The amount that we, as a mortgagee, may realize after a foreclosure is dependent upon factors outside of our control, including,
but not limited to: general or local economic conditions; environmental cleanup liability; neighborhood values; interest rates; real
estate tax rates; operating expenses of the mortgaged properties; supply of and demand for rental units or properties; ability to
obtain and maintain adequate occupancy of the properties; zoning laws; governmental rules, regulations and fiscal policies; and
acts of God.
Certain expenditures associated with the ownership of real estate, including real estate taxes, insurance and maintenance costs,
may adversely affect the income from the real estate. Furthermore, we may need to advance funds to continue to operate or to
protect these assets. As a result, the cost of operating real property assets may exceed the rental income earned from such
properties or we may be required to dispose of the real property at a loss.
28
Reliance on inaccurate or misleading financial statements, credit reports, or other financial information could have a
material adverse impact on our business, financial condition, and results of operations.
In deciding whether to extend credit or enter into other transactions, we rely on information furnished by or on behalf of
customers and counterparties, including financial statements, credit reports, and other financial information. We also rely on
representations of those customers, counterparties, or other third parties, such as independent auditors, as to the accuracy and
completeness of that information. Reliance on inaccurate or misleading financial statements, credit reports, or other financial
information could have a material adverse impact on our business, financial condition, and results of operations.
Liquidity and Capital Risks
Liquidity risk could impair our ability to fund operations and jeopardize our financial condition.
Effective liquidity management is essential for the operation of our business. We require sufficient liquidity to meet client loan
requests, client deposit maturities and withdrawals, payments on our debt obligations as they come due and other cash
commitments under both normal operating conditions and other unpredictable circumstances causing industry or general financial
market stress. If we are unable to raise funds through deposits, borrowings, earnings and other sources, it could have a substantial
negative effect on our liquidity. In particular, a majority of our liabilities during 2025 were checking accounts and other liquid
deposits, which are generally payable on demand or upon short notice. By comparison, a substantial majority of our assets were
loans, which cannot generally be called or sold in the same time frame. Although we have historically been able to replace
maturing deposits and advances as necessary, we might not be able to replace such funds in the future, especially if a large
number of our depositors seek to withdraw their accounts at the same time, regardless of the reason. Our access to funding
sources in amounts adequate to finance our activities on terms that are acceptable to us could be impaired by factors that affect us
specifically or the financial services industry or economy in general. Factors that could negatively impact our access to liquidity
sources include a decrease in the level of our business activity as a result of a downturn in the markets in which our loans are
concentrated, adverse regulatory action against us, or our inability to attract and retain deposits. Our access to deposits may be
negatively impacted by, among other factors, periods of low interest rates or high interest rates. Periods of high interest rates
could promote increased competition for deposits, including from new financial technology competitors, or provide customers
with alternative investment options. Our ability to borrow could also be impaired by factors that are not specific to us, such as a
disruption in the financial markets or negative views and expectations about the prospects for the financial services industry. If we
are unable to maintain adequate liquidity, it could materially and adversely affect our business, results of operations or financial
condition.
A significant decrease in our public fund deposit balances as a result of increased competition in the current higher
interest-rate environment and seasonal nature of these deposits could materially and adversely affect our liquidity.
The Company has many long-standing relationships with municipal entities throughout its markets and the deposits held by these
customers have provided a relatively attractive and stable (although seasonal) funding source for the Company over an extended
period of time. Public fund deposits from local government entities such as universities, counties, school districts, and other
municipalities generally have higher average balances and historically been more volatile than nonpublic deposits because they
are heavily impacted by the seasonality of tax collection, changes in competitive and market forces, and fiscal spending patterns,
as well as the longer-term financial position of local government entities, which can change from year to year. Such public fund
deposits are often subject to competitive bidding and in many cases must be secured by pledging a portion of our investment
securities.
The Company’s inability to retain public fund deposit balances due to increased competition in the current higher
interest-rate environment and seasonal nature of these deposits could materially and adversely affect our liquidity or result in the
use of higher-cost funding sources, which, in turn, could materially and adversely affect our business, results of operations or
financial condition.
29
Unrealized losses in our securities portfolio could materially and adversely affect our liquidity.
We have experienced significant unrealized losses on our available-for-sale securities portfolio as a result of increases in market
interest rates. Unrealized losses related to available-for-sale securities are reflected in accumulated other comprehensive income
in our consolidated statements of financial condition and reduce the level of our book capital and tangible common equity.
However, such unrealized losses do not affect our regulatory capital ratios. We actively monitor our available-for-sale securities
portfolio and we do not currently anticipate the need to realize material losses from the sale of securities for liquidity purposes.
Furthermore, we believe it is unlikely that we would be required to sell any such securities before recovery of their amortized cost
bases, which may be at maturity. Nonetheless, our access to liquidity sources could be affected by unrealized losses if securities
must be sold at a loss, tangible capital ratios decline from an increase in unrealized losses or realized credit losses, the Federal
Home Loan Bank of Atlanta (“FHLB”) or other funding sources reduce capacity, or bank regulators impose restrictions on us that
impact the level of interest rates we may pay on deposits or our ability to access federal funds lines or brokered deposits.
Additionally, significant unrealized losses could negatively impact market and customer perceptions of the Company, which
could lead to a loss of depositor confidence and an increase in deposit withdrawals, particularly among those with uninsured
deposits.
We may need to raise additional capital in the future, and such capital may not be available on acceptable terms or at all.
We may need to raise additional capital in the future to provide us with sufficient capital resources and liquidity to meet our
commitments and business needs, particularly if our asset quality or earnings were to deteriorate significantly. Our ability to raise
additional capital, if needed, will depend on, among other things, conditions in the capital markets at that time, which are outside
of our control, and our financial condition. Economic conditions and the loss of confidence in financial institutions may increase
our cost of funding and limit access to certain customary sources of capital, including inter-bank borrowings, repurchase
agreements and borrowings from the discount window of the Federal Reserve.
As a result, we may be unable to raise capital on terms favorable to us, in a timely manner or at all, which could materially and
adversely affect our liquidity, business, results of operations, or financial condition. Moreover, if we need to raise capital in the
future, we may have to do so when many other financial institutions are also seeking to raise capital and would have to compete
with those institutions for investors.
We may be unable to pay dividends in the future.
In 2025, our Board of Directors declared four quarterly cash dividends. Declarations of any future dividends will be contingent on
our ability to earn sufficient profits and to remain well capitalized, including our ability to hold and generate sufficient capital to
comply with the Common Equity Tier 1 (“CET1”) Capital conservation buffer requirement. In addition, due to our contractual
obligations with the holders of our trust preferred securities, if we defer the payment of accrued interest owed to the holders of our
trust preferred securities, we may not make dividend payments to our shareowners.
Further, under applicable statutes and regulations, CCB’s board of directors, after charging-off bad debts, depreciation and other
worthless assets, if any, and making provisions for reasonably anticipated future losses on loans and other assets, may quarterly,
semi-annually, or annually declare and pay dividends to CCBG of up to the aggregate net income of that period combined with
the CCB’s retained net income for the preceding two years and, with the approval of the Florida OFR, declare a dividend from
retained net income which accrued prior to the preceding two years. The prior approval of the Federal Reserve is required if the
total of all dividends declared by a state-chartered member bank in any calendar year would exceed the sum of the bank’s net
income for that year and its retained net income for the preceding two calendar years, less any required transfers to surplus or to
fund the retirement of preferred stock. Additional state laws generally applicable to Florida corporations and guidelines of the
Federal Reserve may also limit our ability to declare and pay dividends. Thus, our ability to fund future dividends may be
restricted by state and federal laws and regulations.
Regulatory and Compliance Risks
We are subject to extensive regulation, which could restrict our activities and impose financial requirements or limitations
on the conduct of our business.
We are subject to extensive regulation, supervision and examination by our regulators, including the Florida OFR, the Federal
Reserve, and the FDIC. Our compliance with these industry regulations is costly and restricts certain of our activities, including
payment of dividends, mergers and acquisitions, investments, lending and interest rates charged on loans, interest rates paid on
deposits, the fees we can charge for certain products or transactions, access to capital and brokered deposits, and locations of
banking offices. If we are unable to meet these regulatory requirements, our financial condition, liquidity and results of operations
would be materially and adversely affected.
30
Our activities are also regulated under consumer protection laws applicable to our lending, deposit, and other activities. Many of
these regulations are intended primarily for the protection of our depositors, the DIF, and the banking system as a whole, and not
for the benefit of our shareowners. In addition to the regulations of the bank regulatory agencies, as a member of the FHLB of
Atlanta, we must also comply with applicable regulations of the Federal Housing Finance Agency and the Federal Home Loan
Bank.
Regulators have continued to focus on compliance with AMLA and BSA obligations and the rules enforced by OFAC. If our
policies, procedures and systems are deemed deficient or the policies, procedures are deficient, we would be subject to liability,
including fines and regulatory actions such as restrictions on our ability to pay dividends and the necessity to obtain regulatory
approvals to proceed with certain aspects of our business plan, including any acquisition plans.
Our failure to comply with these laws and regulations could subject us to the loss of FDIC insurance, reputational damage, the
revocation of our banking charter, enforcement actions, sanctions, or other legal actions by regulatory agencies, restrictions on our
business activities, fines, and other penalties, any of which could adversely affect our results of operations, capital base, and the
price of our securities. Changes to any new laws, rules, regulations, policies, and supervisory guidance (including changes in
interpretation and implementation) have and could make compliance more difficult or expensive and could otherwise adversely
affect our business and financial condition.
Government authorities, including the bank regulatory agencies, are pursuing aggressive enforcement actions with respect to
compliance and other legal matters involving financial activities (including new prohibitions on politicized debanking), which
heightens the risks associated with actual and perceived compliance failures. Directives issued to enforce such actions may be
confidential and thus, in some instances, we are not permitted to publicly disclose these actions. Litigation challenging actions or
regulations by federal or state authorities could, depending on the outcome, significantly affect the regulatory and supervisory
framework affecting our operations. Any of the foregoing could have a material adverse effect on our business, financial
condition, and results of operations.
In addition, we face increased regulatory scrutiny, in the course of routine examinations and otherwise, and new regulations in
response to negative developments in the banking industry, which may increase our cost of doing business and reduce our
profitability. Among other things, there may be increased focus by both regulators and investors on deposit composition, the level
of uninsured deposits, brokered deposits, unrealized losses in securities portfolios, liquidity, commercial real estate loan
composition and concentrations, and capital as well as general oversight and control of the foregoing. We could face increased
scrutiny or be viewed as higher risk by regulators and the investor community, which could have a material adverse effect on our
business, financial condition, and results of operations.
U.S. federal banking agencies may require us to increase our regulatory capital, long-term debt or liquidity requirements,
which could result in the need to issue additional qualifying securities or to take other actions, such as to sell company
assets.
We are subject to U.S. regulatory capital and liquidity rules. These rules, among other things, establish minimum requirements to
qualify as a well-capitalized institution. If CCB fails to maintain its status as well capitalized under the applicable regulatory
capital rules, the Federal Reserve will require us to agree to bring the bank back to well-capitalized status. For the duration of
such an agreement, the Federal Reserve may impose restrictions on our activities. If we were to fail to enter into or comply with
such an agreement or fail to comply with the terms of such agreement, the Federal Reserve may impose more severe restrictions
on our activities, including requiring us to cease and desist activities permitted under the Bank Holding Company Act of 1956.
Additionally, if our CET1 to Risk Weighted Assets ratio does not exceed the minimum required plus the additional CET1
conservation buffer, we may be restricted in our ability to pay dividends or make other distributions of capital to our shareowners.
Capital and liquidity requirements are frequently introduced and amended. It is possible that regulators may increase regulatory
capital requirements, change how regulatory capital is calculated or increase liquidity requirements. Requirements to maintain
higher levels of capital may lower our return on equity.
Further changes to and compliance with the regulatory capital and liquidity requirements may impact our operations by requiring
us to liquidate assets, increase borrowings, issue additional equity or other securities, cease or alter certain operations, sell
company assets or hold highly liquid assets, which may adversely affect our results of operations. We may be prohibited from
taking capital actions such as paying or increasing dividends or repurchasing securities.
31
Changes in accounting standards or assumptions in applying accounting policies could adversely affect us.
Our accounting policies and methods are fundamental to how we record and report our financial condition and results of
operations. Some of these policies require use of estimates and assumptions that may affect the reported value of our assets or
liabilities and results of operations and are critical because they require management to make difficult, subjective and complex
judgments about matters that are inherently uncertain. If those assumptions, estimates or judgments were incorrectly made, we
could be required to correct and restate prior-period financial statements. Accounting standard-setters and those who interpret the
accounting standards, the SEC, banking regulators and our independent registered public accounting firm may also amend or even
reverse their previous interpretations or positions on how various standards should be applied. These changes may be difficult to
predict and could impact how we prepare and report our financial statements. In some cases, we could be required to apply a new
or revised standard retrospectively, resulting in us revising prior-period financial statements.
We are subject to government regulation and oversight relating to data and privacy protection.
Our business requires the collection and retention of large volumes of customer data, including personally identifiable information
in various information systems that we maintain and in those maintained by third parties with whom we contract. We also
maintain important internal company data such as personally identifiable information about our associates and information
relating to our operations. The integrity and protection of that customer and company data is important to us.
We are subject to complex and evolving laws and regulations relating to the privacy of the information of our customers,
associates and others, and any failure to comply with these laws and regulations, or any misuse or mismanagement of such
information, could expose us to liability and reputational damage, which could adversely affect our financial condition and results
of operations. As new privacy-related laws and regulations are implemented, the time and resources needed for us to comply with
such laws and regulations, as well as our potential liability for non-compliance and reporting obligations in the case of data
breaches, may significantly increase. It is possible that these laws may be interpreted and applied by various jurisdictions in a
manner inconsistent with our current or future practices, or that is inconsistent with one another.
Operational Risks
Many types of operational risks can affect our earnings negatively.
We regularly assess and monitor operational risk in our businesses. Despite our efforts to assess and monitor operational risk, our
risk management framework may not be effective in all cases. Factors that can impact operations and expose us to risks varying in
size, scale and scope include:
(1)
failures of technological systems or breaches of security measures, including, but not limited to, those resulting from
computer viruses or cyber-attacks;
(2)
unsuccessful or difficult implementation of computer systems upgrades;
(3)
human errors or omissions, including failures to comply with applicable laws or corporate policies and procedures;
(4)
theft, fraud or misappropriation of assets, whether arising from the intentional actions of internal personnel or external
third parties;
(5)
breakdowns in processes, breakdowns in internal controls or failures of the systems and facilities that support our
operations;
(6)
deficiencies in services or service delivery;
(7)
negative developments in relationships with key counterparties, third-party vendors, or associates in our day-to-day
operations; and
(8)
external events that are wholly or partially beyond our control, such as pandemics, geopolitical events, political unrest,
natural disasters or acts of terrorism.
Operational risks can also arise from increased reliance on digital platforms, remote‑work technologies, cloud‑based solutions,
and other external service providers whose performance or resilience may be outside of our direct control. These forms of reliance
may increase the speed and breadth with which disruptions, control failures, or cyber‑events can affect our operations.
While we have in place many controls and business continuity plans designed to address these factors and others, these plans may
not operate successfully to mitigate these risks effectively. If our controls and business continuity plans do not mitigate the
associated risks successfully, such factors may have a negative impact on our business, financial condition or results of
operations. In addition, an important aspect of managing our operational risk is creating a risk culture in which all associates fully
understand that there is risk in every aspect of our business and the importance of managing risk as it relates to their job functions.
We continue to enhance our risk management program to support our risk culture. Nonetheless, if we fail to provide the
appropriate environment that sensitizes all of our associates to managing risk, our business could be impacted adversely.
32
We are subject to certain operational risks, including, but not limited to
risk arising from failure or circumvention of our
controls and procedures.
Our internal controls, including fraud detection and controls, disclosure controls and procedures, and corporate governance
procedures are based in part on certain assumptions and can provide only reasonable, not absolute, assurances that the objectives
of the controls and procedures are met. Notwithstanding the proliferation of technology and technology-based risk and control
systems, we rely on the ability of our associates and systems to process a high number of transactions, and we are subject to the
risk that our associates may make mistakes or engage in violations of applicable policies, laws, rules, or procedures that in the
past have not, and in the future may not, always be prevented by our technological processes or by our controls and other
procedures intended to prevent and detect such errors or violations. Any failure or circumvention of our controls and procedures,
failure to comply with regulations related to controls and procedures, failure to comply with our corporate governance procedures,
fraud by associates or persons outside our Company, the execution of unauthorized transactions by associates, or errors relating to
transaction processing and technology could have a material adverse effect on our reputation, business, financial condition and
results of operations, including subjecting us to litigation, customer attrition, regulatory fines, penalties, or other sanctions.
Insurance coverage may not be available for losses relating to such event, or where available, such losses may exceed insurance
limits. In addition, evolving regulatory expectations regarding operational resilience, business continuity, vendor oversight, and
internal control effectiveness may require additional investment and may heighten supervisory scrutiny if deficiencies are
identified.
We are subject to credit and/or settlement risk arising from the soundness of other financial institutions and
counterparties which may have a material adverse effect on our business, financial condition, and results of operations.
Financial services institutions are interrelated as a result of trading, clearing, counterparty, or other relationships. We have
exposure to many different industries and counterparties, and routinely execute transactions with counterparties in the financial
services industry, including commercial banks, brokers and dealers, investment banks, other institutional clients, and certain
vendors. Many of these transactions expose us to credit or settlement risk in the event of a default or other failure to adhere to
contractual obligations by a counterparty or client. In addition, our credit or settlement risk may be exacerbated when any
collateral held by us cannot be realized upon or is liquidated at prices not sufficient to recover the full amount of the credit or
derivative exposure due to us. Increased interconnectivity amongst financial institutions also increases the risk of cyber-attacks
and information system failures for financial institutions. Any such losses could have a material adverse effect on our business,
financial condition, and results of operations.
Cybersecurity incidents, including security breaches and failures of our information systems could significantly disrupt
our business, result in the unintended disclosure or misuse of confidential or proprietary information, damage our
reputation, increase our costs, and cause losses.
In the ordinary course of business, we rely on electronic communications and information systems to conduct our operations and
to store sensitive data, including our proprietary business information and that of our clients, and personal information of our
clients and associates. The secure processing, maintenance, and transmission of this information is critical to our operations. Our
systems, including those we maintain with our service providers, vendors, or our clients, could be vulnerable to cybersecurity-
related incidents, which include compromises of information systems, attempts to access information, including customer and
company information, malicious code, computer viruses or other malware, denial of service attacks, phishing attempts, brute
force attacks, exploiting software vulnerabilities (including “zero-day attacks”), ransomware, supply chain attacks, and other
events that could result in unauthorized access, theft, misuse, loss, release, or destruction of data (including confidential customer
information), account takeovers, unavailability of service, or other events. These types of threats may result from human error,
fraud, or criminal activity on the part of external or internal parties, or may result from the failure of technology or information
systems. Further, these types of threats may be exacerbated by recent developments in artificial intelligence and their increased
use to produce sophisticated malware, phishing schemes, and other fraudulent activities. Any failure, interruption, or compromise
in security of these systems could result in significant disruption to our operations.
Financial institutions and companies engaged in data processing have increasingly reported compromises in the security of their
websites or other systems, some of which have involved sophisticated and targeted attacks intended to obtain unauthorized access
to confidential information, destroy data, disrupt or degrade service, sabotage systems, or cause other damage. Our technologies,
systems, networks, and software have been and continue to be subject to cybersecurity threats and attacks, which range from
uncoordinated individual attempts to sophisticated and targeted measures by criminal organizations directed at us. Our customers,
associates, and third parties that we do business with have been, and will likely continue to be, targeted in cybersecurity-related
incidents by parties using fraudulent e-mails, artificial intelligence, and other communications in attempts to misappropriate
passwords, bank account information, or other personal information, or to introduce viruses or other malware programs to our
information systems, or the information systems and devices of our third-party (or fourth-party) service providers and our
customers that are beyond our security control systems. Although we try to mitigate these threats through product improvements,
use of encryption and authentication technology, and customer and employee education, among other things, cybersecurity-
attacks against us, our third-party (or fourth-party) service providers , and our customers are a risk to our business.
33
We may be required to spend significant capital and other resources to protect against the threat of cybersecurity-related incidents
or to alleviate problems caused by such incidents. Any failures related to upgrades and maintenance of our technology and
information systems could increase our information and system security risk. Our increased use of cloud and other technologies,
such as remote work technologies, and the increased connectivity of third parties and electronic devices to our systems also
increases our risk of being subject to a cybersecurity-related incident. The risk of a cybersecurity-related incident has increased as
the number, intensity, and sophistication of attempted attacks and intrusions from around the world have increased. A
cybersecurity-related incident or other significant disruption of our information systems or those of our customers or third-party
service providers and vendors could (i) disrupt the proper functioning of our networks and systems and, therefore, our operations
and those of our customers; (ii) result in the unauthorized access to, destruction, loss, theft, misappropriation, or release of
confidential, sensitive, or otherwise valuable information of ours or our customers; (iii) result in a violation of applicable privacy,
data protection, and other laws, subjecting us to additional regulatory scrutiny and exposing us to civil litigation, enforcement
actions, governmental fines, sanctions, or penalties (which may not be covered by our insurance policies), and possible financial
liability; (iv) require significant management attention and resources to remedy the damages that result; (v) cause increased
expenses and lost revenue; or (vi) cause negative publicity, harm our reputation, or cause a decrease in the number of customers
that choose to do business with us, damaging our ability to generate deposits. The occurrence of any of the foregoing could have a
material adverse effect on our business, financial condition, and results of operations. Furthermore, in the event of a
cybersecurity-related incident, we may be delayed in identifying or responding to the incident, which could increase the negative
impact of the incident on our business, financial condition, and results of operations. While we maintain cybersecurity insurance
coverage, which may apply in the event of certain cybersecurity-related incidents, the amount of coverage may not be adequate
depending on the magnitude of the incident. Furthermore, because cybersecurity -related incidents are inherently difficult to
predict and can take many forms, some incidents may not be covered under our cyber insurance coverage.
Increased fraudulent activity may cause losses to us or our clients, damage to our brand, and increases in our costs, in
turn, materially and adversely affecting our business, financial condition, and results of operations.
Additionally, fraud losses have risen in recent years due in large part to growing and evolving schemes, as well as the
advancement of artificial intelligence. Fraudulent activity has taken many forms, ranging from wire fraud, debit card fraud, credit
card fraud, check fraud, mechanical devices attached to ATMs, social engineering, and phishing attacks to obtain personal
information, business email compromise, or impersonation of clients through the use of falsified or stolen credentials. Many
financial institutions have suffered significant losses in recent years due to the theft of cardholder data that has been illegally
exploited for personal gain. The potential for debit and credit card fraud, as well as check fraud, against us or our clients and our
third-party service providers is a serious issue. Debit and credit card fraud and check fraud are pervasive, and the risks of
cybercrime are complex and continue to evolve. While we have policies and procedures, as well as fraud detection tools, designed
to prevent fraud losses, such policies, procedures, and tools may be insufficient to accurately detect and prevent fraud. A
significant increase in fraudulent activities could lead us to take additional steps to reduce fraud risk, which could increase our
costs. Fraud losses could cause losses to us or our clients, damage to our brand, and an increase in our costs, in turn, materially
and adversely affecting our business, financial condition, and results of operations.
The development and use of Artificial Intelligence (“AI”) presents risks and challenges that may adversely impact our
business.
The banking and financial services industry continually experiences technological changes, with frequent introductions of new
technology-driven products and services, including recent and rapid developments in AI, including with agentic AI. Our future
success will depend, in part, upon our ability to address the needs of our clients by using technology to provide products and
services that will satisfy client demands for convenience, as well as to assess the proper operation of AI models and capabilities
to create additional efficiencies in our operations. We may not be able to effectively implement new technology- driven products
and services or be successful in marketing these products and services to our clients. In addition, the implementation of
technological changes and upgrades to maintain current systems and integrate new ones may also create service interruptions,
transaction processing errors, and system conversion delays and may cause us to fail to comply with applicable laws. There can
be no assurance that we will be able to successfully manage the risks associated with our increased dependency on technology.
Failure to successfully keep pace with technological change affecting the banking and financial services industry could
negatively affect our revenue and profitability.
34
We or our third-party (or fourth party) vendors, customers or counterparties may develop or incorporate AI technology in certain
business processes, services, or products. The development and use of AI presents a number of risks and challenges to our
business. The legal and regulatory environment relating to AI is uncertain and rapidly evolving, both in the U.S. and
internationally, and includes regulatory schemes targeted specifically at AI as well as provisions in intellectual property, privacy,
consumer protection, employment, and other laws applicable to the use of AI. These evolving laws and regulations could require
changes in our implementation of AI technology and increase our compliance costs and the risks to us of non- compliance. AI
models, particularly generative or agentic AI models, may produce outputs or take action that is incorrect, that reflects biases
included in the data on which they are trained, that results in the release of private, confidential, or proprietary information, that
infringes on the intellectual property rights of others, or that is otherwise harmful. In addition, the complexity of many AI models
makes it difficult to understand why they are generating particular outputs. This limited transparency increases the challenges
associated with assessing the proper operation of AI models, understanding and monitoring the capabilities of the AI models,
reducing erroneous output, eliminating bias, and complying with regulations that require documentation or explanation of the
basis on which decisions are made. Further, we may rely on AI models developed by third parties, and, to that extent, would be
dependent in part on the manner in which those third parties develop and train their models, including risks arising from the
inclusion of any unauthorized material in the training data for their models and the effectiveness of the steps these third parties
have taken to limit the risks associated with the output of their models, matters over which we may have limited visibility. Any of
these risks could expose us to liability or adverse legal or regulatory consequences and harm our reputation and the public
perception of our business or the effectiveness of our security measures.
We may not be able to attract and retain skilled people, which may have a negative impact on our business and
operations.
Our success depends, in large part, on our ability to attract and retain key people. Competition for the best people in many
activities engaged in by us is intense, including with respect to compensation and emerging workplace practices and
accommodations, and, as a result, we may not be able to sufficiently hire or to retain key people. We do not currently have
employment agreements or non-competition agreements with any of our senior officers. The unexpected loss of service of key
personnel could have a material adverse impact on our business, financial condition, and results of operations because of their
customer relationships, skills, knowledge of our market, years of industry experience, and the difficulty of promptly finding
qualified replacement personnel. In addition, the scope and content of U.S. banking regulators’ policies on incentive
compensation, as well as changes to these policies, could adversely affect our ability to hire, retain, and motivate our key
associates.
Issues we encounter with respect to external vendors upon which we rely could have a material adverse effect on our
business and, in turn, our financial condition and results of operations.
We rely on certain external vendors to provide products and services necessary to maintain our day-to-day operations. These
third-party vendors are sources of operational, cybersecurity and informational security risk to us, including risks associated with
operational errors, coding errors, information system failures, interruptions or breaches, and unauthorized disclosures of sensitive
or confidential client or customer information. If we encounter any of these issues in connection with our external vendors, or if
we have difficulty communicating with these vendors, we could be exposed to disruption of operations, loss of service, or
connectivity to customers, reputational damage, and litigation risk that could have a material adverse effect on our business and,
in turn, our financial condition and results of operations.
In addition, our operations are exposed to risk that these vendors will not perform in accordance with the contracted arrangements
under service level agreements. Although we have selected these external vendors carefully, we do not control their actions. The
failure of an external vendor to perform in accordance with the contracted arrangements under service level agreements could be
disruptive to our operations, which could have a material adverse effect on our business and, in turn, our financial condition and
results of operations. Replacing these external vendors could also entail significant delay and expense.
35
Severe weather, natural disasters, global climate change, widespread health emergencies (including pandemics), acts of
terrorism and global conflicts may have a negative impact on our business and operations.
Severe weather, natural disasters, global climate change, widespread health emergencies (including pandemics), acts of terrorism,
global conflicts, or other similar events have in the past, and may in the future have, a negative impact on our business and
operations. These events impact us negatively to the extent that they result in reduced capital markets activity, lower asset price
levels, or disruptions in general economic activity in the United States or abroad, or in financial market settlement functions. In
addition, such events could affect the stability of our deposit base, impair the ability of borrowers to repay outstanding loans,
impair the value of collateral securing loans, cause significant property damage, result in loss of revenue, cause us to incur
additional expenses, and impact economic growth negatively. If any of these risks materialized, they could have an adverse effect
on our business and operations and may have other adverse effects on us in ways that we are unable to predict.
Specifically, our market areas in Florida are susceptible to hurricanes, tropical storms and related flooding and wind damage and
other similar weather events. Such weather events can disrupt operations, result in damage to properties and negatively affect the
local economies in the markets where we operate. We cannot predict whether or to what extent damage that may be caused by
future weather events will affect our operations or the economies in our current or future market areas, but such events could
result in a decline in loan originations, a decline in the value or destruction of properties securing our loans and an increase in
delinquencies, foreclosures or loan losses, negatively impacting our business and results of operations. As a result of the potential
for such weather events, many of our customers have incurred significantly higher property and casualty insurance premiums on
their properties located in our markets, which may adversely affect real estate sales and values in our markets.
Litigation may adversely affect our results.
We are subject to litigation in the ordinary course of business. Claims and legal actions, including claims pertaining to our
performance of our fiduciary responsibilities as well as supervisory actions by our regulators, could involve large monetary
claims and significant defense costs. The outcome of litigation and regulatory matters as well as the timing of ultimate resolution
are inherently difficult to predict. Actual legal and other costs of resolving claims may be greater than our legal reserves. The
ultimate resolution of a pending legal proceeding, depending on the remedy sought and granted, could materially adversely affect
our results of operations and financial condition.
In addition, governmental authorities have, at times, sought criminal penalties against companies in the financial services sector
for violations, and, at times, have required an admission of wrongdoing from financial institutions in connection with resolving
such matters. Criminal convictions or admissions of wrongdoing in a settlement with the government can lead to greater exposure
in civil litigation and reputational harm.
Substantial legal liability or significant regulatory action against us could have material adverse financial effects or cause
significant reputational harm, which adversely impact our business prospects. Further, we may be exposed to substantial
uninsured liabilities, which could adversely affect our results of operations and financial condition.
If we fail to maintain an effective system of internal control over financial reporting, we may not be able to accurately
report our financial results, prevent fraud, or file our periodic reports in a timely manner, which may cause investors to
lose confidence in our reported financial information and may lead to a decline in our stock price.
As a public company, we are required to maintain internal control over financial reporting and to report any material weaknesses
in such internal control. Section 404 of the Sarbanes -Oxley Act requires that we furnish a report by management on, among other
things, the effectiveness of our internal control over financial reporting. This assessment requires disclosure of any material
weaknesses identified by our management in our internal control over financial reporting. Our independent registered public
accounting firm also needs to attest to the effectiveness of our internal control over financial reporting. Effective internal control
over financial reporting is necessary for us to provide reliable financial reports and, together with adequate disclosure controls and
procedures, is designed to prevent fraud. Any failure to maintain or implement required new or improved controls (as we had
recently discussed in Item 9A), or difficulties encountered in implementation could cause us to fail to meet our reporting
obligations, which could subject the Company to litigation, investigations, or breach of contract claims, require management
resources, increase costs, negatively affect investor confidence, and adversely impact its stock price.
36
Strategic Risks
Our future success is dependent on our ability to compete effectively in the highly competitive banking and financial
services industry.
We face vigorous competition for deposits, loans and other financial services in our market area from other banks and financial
institutions, including savings and loan associations, savings banks, finance companies and credit unions. A number of our
competitors are significantly larger than we are and have greater access to capital and other resources. Many of our competitors
also have higher lending limits, more expansive branch networks, and offer a wider array of financial products and services.
We also compete with other non-bank providers of financial services, such as money market mutual funds, brokerage firms,
consumer finance companies, insurance companies, governmental organizations, and non-bank financial technology and wealth
technology providers, including digital asset service providers. Many of our non-bank competitors are not subject to the same
extensive regulations that govern our activities. As a result, these non-bank competitors have advantages over us in providing
certain services, including the ability to offer financial products and services on more favorable terms than we are able to offer.
Technology and other changes have lowered barriers to entry and made it possible for non-banks to offer products and services
traditionally provided by banks. In particular, the activity of financial technology companies has grown significantly over recent
years and is expected to continue to grow. The emergence, adoption and evolution of new technologies that do not require
intermediation, including distributed ledgers such as digital assets and blockchain, as well as advances in robotic process
automation, could significantly affect the competition for financial services. Large technology companies offering embedded
financial services, digital wallets, and payment platforms have also increased competitive pressures and may accelerate customer
migration away from traditional banking products. Customer preferences have also shifted toward digital channels and real‑time,
seamless financial experiences. Failure to meet evolving expectations for convenience, speed, and personalized service may
negatively impact our ability to retain and attract customers.
Additionally the recently-enacted GENIUS Act establishes a regulatory framework for “payment stablecoins” and their issuers,
which consumers and businesses may view as a substitute for traditional bank deposits, resulting in deposit withdrawals.
Depending on consumer and business interest in payment stablecoins, and the characteristics and utility of payment stablecoins,
the passage of the GENIUS Act could result in increased competition with respect to our deposit products.
The effect of this competition may reduce or limit our net income, margins or our market share and may adversely affect our
results of operations and financial condition. Further, the process of eliminating banks as intermediaries for financial transactions
could result in the loss of fee income, as well as the loss of customer deposits and the related income generated from those
deposits. The foregoing could have a material adverse effect on our financial condition and results of operations. Increased
competition may negatively affect our earnings by creating pressure to lower prices or credit standards on our products and
services requiring additional investment to improve the quality and delivery of our technology, reducing our market share, or
affecting the willingness of our clients to do business with us.
Our inability to adapt our business strategies, products, and services could harm our business.
We rely on a diversified mix of financial products and services through multiple distribution channels. Our success depends on
our and our third-party providers’ of products and services abilities to adapt our business strategies, products, and services and
their respective features in a timely manner, including available payment processing services and technology to rapidly evolving
industry standards and consumer preferences.
The widespread adoption and rapid evolution of emerging technologies in the financial services industry, including artificial
intelligence, analytic capabilities, cloud technologies, self-service digital trading platforms and automated trading markets,
internet services, and digital assets, such as central bank digital currencies, cryptocurrencies (including stablecoins and
memecoins), tokens, and other cryptoassets that utilize blockchain and distributed ledger technology (DLT), as well as DLT in
payment, clearing, and settlement processes creates additional risks, could negatively impact our ability to compete, and require
substantial expenditures to the extent we were to modify or adapt our existing products and services to keep pace with such new
technologies.
37
We may not be timely or successful in developing or introducing new products and services, integrating new products or services
into our existing offerings, responding, managing, or adapting to changes in consumer behavior, preferences, spending, investing
and saving habits, achieving market acceptance of our products and services, or reducing costs in response to pressures to deliver
products and services at lower prices. There are substantial risks and uncertainties associated with these efforts, particularly in
instances where the markets are not fully developed. In developing and marketing new products and services, we invest
significant time and resources. Initial timetables for the introduction and development of new products or services may not be
achieved, and price and profitability targets may not prove feasible. External factors, such as compliance with regulations,
competitive alternatives, and shifting market preferences, may also impact the successful implementation of new products or
services. Potential future actions such as the proposed consumer credit card interest rate cap may lead to unprofitable products,
especially for riskier borrowers, and could lead to cutting credit lines or eliminating cards, increased reliance on fees and
increased debt burdens for those needing credit most, thereby having the potential to negatively impact bank asset quality. The
Company’s, or its third-party providers’, inability or resistance to timely innovate or adapt its operations, products, and services to
evolving industry standards and consumer preferences could result in service disruptions and harm our business, and materially
and adversely affect our results of operations, financial condition, and reputation.
Furthermore, our implementation of new products, services, or technology could have unintended negative consequences,
including a significant impact on the effectiveness of our system of internal controls. Failure to successfully manage these risks in
the development and implementation of new products or services could have a material adverse effect on our business, financial
condition, and results of operations.
Our directors, executive officers, and principal shareowners, if acting together, have substantial control over all matters
requiring shareowner approval, including changes of control. Because Mr. William G. Smith, Jr. is a principal
shareowner and our Chairman, President, and Chief Executive Officer and Chairman of CCB, he has substantial control
over all matters on a day-to-day basis.
Our directors, executive officers, and principal shareowners beneficially owned approximately 19.3% of the outstanding shares of
our common stock at December 31, 2025. William G. Smith, Jr., our Chairman and Chief Executive Officer beneficially owned
17.3% of our shares as of that date. Accordingly, these directors, executive officers, and principal shareowners, if acting together,
may be able to influence or control matters requiring approval by our shareowners, including the election of directors and the
approval of mergers, acquisitions or other extraordinary transactions. Moreover, because William G. Smith, Jr. is the Chairman
and Chief Executive Officer of CCBG, he has substantial control over all matters on a day-to-day basis, including the nomination
and election of directors.
These directors, executive officers, and principal shareowners may also have interests that differ from yours and may vote in a
way with which you disagree, and which may be adverse to your interests. The concentration of ownership may have the effect of
delaying, preventing or deterring a change of control of our Company, could deprive our shareowners of an opportunity to receive
a premium for their common stock as part of a sale of our Company and might ultimately affect the market price of our common
stock. You may also have difficulty changing management, the composition of the Board of Directors, or the general direction of
our Company.
Our Articles of Incorporation, Bylaws, and certain laws and regulations may prevent or delay transactions you might
favor, including a sale or merger of CCBG.
CCBG is registered with the Federal Reserve as a financial holding company under the Bank Holding Company Act, or BHC Act.
As a result, we are subject to supervisory regulation and examination by the Federal Reserve. The GLBA, the Dodd-Frank Act,
the BHC Act, and other federal laws subject financial holding companies to restrictions on the types of activities in which they
may engage, and to a range of supervisory requirements and activities, including regulatory enforcement actions for violations of
laws and regulations.
Provisions of our Articles of Incorporation, Bylaws, certain laws and regulations and various other factors may make it more
difficult and expensive for companies or persons to acquire control of us without the consent of our Board of Directors. It is
possible, however, that you would want a takeover attempt to succeed because, for example, a potential buyer could offer a
premium over the then prevailing price of our common stock.
For example, our Articles of Incorporation permit our Board of Directors to issue preferred stock without shareowner action. The
ability to issue preferred stock could discourage a company from attempting to obtain control of us by means of a tender offer,
merger, proxy contest or otherwise. We are also subject to certain provisions of the Florida Business Corporation Act and our
Articles of Incorporation that relate to business combinations with interested shareowners. Other provisions in our Articles of
Incorporation or Bylaws that may discourage takeover attempts or make them more difficult include: Supermajority voting
requirements to remove a director from office; Provisions regarding the timing and content of shareowner proposals and
nominations; Supermajority voting requirements to amend Articles of Incorporation unless approval is received by a majority of
“disinterested directors”; Absence of cumulative voting; and Inability for shareowners to take action by written consent.
38
Potential acquisitions and other strategic transactions by us, or our inability to complete acquisitions or strategic
transactions, may have a material adverse effect on our business, financial condition, and results of operations.
We may seek to strategically dispose of assets or acquire other banks, businesses, or branches, which involves various risks,
including, among other things, (i) potential exposure to unknown or contingent liabilities of the target company; (ii) exposure to
potential asset quality issues of the target company; (iii) potential disruption to our business; (iv) potential diversion of our
management’s time and attention; (v) the possible loss of key employees and customers of the target company; (vi) difficulty in
estimating the value of the target company or assets to be sold; and (vii) potential changes in banking or tax laws or regulations
that may affect the target company.
Acquisitions by financial institutions, including us, are subject to approval by a variety of regulatory agencies and, therefore,
dependent on the regulators' views at the time as to, among other things, our capital levels, quality of management, compliance
with laws, and overall condition, in addition to their assessment of a variety of other factors. Regulatory approvals could be
delayed, impeded, restrictively conditioned, or denied due to existing or new regulatory issues we have, or may have, with
regulatory agencies. We may fail to pursue, evaluate or complete strategic and competitively significant acquisition opportunities
as a result of our inability, or perceived or anticipated inability, to obtain regulatory approvals in a timely manner, under
reasonable conditions or at all.
Accordingly, any acquisition, disposition or other strategic transaction may not be successful, may not benefit our business
strategy or may not otherwise result in the intended benefits. It also may take us longer than expected to fully realize the
anticipated benefits and synergies of these transactions, and those benefits and synergies may ultimately be smaller than
anticipated or may not be realized at all, which could adversely affect our business and operating results. Acquisitions typically
involve the payment of a premium over book and market values, and, therefore, some dilution of our tangible book value and net
income per common share may occur in connection with any future transaction. Acquisitions may also result in potential dilution
to existing shareowners of our earnings per share if we issue common stock in connection with the acquisition. Furthermore,
failure to realize the expected revenue increases, cost savings, increases in geographic or product presence, and/or other projected
benefits from an acquisition, as well as the difficulties associated with potential acquisitions or dispositions discussed herein
could have a material adverse effect on our business, financial condition and results of operations.
Reputational Risks
Damage to our reputation could harm our businesses, including our competitive position and business prospects.
Reputation risk, or the risk to our earnings, liquidity, and capital from negative public opinion, is inherent in our business.
Negative public opinion could adversely affect our ability to attract and retain customers, clients, investors and associates and
expose us to adverse legal and regulatory consequences. Negative public opinion could result from our actual or alleged conduct
and can arise from various sources, including (1) officer, director or associate fraud, misconduct, and unethical behavior; (2)
security breaches; (3) litigation or regulatory outcomes; (4) compensation practices; (5) lending practices; (6) branching strategy;
(7) the suitability or reasonableness of recommending particular trading or investment strategies, including the reliability of our
research and models; (8) prohibiting clients from engaging in certain transactions or actions taken to debank certain clients; (h)
associate sales practices; (9) failure to deliver products and services; (10) subpar standards of service and quality expected by our
customers, clients, and the community; (11 ) compliance failures; (12) mergers and acquisitions; (13) the inability to manage
technology change or maintain effective data management; (14) cyber incidents; (15) internal and external fraud (including check
fraud and debit card and credit card fraud); (16) inadequacy of responsiveness to internal controls; (17) unintended disclosure of
personal, proprietary or confidential information; (18) failure (or perceived failure) to identify and manage actual and potential
conflicts of interest; (19) breach of fiduciary obligations; (20) the handling of health emergencies or pandemics, (21) the activities
of our clients, customers, counterparties, and third parties, including vendors; (22) our environmental, social, and governance
practices and disclosures, including practices and disclosures related to climate change; (23) our response (or lack of response) to
social and sustainability concerns; and (24) actions by the financial services industry generally or by certain members or
individuals in the industry.
Reputation risk may be amplified by the speed and reach of social media, which can rapidly
disseminate accurate or inaccurate information and significantly influence public perception before we have time to respond.
Negative coverage, regardless of accuracy, may lead to rapid customer reactions, including deposit withdrawals, heightened
regulatory attention, or community criticism.
Tax Risks
Changes in the Federal, State or Local Tax Laws May Negatively Impact Our Financial Performance and We are Subject
to Examinations and Challenges by Tax Authorities
39
We are subject to federal and applicable state tax laws and regulations. Changes in these tax laws and regulations, some of which
may be retroactive to previous periods, could increase our effective tax rates and, as a result, could negatively affect our current
and future financial performance. Furthermore, tax laws and regulations are often complex and require interpretation. In the
normal course of business, we are routinely subject to examinations and challenges from federal and applicable state tax
authorities regarding the amount of taxes due in connection with investments we have made and the businesses in which we have
engaged. Recently, federal and state taxing authorities have become increasingly been aggressive in challenging tax positions
taken by financial institutions. These tax positions may relate to tax compliance, sales and use, franchise, gross receipts, payroll,
property and income tax issues, including tax base, apportionment and tax credit planning. The challenges made by tax authorities
may result in adjustments to the timing or amount of taxable income or deductions or the allocation of income among tax
jurisdictions. If any such challenges are made and are not resolved in our favor, they could have a material adverse effect on our
business, financial condition and results of operations.
Item 1B.
Unresolved Staff Comments
None.
Item 1C.
Cybersecurity
Our enterprise risk management program is designed to identify, assess, and mitigate risks across various aspects of our
Company, including financial, operational, market, regulatory, technology, legal, and reputational. Cybersecurity is a critical risk
area given the increasing reliance on technology and potential of cyber risk threats.
(“CISO”) reports to the CCB President who provides oversight of the information security program and its activities, along with
our management-level Enterprise Risk Oversight Committee (“ROC”) and our Board of Directors.
Our objective for managing cybersecurity risk is to avoid or minimize the impacts of external threat events or other efforts to
penetrate, disrupt or misuse systems or information. Our cybersecurity risk management program is designed around the National
Institute of Standards and Technology (“NIST”) Cybersecurity Framework, regulatory guidance, and other industry standards,
although we cannot guarantee that we meet all technical specifications, or requirements under NIST. Our CISO and Information
Security Officers (“ISOs”) along with key members of the information security team collaborate with peer banks, industry groups,
and policymakers to discuss cybersecurity trends and issues and identify best practices. Our information security program,
including our cyber risk management policies and procedures and our incident response program, are periodically reviewed by the
CISO with the goal of addressing changing threats and conditions.
The parts of our information security program relating to cybersecurity are built on a multi-layered and integrated defense model
and include the following processes:
◾
Risk-based controls for information systems and information on our networks:
processes designed to identify, assess, and manage cybersecurity risks associated with external service providers and the
services we provide to our clients. We leverage people, processes, and technology as part of our efforts to manage and
maintain cybersecurity controls. We also employ a variety of preventative and detective tools designed to monitor, block,
and provide alerts regarding suspicious activity, as well as to report on suspected advanced persistent threats. We seek to
maintain a risk management infrastructure that implements physical, administrative and technical controls that are
designed, based on risk, to protect our information systems and the information stored on our networks, including personal
information, intellectual property and proprietary information of our Company and our clients.
◾
Incident response program:
We have an incident response program and dedicated teams to respond to cybersecurity
incidents. When a cybersecurity incident occurs, we have cross-functional teams that are responsible for leading the initial
assessment of priority and severity and communicating potentially material cybersecurity incidents to the appropriate
members of management and the Board of Directors.
◾
Training and testing:
We have established processes and systems designed to mitigate cybersecurity risk, including
regular education and training for associates, preparedness simulations and tabletop exercises, and recovery and resilience
tests. We also monitor our email gateways for malicious phishing email campaigns and monitor remote connections.
◾
Internal and external risk assessments:
network architecture using internal experts and
cybersecurity threats. Our internal auditor and other independent external partners will periodically
systems, and controls, including with respect to our information security program, to assess their design and operating
effectiveness and make recommendations to strengthen our risk management processes.
40
Notwithstanding our defensive measures and processes, threats posed by cyberattacks are severe. Our internal systems,
processes, and controls are designed to mitigate loss from cyber-attacks and, while we have experienced cybersecurity incidents
in the past, to date, risks from cybersecurity threats have
the Company, including its business strategy, results of operations or financial condition. Despite the Company’s efforts, there
can be no assurance that its cybersecurity risk management processes and measures described will be fully implemented,
complied with, or effective in protecting its systems and information. The company faces risks from certain cybersecurity threats
that, if realized, are reasonably likely to materially affect its business strategy, results of operations or financial condition.
further discussion of risks from cybersecurity threats, see Item 1A. Risk Factors under the section captioned “Cybersecurity
incidents, including security breaches and failures of our information systems could significantly disrupt our business, result in
the unintended disclosure or misuse of confidential or proprietary information, damage our reputation, increase our costs, and
cause losses.”
Governance
Management’s Role
Our
including cybersecurity risks.
The responsibilities of this department include cybersecurity risk assessment, defense operations,
incident response, vulnerability assessment, threat intelligence, third-party risk management, information governance risk and
compliance and business resilience. The foregoing responsibilities are covered on a day-to-day basis with oversight and guidance
provided by our CISO, the ISOs and key members of the information security team.
The department, as a whole, consists of
information security professionals with varying degrees of education and experience. Associates within the department are
generally subject to professional education and certification requirements. In particular, our CISO has over 15 years of substantial
relevant expertise and formal training in the areas of information security and cybersecurity risk management and also serves on
several advisory boards and committees within the financial sector.
Our CISO regularly
security program to the CCB President.
On a quarterly basis, and as needed, the CISO reports the status of the information
security program, notable threats or incidents, and other developments related to information security and cybersecurity risks to
our ROC.
Board Oversight of Cybersecurity
The Board of Directors oversee cybersecurity risk and the information security program which includes overseeing management’s
actions to identify, assess, mitigate and remediate or prevent material cybersecurity risks. The CISO provides reports to the Board
of Directors annually on the status of the information security program and risks, notable threats and incidents, and other
developments related to cybersecurity of the information security program . An appropriate committee of the Board of Directors
may also receive from the CISO periodic reports on these activities, as well as the status of any incident response and remediation
efforts the Company may undertake.
Item 2. Properties
We are headquartered in Tallahassee, Florida. Our executive office is in the Capital City Bank building located on the corner of
Tennessee and Monroe Streets in downtown Tallahassee. The building is owned by CCB, but is located on land leased under a
long-term agreement.
At December 31, 2025, Capital City Bank had 62 banking offices. Of these locations, we lease the land, buildings, or both at 18
locations and own the land and buildings at the remaining 44. CCHL had 28 loan production offices, 27 of which were leased.
Capital City Strategic Wealth, LLC (“CCSW”) maintained five offices, all of which were leased and subsequently sold with the
divestiture of CCSW in the third quarter of 2025.
Item 3.
Legal Proceedings
We are party to lawsuits and claims arising out of the normal course of business. In management’s opinion, there are no known
pending claims or litigation, the outcome of which would, individually or in the aggregate, have a material effect on our
consolidated results of operations, financial position, or cash flows.
Item 4
.
Mine Safety Disclosure
Not applicable.
41
PART II
Item 5.
Market for the Registrant’s Common Equity, Related Shareowner Matters, and Issuer Purchases of Equity
Securities
Common Stock Market Prices and Dividends
Our common stock trades on the Nasdaq Global Select Market under the symbol “CCBG.” We had a total of 951 shareowners of
record at January 31, 2025.
The following table presents the range of high and low closing sales prices reported on the Nasdaq Global Select Market and cash
dividends declared for each quarter during the past two years.
2025
2024
Fourth
Quarter
Third
Quarter
Second
Quarter
First
Quarter
Fourth
Quarter
Third
Quarter
Second
Quarter
First
Quarter
Common stock price:
High
$
45.63
$
44.69
$
39.82
$
38.27
$
40.86
$
36.67
$
28.58
$
31.34
Low
38.27
38.00
32.38
33.00
33.00
26.72
25.45
26.59
Close
42.57
41.79
39.35
35.96
36.65
35.29
28.44
27.7
Cash dividends per share
0.26
0.26
0.24
0.24
0.23
0.23
0.21
0.21
Florida law and Federal regulations impose restrictions on our ability to pay dividends and limitations on the amount of dividends
that the Bank can pay annually to us. See Item 1. “Capital; Dividends; Sources of Strength” and “Dividends” in the Business
section on page 14 and 16, Item 1A. “Market Risks” in the Risk Factors section on page 23, Item 7. “Liquidity and Capital
Resources – Dividends” – in Management’s Discussion and Analysis of Financial Condition and Operating Results on page 67
and Note 17 in the Notes to Consolidated Financial Statements.
Securities Authorized for Issuance Under Equity Compensation Plans
See the information included under Part III, Item 12, which is incorporated in response to this item by reference, for information
with respect to shares of common stock that are authorized for issuance under the Company's equity compensation plans as of
December 31, 2025.
Issuer Purchase of Equity Securities
In January 2024, our Board of Directors authorized the Capital City Bank Group, Inc. Share Repurchase Program (“the
Program”), effective February 1, 2024, which authorizes the repurchase of up to 750,000 shares of our outstanding common stock
over a five-year period. Repurchases under Program may be made from time to time through open market purchases, privately
negotiated transactions or such other manners as will comply with applicable laws and regulations. The timing and actual number
of shares repurchased will depend on a variety of factors including price, corporate and regulatory requirements, market
conditions and other corporate liquidity requirements and priorities. The Program does not obligate the Company to purchase any
particular number of shares and there is no guarantee as to the exact number of shares that will be repurchased by the Company.
We repurchased (i) 73,349 shares under the Program in 2024 at an average price of $28.03 per share and (ii) 9,101 shares in
January 2024 at an average price of $29.47 per share under a substantially similar repurchase plan that was authorized in 2019
and expired in 2024. There are 676,561 shares remaining for purchase under the Program.
We did not repurchase any shares under the Program in the year ending December 31, 2025.
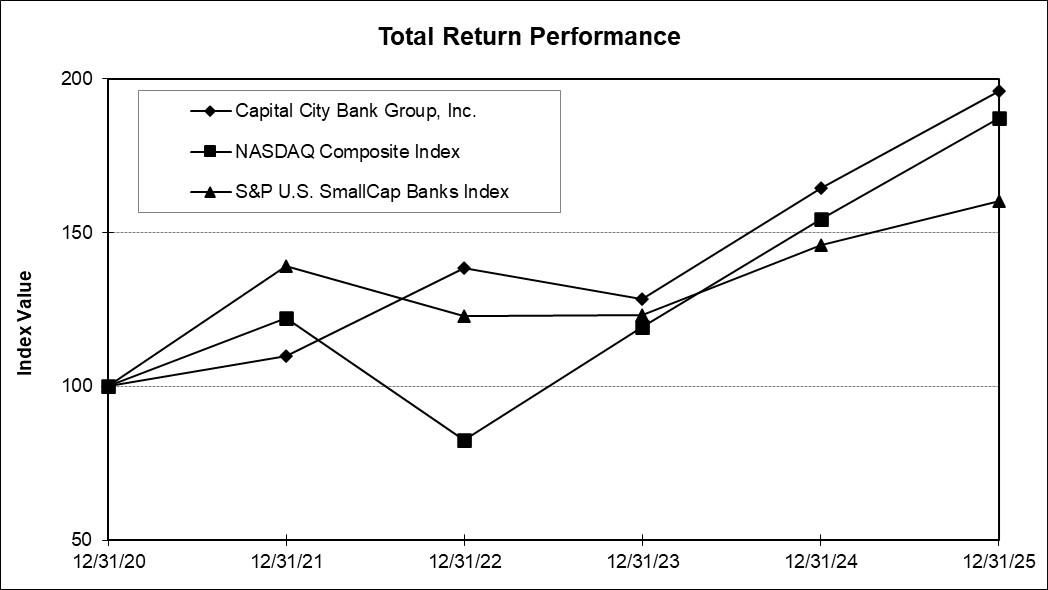
42
Performance Graph
This performance graph compares the cumulative total shareowner return on our common stock with the cumulative total
shareowner return of the Nasdaq Composite Index and the S&P U.S. Small Cap Banks Index for the past five years. The graph
assumes that $100 was invested on December 31, 2020 in our common stock and each of the above indices, and that all dividends
were reinvested. The shareowner return shown below represents past performance and should not be considered indicative of
future performance.
Period Ending
Index
12/31/20
12/31/21
12/31/22
12/31/23
12/31/24
12/31/25
Capital City Bank Group, Inc.
$
100.00
$
110.03
$
138.43
$
128.54
$
164.61
$
196.09
Nasdaq Composite Index
100.00
122.18
82.43
119.22
154.48
187.14
S&P U.S. SmallCap Banks Index
100.00
139.21
122.74
123.35
145.82
160.37
43
Item 6.
Selected Financial Data
(Dollars in Thousands, Except Per Share Data)
2025
2024
2023
Interest Income
$
204,387
$
194,657
$
181,068
Net Interest Income
171,648
158,938
158,988
Provision for Credit Losses
5,264
4,031
9,714
Noninterest Income
82,355
75,976
71,610
Noninterest Expense
(1)
167,022
165,315
157,023
Pre-Tax Loss Attributable to Noncontrolling Interests
(2)
-
1,271
1,437
Net Income Attributable to Common Shareowners
61,557
52,915
52,258
Per Common Share:
Basic Net Income
$
3.61
$
3.12
$
3.08
Diluted Net Income
3.60
3.12
3.07
Cash Dividends Declared
1.00
0.88
0.76
Diluted Book Value
32.23
29.11
25.92
Diluted Tangible Book Value
(3)
27.03
23.65
20.45
Performance Ratios:
Return on Average Assets
1.42
%
1.25
%
1.22
%
Return on Average Equity
11.51
11.18
12.40
Net Interest Margin (FTE)
4.28
4.08
4.05
Noninterest Income as % of Operating Revenues
32.42
32.34
31.05
Efficiency Ratio
65.71
70.30
67.99
Asset Quality:
Allowance for Credit Losses ("ACL")
$
31,001
$
29,251
$
29,941
ACL to Loans Held for Investment ("HFI")
1.22
%
1.10
%
1.10
%
Nonperforming Assets ("NPAs")
10,531
6,669
6,243
NPAs to Total Assets
0.24
0.15
0.15
NPAs to Loans HFI plus OREO
0.41
0.25
0.23
ACL to Non-Performing Loans
360.69
464.14
479.70
Net Charge-Offs to Average Loans HFI
0.14
0.21
0.18
Capital Ratios:
Tier 1 Capital
20.20
%
17.46
%
15.37
%
Total Capital
21.45
18.64
16.57
Common Equity Tier 1 Capital
18.56
15.54
13.52
Tangible Common Equity
(3)
10.79
9.51
8.26
Leverage
11.77
11.05
10.30
Equity to Assets
12.61
11.45
10.24
Dividend Pay-Out
27.70
28.21
24.76
Averages for the Year:
Loans Held for Investment
$
2,622,877
$
2,706,461
$
2,656,394
Earning Assets
4,010,875
3,897,580
3,933,800
Total Assets
4,347,577
4,234,603
4,278,686
Deposits
3,651,351
3,597,438
3,669,612
Shareowners’ Equity
534,962
473,216
421,482
Year -End Balances:
Loans Held for Investment
$
2,546,118
$
2,651,550
$
2,733,918
Earning Assets
4,059,032
3,974,431
3,957,452
Total Assets
4,385,765
4,324,932
4,304,477
Deposits
3,662,312
3,671,977
3,701,822
Shareowners’ Equity
552,851
495,317
440,625
Other Data:
Basic Average Shares Outstanding
17,055,328
16,942,788
16,987,167
Diluted Average Shares Outstanding
17,102,269
16,968,623
17,022,922
Shareowners of Record
(4)
951
1,027
1,080
Banking Locations
(4)
62
63
63
Headcount
(5)
927
940
970
(1)
(2)
(3)
(4)
(5)
44
NON-GAAP FINANCIAL MEASURES
We present a tangible common equity ratio and a tangible book value per diluted share that, in each case, removes the effect of
goodwill that resulted from merger and acquisition activity. We believe these measures are useful to investors because they allow
investors to more easily compare our capital adequacy to other companies in the industry. The generally accepted accounting
principles (“GAAP”) to non-GAAP reconciliation for selected year-to-date financial data is provided below.
Non-GAAP Reconciliation - Selected Financial Data
(Dollars in Thousands, except per share data)
2025
2024
2023
Shareowners' Equity (GAAP)
$
552,851
$
495,317
$
440,625
Less: Goodwill and Other Intangibles (GAAP)
89,095
92,773
92,933
Tangible Shareowners' Equity (non-GAAP)
A
463,756
402,544
347,692
Total Assets (GAAP)
4,385,765
4,324,932
4,304,477
Less: Goodwill and Other Intangibles (GAAP)
89,095
92,773
92,933
Tangible Assets (non-GAAP)
B
$
4,296,670
$
4,232,159
$
4,211,544
Tangible Common Equity Ratio (non-GAAP)
A/B
10.79%
9.51%
8.26%
Actual Diluted Shares Outstanding (GAAP)
C
17,154,586
17,018,122
17,000,758
Tangible Book Value per Diluted Share (non-GAAP)
A/C
27.03
23.65
20.45
45
Item 7.
Management’s Discussion and Analysis of Financial Condition and Results of Operations
Management’s discussion and analysis (“MD&A”) provides supplemental information, which sets forth the major factors that
have affected our financial condition and results of operations and should be read in conjunction with the Consolidated Financial
Statements and related notes included in the Annual Report on Form 10-K. The MD&A is divided into subsections entitled
“Business Overview,” “Executive Overview,” “Results of Operations,” “Financial Condition,” “Liquidity and Capital Resources,”
“Off-Balance Sheet Arrangements,” and “Accounting Policies.” The following information should provide a better understanding
of the major factors and trends that affect our earnings performance and financial condition, and how our performance during
2025 compares with prior years. Throughout this section, Capital City Bank Group, Inc., and its subsidiaries, collectively, are
referred to as “CCBG,” “Company,” “we,” “us,” or “our.”
CAUTION CONCERNING FORWARD -LOOKING STATEMENTS
This Annual Report on Form 10-K, including this MD&A section, contains “forward -looking statements” within the meaning of
the Private Securities Litigation Reform Act of 1995. These forward-looking statements include, among others, statements about
our beliefs, plans, objectives, goals, expectations, estimates and intentions that are subject to significant risks and uncertainties
and are subject to change based on various factors, many of which are beyond our control. The words “may,” “could,” “should,”
“would,” “believe,” “anticipate,” “estimate,” “expect,” “intend,” “plan,” “target,” “vision,” “goal,” and similar expressions are
intended to identify forward-looking statements.
All forward-looking statements, by their nature, are subject to risks and uncertainties. Our actual future results may differ
materially from those set forth in our forward-looking statements. Please see the Introductory Note and
Item 1A Risk Factors
this Annual Report for a discussion of factors that could cause our actual results to differ materially from those in the forward-
looking statements.
However, other factors besides those listed in
Item 1A Risk Factors
our results, and you should not consider any such list of factors to be a complete set of all potential risks or uncertainties. Any
forward-looking statements made by us or on our behalf speak only as of the date they are made. We do not undertake to update
any forward-looking statement, except as required by applicable law.
BUSINESS OVERVIEW
Our Business
We are a financial holding company headquartered in Tallahassee, Florida, and we are the parent of our wholly owned subsidiary,
Capital City Bank (the “Bank” or “CCB”).
We
provide a full range of banking services, including traditional deposit and credit
services, mortgage banking, asset management, trust, merchant services, bankcards, securities brokerage services and financial
advisory services. The Bank has 62 banking offices and 108 ATMs/ITMs in Florida, Georgia and Alabama. Through Capital City
Home Loans, LLC (“CCHL”), we have 28 additional offices in the Southeast for our mortgage banking business. Please see the
section captioned “About Us” beginning on page 5 for more detailed information about our business.
Our profitability, like most financial institutions, is dependent, to a large extent upon net interest income, which is the difference
between the interest and fees received on interest earning assets, such as loans and securities, and the interest paid on interest-
bearing liabilities, principally deposits and borrowings. Results of operations are also affected by the provision for credit losses,
operating expenses such as salaries and employee benefits, occupancy , and other operating expenses including income taxes, and
noninterest income such as mortgage banking revenues, wealth management fees, deposit fees, and bank card fees.
46
Strategic Review
Operating Philosophy
. Our philosophy is to build long-term client relationships based on quality service, high ethical standards,
and safe and sound banking practices. We maintain a locally oriented, community-based focus, which is augmented by
experienced, centralized support in select specialized areas. Our local market orientation is reflected in our network of banking
office locations, experienced community executives with a dedicated President for each market, and community boards which
support our focus on responding to local banking needs. We strive to offer a broad array of sophisticated products and to provide
quality service by empowering associates to make decisions in their local markets.
Strategic Initiatives
. Our strategic plan guides us in the areas of client experience, channel optimization, market expansion, and
culture. As part of the strategic plan, we aim to take our brand of relationship banking to the next level, further deepen
relationships within our communities, expand into new higher growth markets, diversify our revenue sources, invest in new
technology that will support the expansion of client relationships, scale within our lines of business, and drive higher profitability.
We have implemented initiatives in support of the strategic plan, including the implementation of an integrated marketing
software aimed at deepening client relationships, the continuation of our comprehensive review of our banking office network,
and expansion into new markets and further diversification of revenues by expanding our residential mortgage banking and
wealth businesses.
Markets
. We maintain a blend of large and small markets in Florida and Georgia, all in close proximity to major interstate
thoroughfares such as Interstates 10 and 75. Our larger markets include Tallahassee (Leon County, Florida), Gainesville
(Alachua County, Florida), Macon (Bibb County, Georgia), and Suncoast (Hernando/Pasco/Citrus Counties, Florida). The larger
employers in these markets are state and local governments, healthcare providers, educational institutions, and small businesses,
providing stability and good growth dynamics that have historically grown in excess of the national average. We serve an
additional 15 smaller, less competitive, rural markets located on the outskirts of, and centered between, our larger markets where
we are positioned as a market leader. In 7 of 12 markets in Florida and one of three Georgia markets (excluding Northern Arc of
Atlanta markets entered into in 2022 and 2023), we frequently rank within the top three banks in terms of deposit market share.
Furthermore, in the counties in which we operate, we maintain an 8.0% deposit market share in the Florida counties and 5.0% in
the Georgia counties (excluding Northern Arc of Atlanta). Our markets provide for a strong core deposit funding base, a key
differentiator and driver of our profitability and franchise value. These markets also benefit from favorable demographic trends,
including population growth, state government stability, and expanding healthcare and education sectors, which support our long-
term relationship banking strategy and contribute to the resilience of our deposit base.
Recent Acquisition/Expansion Activity
. We expanded into the Northern Arc of Atlanta, Georgia by opening full-service offices in
Marietta (Cobb County) in the fourth quarter of 2022 and Duluth (Gwinnett County) in the second quarter of 2023. Additionally,
we expanded our presence in the Florida Panhandle by opening a full-service office s in Watersound, Florida in the first quarter of
2023, Panama City, Florida (Lynn Haven) in the first quarter of 2024, and Panama City, Florida (West Bay) in the first quarter of
2025. To expand our presence and commitment to our Gainesville market, we opened a third full-service banking office in the
area in early 2023. During 2022 and 2023, we hired leadership and banking teams in the Northern Arc and Walton County office
markets, including commercial bankers, retail delivery support, private banking, wealth advisors, and treasury professionals.
Further, CCHL loan originators reside in the Northern Arc and Walton County offices.
On March 1, 2020, CCB acquired from BMGBMG, LLC (“BMG”) an initial 51% membership interest in CCHL (formerly
known as Brand Mortgage Group, LLC), which became a consolidated entity in the Company’s financial statements. On
November 15, 2024, CCB entered into an agreement with BMG to transfer the 49% Interest to CCB, which closed on January 1,
2025.
EXECUTIVE OVERVIEW
For 2025, net income attributable to common shareowners totaled $61.6 million, or $3.60 per diluted share, compared to net
income of $52.9 million, or $3.12 per diluted share, for 2024, and $52.3 million, or $3.07 per diluted share, for 2023.
For 2025, the increase in net income attributable to common shareowners reflected a $12.7 million increase in net interest income
and a $6.4 million increase in noninterest income, that were partially offset by a $6.2 million increase in income taxes, a $1.7
million increase in noninterest expense, and a $1.2 million increase in provision for credit losses. Net income attributable to
common shareowners included a $1.3 million decrease in the deduction to record the non-controlling interest in the earnings of
CCHL.
For 2024, the increase in net income attributable to common shareowners reflected a $5.7 million decrease in provision for credit
losses and a $4.4 million increase in noninterest income, that were partially offset by a $8.3 million increase in noninterest
expense, a $0.9 million increase in income taxes, and a $0.1 million decrease in net interest income. Net income attributable to
common shareowners included a $0.2 million decrease in the deduction to record the non-controlling interest in the earnings of
CCHL.
47
Below are
Summary Highlights
Income Statement
●
Tax-equivalent net interest income totaled $171.8 million compared to $159.2 million for 2024
-
Net interest margin increased by 20 basis points to 4.28% (increase in earning asset yield of 10 basis points and decrease
in cost of funds of 10 basis points)
●
Credit quality metrics remained strong throughout the year – allowance coverage ratio increased to 1.22% in 2025
compared to 1.10% in 2024 - net loan charge-offs were 14 basis points of average loans for 2025 compared to 21 basis
points for 2024
●
Noninterest income increased by $6.4 million, or 8.4%, due to higher mortgage banking revenues of $2.6 million, wealth
management fees of $1.6 million, other income of $1.5 million, and deposit fees of $0.7 million
●
Noninterest expense increased $1.7 million, or 1.0%, primarily due to higher compensation expense (primarily performance-
based pay and health care cost) partially offset by lower pension expense and higher gains from the sale of banking facilities
Balance Sheet
●
Loan balances decreased by $83.6 million, or 3.1% (average), and decreased by $105.4 million, or 4.0% (end of period)
●
Average deposit balances increased by $53.9 million, or 1.5% driven by strong core deposit growth
●
Tangible book value per diluted share (non-GAAP financial measure) increased by $3.38, or 14.3%
For more detailed information, refer to the following additional sections of the MD&A “Results of Operations” and “Financial
Condition”.
48
RESULTS OF OPERATIONS
A condensed earnings summary for the last three fiscal years is presented in Table 1 below:
Table 1
CONDENSED SUMMARY OF EARNINGS
(Dollars in Thousands, Except Per Share Data)
2025
2024
2023
Interest Income
$
204,387
$
194,657
$
181,068
Taxable Equivalent Adjustments
177
241
367
Total Interest Income (FTE)
204,564
194,898
181,435
Interest Expense
32,739
35,719
22,080
Net Interest Income (FTE)
171,825
159,179
159,355
Provision for Credit Losses
5,264
4,031
9,714
Taxable Equivalent Adjustments
177
241
367
Net Interest Income After Provision for Credit Losses
166,384
154,907
149,274
Noninterest Income
82,355
75,976
71,610
Noninterest Expense
167,022
165,315
157,023
Income Before Income Taxes
81,717
65,568
63,861
Income Tax Expense
20,160
13,924
13,040
Pre-Tax Loss Attributable to Noncontrolling Interests
-
1,271
1,437
Net Income Attributable to Common Shareowners
$
61,557
$
52,915
$
52,258
Basic Net Income Per Share
$
3.61
$
3.12
$
3.08
Diluted Net Income Per Share
$
3.60
$
3.12
$
3.07
Net Interest Income and Margin
Net interest income represents our single largest source of earnings and is equal to interest income and fees generated by earning
assets, less interest expense paid on interest bearing liabilities. We provide an analysis of our net interest income, including
average yields and rates in Tables 2 and 3 below. We provide this information on a “taxable equivalent” basis to reflect the tax-
exempt status of income earned on certain loans and investments.
For 2025, our taxable equivalent net interest income totaled $171.8 million compared to $159.2 million for 2024 and $159.4
million for 2023. The $12.6 million, or 7.9%, increase in 2025 was primarily attributable to an increase in investment securities
income and to a lesser extent an increase in overnight funds income and lower deposit interest expense, partially offset by lower
loan income. The $0.2 million, or 0.1%, decrease in 2024 was driven by higher deposit interest expense that was substantially
offset by higher loan income and to a lesser extent higher overnight funds income. We discuss these variances in more detail
below.
For 2025, our taxable equivalent interest income totaled $204.6 million compared to $194.9 million in 2024 and $181.4 million in
2023. The $9.7 million, or 5.0%, increase in 2025 was primarily attributable to a $10.3 million increase in investment securities
income due to growth in the portfolio and favorable repricing. A $3.7 million decrease in loan income was partially offset by a
$3.1 million increase in overnight funds income. The $13.5 million, or 7.4%, increase in 2024 was primarily attributable to a
$13.0 million increase in loan income driven by loan growth and favorable loan repricing.
For 2025, interest expense totaled $32.7 million compared to $35.7 million for 2024 and $22.1 million for 2023. The $3.0 million
decrease in 2025 was primarily due to decreased deposit interest expense, including a $1.4 million decrease in NOW account
expense and a $1.4 million decrease in money market account expense , partially offset by a $0.2 million increase in certificates of
deposit expense. The decreases for NOW and money market accounts reflected adjustments to our board and managed rates for
these products, as interest rates declined over the year. The $13.6 million increase in 2024 compared to 2023 was primarily
attributable to increased deposit interest expense, including a $6.3 million increase attributable to money market accounts, a $4.5
million increase attributable to NOW accounts, and a $3.7 million increase attributable to certificates of deposit, all reflective of a
shift in balances from noninterest bearing to interest bearing products driven by the higher interest rate environment and clients
seeking higher yield deposit products.
49
Our cost of interest bearing deposits was 127 basis points for 2025, 142 basis points for 2024, and 81 basis points for 2023. Our
total cost of deposits (including noninterest bearing accounts) was 81 basis points for 2025, 89 basis points for 2024, and 48 basis
points for 2023. Our total cost of funds (interest expense/average earning assets) was 82 basis points for 2025, 92 basis points for
2024, and 56 basis points for 2023.
Our net interest margin (defined as taxable-equivalent interest income less interest expense divided by average earning assets)
was 4.28% for 2025, 4.08% for 2024, and 4.05% for 2023. The increase in the net interest margin for 2025 was primarily due to a
higher yield for investment securities driven by new purchases at higher yields, favorable loan repricing, and lower deposit costs.
The increase in the net interest margin for 2024 reflected a combination of earning assets repricing at higher interest rates and an
improved earning asset mix driven by loan growth, partially offset by a higher, but well controlled cost of deposits.
The Federal Open Market Committee decreased the Federal Funds Rate during 2025. The Federal Funds Rate is currently in a
target range of 3.50% to 3.75%, with the Effective Federal Funds Rate at 3.64% at December 31, 2025, and 4.33% at
December 31, 2024. Management actively manages its balance sheet mix and volume and will make loan and deposit product
pricing changes to help mitigate interest rate risk. See section titled “Financial Condition - Market Risk and Interest Rate
Sensitivity” in Management’s Discussion and Analysis of Financial Condition and Results of Operations for additional
information regarding this risk.
50
Table 2
AVERAGE BALANCES AND INTEREST RATES
2025
2024
2023
(Taxable Equivalent Basis - Dollars
in Thousands)
Average
Balance
Interest
Average
Rate
Average
Balance
Interest
Average
Rate
Average
Balance
Interest
Average
Rate
ASSETS
Loans Held for Sale
$
24,234
$
1,764
7.28
%
$
27,306
$
2,776
6.72
%
$
55,510
$
3,232
5.82
%
Loans Held for Investment
(1)(2)
2,622,877
159,589
6.08
2,706,461
162,385
6.03
2,656,394
149,366
5.62
Investment Securities
996,222
27,399
2.75
923,253
17,073
1.85
1,016,550
18,652
1.83
(2)
1,391
61
4.39
848
37
4.34
2,199
59
2.68
Total Investment Securities
997,613
27,460
2.75
924,101
17,110
1.85
1,018,749
18,711
1.83
Fed Funds Sold & Int Bearing Dep
366,151
15,751
4.30
239,712
12,627
5.27
203,147
10,126
4.98
Total Earning Assets
4,010,875
204,564
5.10
%
3,897,580
194,898
5.00
%
3,933,800
181,435
4.61
%
Cash & Due From Banks
67,876
73,881
75,786
Allowance for Credit Losses
(30,443)
(29,902)
(28,190)
Other Assets
299,269
293,044
297,290
TOTAL ASSETS
$
4,347,577
$
4,234,603
$
4,278,686
LIABILITIES
Noninterest Bearing Deposits
$
1,319,336
$
1,336,601
$
1,507,657
NOW Accounts
1,227,316
15,441
1.26
%
1,183,962
16,835
1.42
%
1,172,861
12,375
1.06
%
Money Market Accounts
420,992
8,594
2.04
400,664
9,957
2.49
299,581
3,670
1.22
Savings Accounts
504,951
666
0.13
518,869
723
0.14
592,033
598
0.10
Time Deposits
178,756
4,896
2.74
157,342
4,647
2.95
97,480
939
0.96
Total Interest Bearing Deposits
2,332,015
29,597
1.27
%
2,260,837
32,162
1.42
%
2,161,955
17,582
0.81
%
Total Deposits
3,651,351
29,597
0.81
3,597,438
32,162
0.89
3,669,612
17,582
0.48
Repurchase Agreements
23,728
612
2.58
26,970
838
3.11
19,917
513
2.57
Short-Term Borrowings
12,949
571
4.40
4,882
242
4.94
24,146
1,538
6.37
Subordinated Notes Payable
47,466
1,924
4.00
52,887
2,449
4.56
52,887
2,427
4.53
Other Long-Term Borrowings
736
35
4.74
534
28
5.31
408
20
4.77
Total Interest Bearing Liabilities
2,416,894
32,739
1.35
%
2,346,110
35,719
1.52
%
2,259,313
22,080
0.98
%
Other Liabilities
76,385
71,964
81,842
TOTAL LIABILITIES
3,812,615
3,754,675
3,848,812
Temporary Equity
-
6,712
8,392
TOTAL SHAREOWNERS’
EQUITY
534,962
473,216
421,482
TOTAL LIABILITIES,
TEMPORARY EQUITY AND
SHAREOWNERS’ EQUITY
$
4,347,577
$
4,234,603
$
4,278,686
Interest Rate Spread
3.74
%
3.47
%
3.63
%
Net Interest Income
$
171,825
$
159,179
$
159,355
Net Interest Margin
(3)
4.28
%
4.08
%
4.05
%
(1)
(2)
(3)
51
Table 3
RATE/VOLUME ANALYSIS
(1)
2025 vs. 2024
2024 vs. 2023
(Taxable Equivalent Basis -
Dollars in Thousands)
Increase (Decrease) Due to Change In
Increase (Decrease) Due to Change In
Total
Calendar
(3)
Volume
Rate
Total
Calendar
(3)
Volume
Rate
Earnings Assets:
Loans Held for Sale
(2)
$
(1,012)
(8)
$
(304)
$
(700)
$
(456)
$
9
$
(1,651)
$
1,186
Loans Held for Investment
(2)
(2,796)
(444)
(4,571)
2,219
13,019
409
2,406
10,204
Taxable Investment Securities
10,326
(47)
1,396
8,977
(1,579)
51
(1,763)
133
Tax-Exempt Investment
Securities
(2)
24
-
24
-
(22)
-
(36)
14
Funds Sold
3,124
(35)
6,695
(3,536)
2,501
28
1,795
678
Total
$
9,666
(534)
$
3,240
$
6,960
13,463
$
497
$
751
$
12,215
Interest Bearing Liabilities:
NOW Accounts
$
(1,394)
(46)
$
662
$
(2,010)
4,460
$
34
$
83
$
4,343
Money Market Accounts
(1,363)
(27)
532
(1,868)
6,287
10
1,228
5,049
Savings Accounts
(57)
(2.00)
(17)
(38)
125
2
(76)
199
Time Deposits
249
(13)
645
(383)
3,708
3
574
3,131
Short-Term Borrowings
103
(3)
167
(61)
(971)
6
(574)
(403)
Subordinated Notes Payable
(525)
(7)
(244)
(274)
22
7
(7.00)
22
Other Long-Term Borrowings
7
-
11
(4)
8
-
6
2
Total
$
(2,980)
(98)
$
1,756
$
(4,638)
13,639
$
62
$
1,234
$
12,343
Changes in Net Interest Income
$
12,646
(436)
$
1,484
$
11,598
$
(176)
$
435
$
(483)
$
(128)
(1)
(2)
(3)
Reflects one extra calendar day in 2024.
Provision for Credit Losses
For 2025, we recorded a provision for credit loss expense of $5.3 million ($5.3 million expense for loans held for investment
(“HFI”)) compared to provision expense of $4.0 million for 2024 ($5.0 million expense for loans HFI and $1.0 million benefit for
unfunded loan commitments) and provision expense of $9.7 million for 2023 ($9.5 million expense for loans HFI and $0.2
million expense for unfunded loan commitments). We discuss the various factors that impacted our provision expense for Loans
HFI in further detail below under the heading Allowance for Credit Losses.
52
Noninterest Income
For 2025, noninterest income totaled $82.4 million, a $6.4 million, or 8.4%, increase over 2024, attributable to increases in
mortgage banking revenues of $2.6 million, wealth management fees of $1.6 million, other income of $1.5 million, and deposit
fees of $0.7 million. Higher secondary market production volume and gain on sale margin drove the improvement in mortgage
banking revenues. The increase in wealth management fees was due to higher trust fees and reflected a combination of new
business, higher account valuations, and fee adjustments. The increase in other income reflected the aforementioned $0.7 million
gain from the sale of our insurance subsidiary, CCSW, in 2025. Fee adjustments implemented in mid-2025 contributed to the
increase in deposit fees and other income.
For 2024, noninterest income totaled $76.0 million, a $4.4 million, or 6.1% , increase over 2023, primarily attributable to a $3.9
million increase in mortgage banking revenues and a $2.8 million increase in wealth management fees, partially offset by a $2.2
million decrease in other income. The increase in mortgage banking revenues was due to a higher gain on sale margin. The
increase in wealth management fees was primarily driven by higher retail brokerage fees and to a lesser extent trust fees,
primarily attributable to both new account growth and higher account values driven by higher market returns. The decrease in
other income was primarily attributable to a $1.4 million gain from the sale of mortgage servicing rights in 2023, and to a lesser
extent a decrease in vendor bonus income and miscellaneous income.
Noninterest income as a percentage of total operating revenues (net interest income plus noninterest income) was 32.42% in 2025,
32.34% in 2024, and 31.05% in 2023. The variance in 2024 was primarily attributable to higher mortgage banking revenues and
wealth management fees. The table below reflects the major components of noninterest income.
Table 4
NONINTEREST INCOME
(Dollars in Thousands)
2025
2024
2023
Deposit Fees
$
22,069
$
21,346
$
21,325
Bank Card Fees
14,705
14,707
14,918
Wealth Management Fees
20,667
19,113
16,337
Mortgage Banking Revenues
16,959
14,343
10,400
Other
7,955
6,467
8,630
Total Noninterest Income
$
82,355
$
75,976
$
71,610
Significant components of noninterest income are discussed in more detail below.
Deposit Fees
. For 2025, deposit fees (service charge fees, insufficient fund/overdraft fees, and business account analysis fees)
totaled $22.1 million compared to $21.3 million in 2024 and $21.3 million in 2023. The increase in 2025 was primarily due to
service charge fee adjustments made late in the second quarter of 2025. Deposit fees for 2024 reflected a $0.2 million increase in
commercial account analysis fees that was offset by a $0.2 million decrease in overdraft fees.
Bank Card Fees
. Bank card fees totaled $14.7 million in 2025 compared to $14.7 million in 2024 and $14.9 million in 2023. The
decrease in 2024 was generally due to lower card volume reflective of overall slower consumer spending.
Wealth Management Fees
. Wealth management fees include trust fees through Capital City Trust (i.e., managed accounts and
trusts/estates) and retail brokerage fees through Capital City Investments (i.e., investment, insurance products, and retirement
accounts). In September 2025, we sold our subsidiary, Capital City Strategic Wealth, which provided the sale of life insurance,
risk management and asset protection services, and whose insurance commission and retail brokerage fees were included in
wealth management fees.
Wealth management fees for 2025 totaled $20.7 million compared to $19.1 million in 2024 and $16.3 million in 2023. The
increase in 2025 reflected a $1.4 million increase in trust fees and a $0.2 million increase in retail brokerage fees. The increase in
trust fees reflected new account growth and a fee increase in the first quarter of 2025. The increase in 2024 was attributable to a
$2.1 million increase in retail brokerage fees and a $0.9 million increase in trust fees, which were partially offset by a $0.3 million
decrease in insurance commission revenue. The increase in retail brokerage fees was driven by increased fixed income and
annuity product sales and new account growth, and the increase in trust fees reflected new account growth, higher account values
reflective of improved market returns, and a mid-year fee increase.
Capital City Strategic Wealth insurance commission revenues were $1.1 million for 2025, $1.1 million for 2024 and $1.3 million
for 2023, and retail brokerage fees were $1.3 million, $2.4 million, and $1.0 million for those respective years, and resulted in
nominal impact on consolidated operating profit of $0.2 million, $0.4 million, and ($0.3 million) in each respective year.
53
At December 31, 2025, total assets under management (“AUM”) were approximately $2.867 billion compared to $3.049 billion at
December 31, 2024, and $2.588 billion at December 31, 2023. The slight decline in 2025 was primarily attributable to lower
retail brokerage assets related to the sale of Capital City Strategic Wealth. The increase in AUM in 2024 reflected a combination
of new account growth and higher account values due to improved market returns.
Mortgage Banking Revenues
. Mortgage banking revenues totaled $17.0 million in 2025 compared to $14.3 million in 2024 and
$10.4 million in 2023. The increase in both 2025 and 2024 was attributable to a higher gain on sale margin which reflected a
higher percentage of secondary market/mandatory delivery loan sales. We provide a detailed overview of our mortgage banking
operation, including a detailed break-down of mortgage banking revenues, mortgage servicing activity, and warehouse funding
within Note 4 - Mortgage Banking Activities in the Notes to Consolidated Financial Statements.
Other
. Other noninterest income totaled $8.0 million in 2025 compared to $6.5 million in 2024 and $8.6 million in 2023. The
increase in 2025 was primarily due to a $0.7 million gain from the sale of our insurance subsidiary (Capital City Strategic Wealth)
in the third quarter of 2025 and to a lesser extent higher miscellaneous income , primarily other fees and commissions which
reflected a mid-year fee increase. The decrease in 2024 was attributable to lower miscellaneous income, primarily a $1.4 million
gain from the sale of mortgage servicing rights realized in 2023, and to a lesser extent a decrease in vendor bonus income and
miscellaneous income.
Noninterest Expense
For 2025, noninterest expense totaled $167.0 million compared to $165.3 million for 2024 with the $1.7 million, or 1.0%,
increase primarily due to a $6.5 million increase in compensation expense that was partially offset by a $4.7 million decrease in
other expense. The increase in compensation was driven by higher performance-based pay and health insurance cost, and to a
lesser extent an increase in 401k matching expense. The decrease in other expense was primarily due to a $3.4 million decrease
in other real estate expense due to higher gains from the sale of banking facilities in 2025 and a $3.7 million decrease in pension
expense (non-service component), partially offset by increases in processing expense of $1.2 million (outsource of core
processing system) and charitable contribution expense of $0.9 million. The variance in pension expense included a $1.5 million
pension settlement gain that occurred in the fourth quarter of 2025.
For 2024, noninterest expense totaled $165.3 million, an $8.3 million, or 5.3%, increase over 2023, primarily attributable to
increases in compensation expense of $6.9 million, occupancy expense of $0.3 million, and other expense of $1.1 million. The
increase in compensation reflected a $5.3 million increase in salary expense and a $1.6 million increase in other associate benefit
expense. The increase in salary expense was primarily due to a decrease of $3.1 million in realized loan cost (credit offset to
salary expense - lower new loan volume in 2024), a $2.2 million increase in base salary expense (primarily annual merit raises),
and a $1.2 million increase in cash incentive compensation that were partially offset by a decrease of $1.4 million in commission
expense (lower residential mortgage volume). The unfavorable variance in other associate benefit expense was due to a $0.9
million increase in associate insurance cost and a $0.6 million increase in stock compensation expense. The increase in
occupancy expense was attributable to increases in software license and maintenance agreement expenses. The increase in other
expense was driven by a $1.1 million increase in other real estate expense and a $1.4 million increase in processing expense that
were partially offset by a $1.4 million decrease in miscellaneous expense. The increase in other real estate expense reflected a
lower level of gains from the sale of banking offices in 2024. The increase in processing expense reflected both inflationary
increases on contract renewals and the outsourcing of our core processing system. The decrease in miscellaneous expense was
attributable to lower pension plan expense for the non-service related component of the plan.
Our operating efficiency ratio (expressed as noninterest expense as a percentage of taxable equivalent net interest income plus
noninterest income) was 65.71%, 70.30% and 67.99% in 2025, 2024 and 2023, respectively. The improvement in this metric for
2025 was driven by higher taxable equivalent net interest income (refer to caption headed Net Interest Income and Margin). The
decline in this metric for 2024 was attributable to a higher level of noninterest expense. Expense management is an important
part of our culture and strategic focus. We will continue to review and evaluate opportunities to optimize our delivery operations
and invest in technology that provides favorable returns/scale and/or mitigates risk. The table below reflects the major
components of noninterest expense.
54
Table 5
NONINTEREST EXPENSE
(Dollars in Thousands)
2025
2024
2023
Salaries
$
88,689
$
84,639
$
79,278
Associate Benefits
18,489
16,082
14,509
Total Compensation
107,178
100,721
93,787
Premises
12,694
12,593
13,033
Equipment
15,259
15,389
14,627
Total Occupancy, net
27,953
27,982
27,660
Legal Fees
1,867
1,724
1,721
Professional Fees
5,816
6,311
6,245
Processing Services
9,580
8,411
6,984
Advertising
3,190
3,111
3,349
Travel and Entertainment
1,747
1,795
1,896
Telephone
3,030
2,857
2,729
Insurance – Other
2,990
3,137
3,120
Pension - Other
(3,489)
(1,675)
76
Pension Settlement Gain
(1,552)
-
(291)
Other Real Estate, Net
(4,308)
(868)
(1,969)
Miscellaneous
13,020
11,809
11,716
Total Other Expense
31,891
36,612
35,576
Total Noninterest Expense
$
167,022
$
165,315
$
157,023
Significant components of noninterest expense are discussed in more detail below.
Compensation
. Compensation expense totaled $107.2 million in 2025 compared to $100.7 million in 2024, and $93.8 million in
2023. For 2025, the $6.5 million, or 6.4%, net increase reflected a $4.1 million increase in salary expense and a $2.4 million
increase in associate benefit expense. The increase in salary expense was driven by a $2.6 million increase in incentive plan
expense, a $0.7 million increase in base salary expense, and a $0.6 million increase in 401k matching expense. Improved
company performance drove the increase in incentive plan expense. Annual merit raises drove the increase in base salary
expense. The increase in 401k plan expense was primarily due to the addition of CCHL associates in 2025 to the company’s 401k
plan. The unfavorable variance in associate benefit expense was primarily attributable to a $2.1 million increase in associate
insurance cost due to higher health insurance cost and a $0.4 million increase in stock compensation expense attributable to a
higher incentive pay-out.
For 2024, the $6.9 million, or 7.4%, net increase reflected a $5.3 million increase in salary expense and a $1.6 million increase in
associate benefit expense. The increase in salary expense was primarily due to a $3.1 million decrease in realized loan cost which
is a credit offset to salary expense and reflected lower new loan volume and a $2.2 million increase in base salary expense,
primarily annual merit raises, which were partially offset by a $1.4 million decrease in commission expense driven by lower
residential mortgage volume. The unfavorable variance in other associate benefit expense was due to a $0.9 million increase in
associate insurance cost due to higher health insurance cost and a $0.6 million increase in stock compensation expense
attributable to a higher incentive pay-out.
Occupancy
. Occupancy expense (including premises and equipment) totaled $28.0 million for 2025 compared to $28.0 million
for 2024, and $27.7 million for 2023. For 2025, higher premises rent expense of $0.8 million related to a new banking office
opening in late 2024 was offset by lower expenses for our operations center building that was sold in early 2025, and to a lesser
extent lower building/FF&E insurance cost due to a lower premium in 2025. For 2024, the $0.3 million, or 1.2%, increase was
attributable to an increase in maintenance agreement expense, primarily for security upgrades and addition of interactive teller
machines.
55
Other
. Other noninterest expense totaled $31.9 million in 2025 compared to $36.6 million in 2024 and $35.6 million in 2023.
For 2025, the $4.7 million decrease was primarily due to a $3.4 million decrease in other real estate expense due to higher gains
from the sale of banking facilities in 2025 and a $3.7 million decrease in pension expense (non-service component), partially
offset by increases in processing expense of $1.2 million and charitable contribution expense of $0.9 million. The outsourcing of
our core processing system in mid-2024 drove the increase in processing expense. The variance in pension expense was due to
the aforementioned $1.5 million pension settlement gain in 2025, and strong asset returns in the plan.
For 2024, the $1.0 million variance in other expense was driven by a $1.1 million increase in other real estate expense and a $1.4
million increase in processing expense that were partially offset by a $1.4 million decrease in miscellaneous expense. The
increase in other real estate expense reflected a lower level of gains from the sale of banking offices in 2024. The increase in
processing expense reflected both inflationary increases on contract renewals and the outsourcing of our core processing system.
The decrease in miscellaneous expense was attributable to lower pension plan expense for the non-service related component of
the plan.
Income Taxes
For 2025, we realized income tax expense of $20.2 million (effective rate of 24.7%) compared to $13.9 million (effective rate of
21.2%) for 2024 and $13.0 million (effective rate of 20.4%) for 2023. A lower level of tax benefit accrued from a solar tax credit
equity fund drove the increase in our effective tax rate compared to 2024 and to a lesser extent a higher than projected Internal
Revenue Code (“IRC”) Section 162(m) limitation related to current and future compensation. The increase in our effective tax
rate in 2024 was due to a higher than projected Internal Revenue Code Section 162(m) limitation and lower tax-exempt interest
income.
Absent discrete items or new tax credit investments, we expect our annual effective tax rate to approximate 24% for 2026.
FINANCIAL CONDITION
Average assets totaled approximately $4.348 billion for 2025, an increase of $113.0 million, or 2.7%, over 2024. Average
earning assets were approximately $4.011 billion for 2025, an increase of $113.3 million, or 2.9%, over 2024. Compared to 2024,
the change in earning assets was primarily attributable to a $126.4 million increase in overnight funds sold and a $73.5 million
increase in investment securities that was partially offset by an $83.6 million decrease in loans HFI. We discuss these variances
in more detail below.
Table 2 provides information on average balances and rates, Table 3 provides an analysis of rate and volume variances, and Table
6 highlights the changing mix of our interest earning assets over the last three fiscal years.
Loans
For 2025, average loans HFI decreased $83.6 million or 3.1% compared to an increase of $50.1 million, or 1.9% in 2024.
Compared to 2024, the decrease in loans was primarily driven by a decrease of $39.1 million in consumer loans, primarily
indirect auto loans, a decrease of $27.8 million in construction loans, and a decrease in commercial real estate loans of $26.7
million, partially offset by increases in residential real estate loans of $17.4 million and home equity loans of $16.2 million.
Total loans HFI at December 31, 2025 totaled $2.546 billion, a $105.4 million decrease from December 31, 2024 that was largely
attributable to a decrease in construction loans of $73.1 million, and to a lesser extent decreases in consumer loans (primarily auto
indirect) of $17.2 million, commercial real estate loans of $10.4 million, commercial loans of $8.9 million, and residential real
estate loans of $16.8 million, that were partially offset by a $20.8 million increase in home equity loans.
As part of our overall strategy, we will originate 1-4 family real estate secured adjustable-rate loans and home equity loans
through CCHL, which provides us a larger pool of loan origination opportunities, and in large part drove the aforementioned
growth in average residential real estate and home equity loans in 2025. This loan volume can vary according to the direction of
residential mortgage interest rates.
In 2025, average loans held for sale (“HFS”) decreased $3.1 million, or $11.3% , from 2024. Loans HFI and HFS as a percentage
of average earning assets decreased to 66.0% in 2025 compared to 70.1% in 2024, primarily attributable to a decline in loans HFI.
56
Table 6
SOURCES OF EARNING ASSET GROWTH
2024 to
Percentage
Components of
2025
of Total
Average Earning Assets
(Average Balances – Dollars In Thousands)
Change
Change
2025
2024
2023
Loans:
Loans HFS
$
(3,072)
(2.7)
%
0.6
%
0.7
%
1.4
%
Loans HFI:
Commercial, Financial, and Agricultural
(23,668)
(20.9)
4.5
5.3
5.9
Real Estate – Construction
(27,768)
(24.5)
4.4
5.3
5.8
Real Estate – Commercial Mortgage
(26,665)
(23.5)
19.8
21.0
20.7
Real Estate – Residential
17,372
15.3
26.2
26.3
22.5
Real Estate – Home Equity
16,238
14.3
5.7
5.5
5.2
Consumer
(39,093)
(34.5)
4.9
6.0
7.6
Total HFI Loans
(83,584)
(73.8)
65.5
69.4
67.7
Total Loans HFS and HFI
$
(86,656)
(76.5)
66.1
70.1
69.1
%
Investment Securities:
Taxable
$
72,969
64.4
%
24.8
%
23.7
%
25.8
%
Tax-Exempt
543
0.5
-
-
0.1
Total Securities
$
73,512
64.9
%
24.8
%
23.7
%
25.9
%
Federal Funds Sold and Interest Bearing Deposits
126,439
111.6
9.1
6.2
5.0
Total Earning Assets
$
113,295
100
%
100
%
100
%
100
%
Our average total loans (HFS and HFI)-to-deposit ratio was 72.5% in 2025, 76.0% in 2024, and 73.9% in 2023.
The composition of our HFI loan portfolio at December 31 for each of the past three years is shown in Table 7. Table 8 arrays
our HFI loan portfolio at December 31, 2025, by maturity period. As a percentage of the HFI loan portfolio, loans with fixed
interest rates represented 24.1% at December 31, 2025 compared to 25.3% at December 31, 2024. Higher residential real estate
adjustable-rate loan balances and lower commercial real estate mortgage adjustable-rate loan balances at December 31, 2025
drove the decrease in the percentage.
Table 7
LOANS HFI BY CATEGORY
(Dollars in Thousands)
2025
2024
2023
Commercial, Financial and Agricultural
$
180,341
$
189,208
$
225,190
Real Estate – Construction
146,920
219,994
196,091
Real Estate – Commercial Mortgage
768,731
779,095
825,456
Real Estate – Residential
1,025,690
1,042,504
1,004,219
Real Estate – Home Equity
240,897
220,064
210,920
Consumer
183,539
200,685
272,042
Total Loans HFI, Net of Unearned Income
$
2,546,118
$
2,651,550
$
2,733,918
57
Table 8
LOANS HFI MATURITIES
Maturity Periods
(Dollars in Thousands)
One Year
Over One
Through
Five Years
Through
Fifteen
Years
Over
Fifteen
Years
Total
Commercial, Financial and Agricultural
$
31,786
$
116,764
$
29,568
$
2,223
$
180,341
Real Estate – Construction
76,019
60,399
434
10,068
146,920
Real Estate – Commercial Mortgage
65,819
131,848
291,187
279,877
768,731
Real Estate – Residential
22,493
14,236
119,688
869,273
1,025,690
Real Estate – Home Equity
713
12,237
45,474
182,473
240,897
Consumer
(1)
5,441
117,190
60,627
281
183,539
Total
$
202,271
$
452,674
$
546,978
$
1,344,195
$
2,546,118
Total Loans HFI with Fixed Rates
$
71,315
$
326,393
$
170,097
$
44,745
$
612,550
Total Loans HFI with Floating or Adjustable-Rates
130,956
126,281
376,881
1,299,450
1,933,568
Total
$
202,271
$
452,674
$
546,978
$
1,344,195
$
2,546,118
(1)
Demand loans and overdrafts are reported in the category of one year or less.
Credit Quality
Table 9 provides the components of nonperforming assets and various other credit quality and risk metrics at December 31 for the
last three fiscal years. Information regarding our accounting policies related to nonaccruals, past due loans, and financial
difficulty modifications is provided in Note 3 – Loans Held for Investment and Allowance for Credit Losses.
Nonperforming assets (nonaccrual loans and other real estate) totaled $10.5 million at December 31, 2025, compared to $6.7
million at December 31, 2024. At December 31, 2025, nonperforming assets as a percentage of total assets was 0.24%, compared
to 0.15% at December 31, 2024. Nonaccrual loans totaled $8.6 million at December 31, 2025, a $2.3 million increase over
December 31, 2024. Further, classified loans totaled $14.3 million at December 31, 2025, a $5.6 million decrease from
December 31, 2024.
Table 9
CREDIT QUALITY
(Dollars in Thousands)
2025
2024
2023
Nonaccruing Loans:
Commercial, Financial and Agricultural
$
1,278
$
37
$
311
Real Estate – Construction
-
-
322
Real Estate – Commercial Mortgage
2,560
566
909
Real Estate – Residential
2,143
3,127
2,990
Real Estate – Home Equity
1,769
1,782
999
Consumer
845
790
711
Total Nonaccruing Loans
8,595
6,302
6,242
Other Real Estate Owned
1,936
367
1
Total Nonperforming Assets
$
10,531
$
6,669
$
6,243
Past Due Loans 30 – 89 Days
$
7,017
$
4,311
$
6,855
Classified Loans
$
14,334
$
19,896
$
22,203
Nonaccruing Loans/Loans
0.34
%
0.24
%
0.23
%
Nonperforming Assets/Total Assets
0.24
0.15
0.15
Nonperforming Assets/Loans Plus OREO
0.41
0.25
0.23
Allowance/Nonaccruing Loans
360.69
%
464.14
%
479.70
%
58
Nonaccrual Loans
. Nonaccrual loans totaled $8.6 million at December 31, 2025, a $2.3 million increase over December 31, 2024
with the increase primarily attributable to two home equity loans totaling $1.8 million. Generally, loans are placed on nonaccrual
status if principal or interest payments become 90 days past due or management deems the collectability of the principal and
interest to be doubtful. Once a loan is placed in nonaccrual status, all previously accrued and uncollected interest is reversed
against interest income. Interest income on nonaccrual loans is recognized when the ultimate collectability is no longer
considered doubtful. Loans are returned to accrual status when the principal and interest amounts contractually due are brought
current or when future payments are reasonably assured. If interest on our loans classified as nonaccrual during 2025 had been
recognized on a fully accruing basis, we would have recorded an additional $0.4 million of interest income for the year ended
December 31, 2025.
Other Real Estate Owned
. OREO represents property acquired as the result of borrower defaults on loans or by receiving a deed
in lieu of foreclosure. OREO is recorded at the lower of cost or estimated fair value, less estimated selling costs, at the time of
foreclosure. Write-downs occurring at foreclosure are charged against the allowance for credit losses. On an ongoing basis,
properties are either revalued internally or by a third-party appraiser as required by applicable regulations. Subsequent declines in
value are reflected as other noninterest expense. Carrying costs related to maintaining the OREO properties are expensed as
incurred and are also reflected as other noninterest expense.
OREO totaled $1.9 million at December 31, 2025, versus $0.4 million at December 31, 2024. During 2025, we added properties
totaling $4.4 million and sold properties totaling $2.9 million. For 2024, we added properties totaling $1.0 million and sold
properties totaling $0.6 million.
Modifications to Borrowers Experiencing Financial Difficulty
. Occasionally, we will modify loans to borrowers who are
experiencing financial difficulty. Loan modifications to borrowers in financial difficulty are loans in which we will grant an
economic concession to the borrower that we would not otherwise consider. In these instances, as part of a work-out alternative,
we will make concessions including the extension of the loan term, a principal moratorium, a reduction in the interest rate, or a
combination thereof. A modified loan classification can be removed if the borrower’s financial condition improves such that the
borrower is no longer in financial difficulty, the loan has not had any forgiveness of principal or interest, and the loan is
subsequently refinanced or restructured at market terms and qualifies as a new loan. At December 31, 2025, we maintained four
loans for $3.8 million that we modified due to the borrower experiencing financial difficulty.
Past Due Loans
. A loan is defined as a past due loan when one full payment is past due or a contractual maturity is over 30 days
past due. Past due loans at December 31, 2025 totaled $7.0 million compared to $4.3 million at December 31, 2024. Indirect
auto loans represented a large portion of the past due balances representing 26% and 56%, respectively, of the total dollars past
due at December 31, 2025 and December 31, 2024, respectively.
Potential Problem Loans
. Potential problem loans are defined as those loans which are now current but where management has
doubt as to the borrower’s ability to comply with present loan repayment terms. At December 31, 2025, we had $4.7 million in
loans of this type which were not included in either of the nonaccrual or 90 days past due loan categories compared to $2.8
million at December 31, 2024. Management monitors these loans closely and reviews their performance on a regular basis.
Loan Concentrations
. Loan concentrations exist when there are amounts loaned to multiple borrowers engaged in similar
activities which cause them to be similarly impacted by economic or other conditions and such amount exceeds 10% of our total
loans. Due to the lack of diversified industry within our markets and the relatively close proximity of the markets, we have both
geographic concentrations as well as concentrations in the types of loans funded. Specifically, due to the nature of our markets, a
significant portion of our HFI loan portfolio has historically been secured with real estate, approximately 86% at December 31,
2025 and 85% at December 31, 2024, with the increase driven by lower loan volume in 2025 for commercial and consumer
(indirect auto) loans and a higher volume of 1-4 family residential real estate loans originated in 2025 in comparison to other loan
types. The primary types of real estate collateral are commercial properties and 1-4 family residential properties.
We review our loan portfolio segments and concentration limits on an ongoing basis and will make adjustments as needed to
mitigate/reduce risk to segments that reflect decline or stress.
We
have established an internal lending limit of $10 million for the total aggregate amount of credit that will be extended to a
client and any related entities within our Board approved policies. This compares to our legal lending limit of approximately
$101 million.
59
The following table summarizes our real estate loan category as segregated by the type of property. Property type concentrations
are stated as a percentage of total real estate loans at December 31.
Table 10
REAL ESTATE LOANS BY PROPERTY TYPE
2025
2024
(Dollars in Thousands)
Investor Real
Estate
Owner
Occupied
Investor Real
Estate
Owner
Occupied
Vacant Land, Construction, and Land
Development
$
246,361
11.3
%
-
-
$
317,881
14.1
%
-
-
Improved Property
520,731
23.9
$
1,415,146
64.8
%
542,858
24.2
$
1,386,912
61.7
%
$
767,092
35.2
%
64.8
%
$
860,739
38.3
%
61.7
%
A major portion of our real estate loan segment is centered in the owner occupied category, which carries a lower risk of non-
collection than certain segments of the investor category. The owner occupied category was approximately 65% of total real
estate loans at December 31, 2025 and 62% of total real estate loans at December 31, 2024. Further, investor real estate totaled
35% and 38% of total real estate loans at December 31, 2025 and December 31, 2024, respectively.
The table below further segments the investor real estate category for improved property.
Table 11
REAL ESTATE LOANS IMPROVED PROPERTY
DISTRIBUTION
(Dollars in Thousands)
2025
2024
Hotel/Motel
$
77,527
14.9
%
$
74,400
13.7
%
Gas Station/C-Store
7,716
1.5
7,628
1.4
Industrial/Warehouse
32,292
6.2
30,427
5.6
Multi-Family
49,649
9.5
49,295
9.1
Office
35,127
6.7
45,541
8.4
Retail & Shopping Centers
107,095
20.6
116,402
21.4
Commercial Condos
2,127
0.4
867
0.2
Other
44,663
8.6
32,022
5.9
Total Improved Property
356,196
68.4
356,582
65.7
Non-Owner Occupied 1-4 Residential
$
164,535
31.6
%
$
186,276
34.3
%
Total Investor Real Estate Improved Property
$
520,731
100
%
$
542,858
100
%
Allowance for Credit Losses
The allowance for credit losses is a valuation account that is deducted from the loans’ amortized cost basis to present the net
amount expected to be collected on the loans. The allowance for credit losses is adjusted by a credit loss provision which is
reported in earnings and reduced by the charge-off of loan amounts, net of recoveries. Loans are charged off against the
allowance when management believes the uncollectability of a loan balance is confirmed. Expected recoveries do not exceed the
aggregate of amounts previously charged-off and expected to be charged-off. Expected credit loss inherent in non-cancellable
off-balance sheet credit exposures is provided through the credit loss provision but recorded separately in other liabilities.
Management estimates the allowance balance using relevant available information, from internal and external sources, relating to
past events, current conditions, and reasonable and supportable forecasts. Historical loan default and loss experience provides the
basis for the estimation of expected credit losses. Adjustments to historical loss information incorporate management’s view of
current conditions and forecasts.
Detailed information regarding the methodology for estimating the amount reported in the allowance for credit losses is provided
in Note 1 – Significant Accounting Policies/Allowance for Credit Losses in the Consolidated Financial Statements.
60
Note 3 – Loans Held for Investment and Allowance for Credit Losses in the Consolidated Financial Statements provides the
activity in the allowance and the allocation by loan type for each of the past three fiscal years.
At December 31, 2025, the allowance for credit losses for HFI loans totaled $31.0 million compared to $29.2 million at December
31, 2024 and $29.9 million at December 31, 2023. The $1.8 million increase in the allowance in 2025 reflected a credit loss
provision of $5.3 million and net loan charge-offs of $3.6 million. The $0.7 million decrease in the allowance in 2024 reflected a
credit loss provision of $5.0 million and net loan charge -offs of $5.7 million. The increase in the allowance in 2025 was primarily
attributable to qualitative factor adjustments that were partially offset by lower loan balances. The decrease in the allowance in
2024 was primarily attributable to lower new loan volume and loan balances and favorable loan migration.
For 2025, we realized net loan charge-offs of $3.6 million, or 0.14%, of average HFI loans, compared to net loan charge -offs of
$5.7 million, or 0.21%, for 2024, and net loan charge-offs of $4.7 million, or 0.18%, for 2023. Consumer (indirect auto) net loan
charge-offs represented 66%, 62%, and 76% of total net loan charge-offs for the same respective years. Further, indirect auto net
loan charge-offs represented approximately 1.38% of average indirect auto loans in 2025, 1.68% in 2024, and 1.31% in 2023.
Since 2022, we have reduced our exposure to this loan segment.
At December 31, 2025, the allowance for credit losses represented 1.22% of HFI loans and provided coverage of 361% of
nonperforming loans compared to 1.10% and 464%, respectively, at December 31, 2024 and 1.10% and 480%, respectively, at
December 31, 2023.
Table 12 further segments the allocation of allowance for credit losses at December 31 for each of the last three fiscal years.
Table 12
ALLOCATION OF ALLOWANCE FOR CREDIT LOSSES
2025
2024
2023
(Dollars in Thousands)
ACL
Amount
Percent of
Loans to
Total Loans
ACL
Amount
Percent of
Loans to
Total Loans
ACL
Amount
Percent of
Loans to
Total Loans
Commercial, Financial and Agricultural
$
1,751
7.1
%
$
1,514
7.1
%
$
1,482
8.2
%
Real Estate:
Construction
1,681
5.8
2,384
8.3
2,502
7.2
Commercial
6,859
30.2
5,867
29.4
5,782
30.2
Residential
15,317
40.2
14,568
39.3
15,056
36.7
Home Equity
2,368
9.5
1,952
8.3
1,818
7.7
Consumer
3,025
7.2
2,966
7.6
3,301
10.0
Total
$
31,001
100
%
$
29,251
100
%
$
29,941
100
%
Investment Securities
Our average investment portfolio balance was $998 million in 2025, $924 million in 2024, and $1.019 billion in 2023. As a
percentage of average earning assets, our investment portfolio represented 24.9% in 2025, compared to 23.7% in 2024, and 25.9%
in 2023. Compared to 2024, investment portfolio activity reflected the reinvestment of cash flow from matured securities as well
as growth in the balance due to a higher level of liquidity. For comparison to 2023, the decline in the investment portfolio was
attributable to the allocation of investment cash flows to support loan growth. In 2026, we plan to reinvest cash flow from the
investment portfolio and as appropriate allocate to support loan demand and other liquidity management strategies.
For 2025, average taxable investments increased by $73.0 million, or 7.9%, while tax-exempt investments increased $0.5 million,
or 64.0%. Both taxable and non-taxable bonds increased as part of our overall investment strategy to reinvest cash flows from
investments plus additional funds to grow the portfolio. At December 31, 2025, municipal securities (taxable and non-taxable)
comprised 3% of the portfolio.
61
Our investment portfolio is a significant component of our operations and, as such, it functions as a key element of liquidity and
asset/liability management. Two types of classifications are approved for investment securities which are Available -for-Sale
(“AFS”) and Held-to-Maturity (“HTM”). For 2025 and 2024, we maintained securities under both the AFS and HTM
designations. At December 31, 2025, $643.9 million, or 62.9%, of our investment portfolio was classified as AFS, with $377.4
million, or 36.9%, classified as HTM, and $2.1 million, or 0.2%, classified as equity securities. At December 31, 2024, $403.3
million, or 41.5%, of our investment portfolio was classified as AFS, with $567.2 million, or 58.3%, classified as HTM and $2.4
million, or 0.2%, classified as equity securities.
Table 13 provides the composition of our investment securities portfolio at December 31 for each of the last three fiscal years.
Table 13
INVESTMENT SECURITIES COMPOSITION
2025
2024
2023
(Dollars in Thousands)
Carrying
Amount
Percent
Carrying
Amount
Percent
Carrying
Amount
Percent
Available for Sale
U.S. Government Treasury
$
333,264
32.6
%
$
105,801
10.9
%
$
24,679
2.6
%
U.S. Government Agency
172,114
16.7
143,127
14.8
145,034
15.1
States and Political Subdivisions
34,911
3.4
39,382
4.0
39,083
4.0
Mortgage-Backed Securities
52,004
5.1
55,477
5.7
63,303
6.6
Corporate Debt Securities
43,532
4.3
51,462
5.3
57,552
6.0
Other Securities
8,097
0.8
8,096
0.8
8,251
0.9
Total
643,922
62.9
403,345
41.5
337,902
35.1
Held to Maturity
U.S. Government Treasury
129,782
12.7
368,005
37.8
457,681
47.4
Mortgage-Backed Securities
247,664
24.2
199,150
20.5
167,341
17.3
Total
377,446
36.9
567,155
58.3
625,022
64.7
Other Equity Securities
2,069
0.2
2,399
0.2
3,450
0.2
Total Investment Securities
$
1,023,437
100
%
$
972,899
100
%
$
966,374
100
%
The classification of a security is determined upon acquisition based on how the purchase will affect our asset/liability strategy
and future business plans and opportunities. Classification determinations will also factor in regulatory capital requirements,
volatility in earnings or other comprehensive income, and liquidity needs. Securities in the AFS portfolio are recorded at fair
value with unrealized gains and losses associated with these securities recorded net of tax, in the accumulated other
comprehensive income (loss) component of shareowners’ equity. Securities designated as HTM are those acquired or owned with
the intent of holding them to maturity (final payment date). HTM investments are measured at amortized cost. It is neither
management’s current intent nor practice to participate in the trading of investment securities for the purpose of recognizing gains
and therefore we do not maintain a trading portfolio.
At December 31, 2025, there were 736 positions (combined AFS and HTM) with pre-tax unrealized losses totaling $23.7 million.
The Government National Mortgage Association mortgage-backed securities, U.S. Treasuries, and SBA securities held carry the
full faith and credit guarantee of the U.S. Government and are deemed to be 0% risk-weighted assets. Other mortgage-backed
securities held (Federal National Mortgage Association and Federal Home Loan Mortgage Corporation) are issued by U.S.
Government sponsored entities. Direct obligations of U.S. Government agencies (Federal Farm Credit Bank and Federal Home
Loan Bank of Atlanta) are also owned. We believe the long history of no credit losses on government securities indicates that the
expectation of nonpayment of the amortized cost basis is zero. A large portion of the SBA securities float monthly or quarterly
with the prime rate and are uncapped. The remaining positions owned are municipal and corporate bonds. At December 31,
2025, 42 corporate bond positions had a total allowance for credit loss of $42,000. All of these positions maintain an overall
rating of at least “BBB+”, and all are expected to mature at par.
The average maturity of our investment portfolio at December 31, 2025 was 2.57 years, with a duration of 2.12 compared to 2.54
years and 2.19, respectively, at December 31, 2024. The average life of our investment portfolio increased primarily due to
continued reinvestment of maturities in the portfolio in conjunction with additional purchases of new securities.
62
The weighted average taxable equivalent yield of our investment portfolio at December 31, 2025 was 3.17% versus 2.41% in
2024. This increase in yield reflected a favorable reinvestment rate on securities purchased in 2025. Our bond portfolio contained
no investments in obligations, other than U.S. Governments, of any state, municipality, political subdivision, or any other issuer
that exceeded 10% of our shareowners’ equity at December 31, 2025.
Table 14 and Note 2 in the Notes to Consolidated Financial Statements present a detailed analysis of our investment securities as
to type, maturity, unrealized losses, and yield at December 31.
Table 14
MATURITY DISTRIBUTION OF INVESTMENT SECURITIES
Within 1 year
1 - 5 years
5 - 10 years
After 10 years
Total
(Dollars in
Thousands)
Amount
WAY
(3)
Amount
WAY
(3)
Amount
WAY
(3)
Amount
WAY
(3)
Amount
WAY
(3)
Available for Sale
U.S. Government
Treasury
$
49,706
2.25
%
$
283,558
3.88
%
$
-
-
%
$
-
-
%
$
333,264
3.82
%
U.S. Government
Agency
36,384
0.96
133,531
4.06
2,199
4.57
-
-
172,114
3.41
States and Political
Subdivisions
3,884
1.37
26,449
1.78
4,578
2.14
-
-
34,911
1.78
Mortgage-Backed
Securities
(1)
2
4.79
10,414
1.44
41,588
2.49
-
-
52,004
2.29
Corporate Debt
Securities
12,799
1.51
27,960
1.86
2,774
2.05
-
-
43,532
1.77
Other Securities
(2)
-
-
-
-
-
-
8,097
6.22
8,097
6.22
Total
$
102,775
2.25
%
$
481,912
3.67
%
$
51,139
2.52
%
$
8,097
6.22
%
$
643,922
3.35
%
Held to Maturity
U.S. Government
Treasury
$
129,782
1.79
%
$
-
-
%
$
-
-
%
$
-
-
%
$
129,782
1.79
%
Mortgage-Backed
Securities
(1)
3,583
2.23
204,456
3.26
39,625
4.49
-
-
247,664
3.44
Total
$
133,365
1.80
%
$
204,456
3.26
%
$
39,625
4.49
%
$
-
-
%
$
377,446
2.87
%
Equity Securities
$
-
-
%
$
-
-
%
$
-
-
%
$
2,069
0.92
%
$
2,069
0.92
%
Total Investment
Securities
$
236,140
2.00
%
$
686,368
3.55
%
$
90,764
3.38
%
$
10,166
6.22
%
$
1,023,437
3.17
%
(1)
(2)
(3)
63
Deposits
Average total deposits for 2025 were $3.651 billion compared to $3.597 billion in 2024 with the $53.9 million, or 1.5%, increase
reflective of increases in NOW accounts of $43.3 million, money market accounts of $20.3 million, and certificates of deposit of
$21.4 million, partially offset by decreases in noninterest bearing accounts of $17.3 million and savings accounts of $13.9 million.
The aforementioned increases generally reflected growth in average core deposit balances throughout 2025 and re-mix in
balances due to clients seeking higher yield deposit products.
At December 31, 2025, total deposits were $3.662 billion, a decrease of $9.7 million, or 0.3% from December 31, 2024. The
decrease reflected decreases in noninterest bearing accounts of $54.4 million, money market accounts of $13.5 million, and
savings accounts of $3.3 million, partially offset by increases in NOW accounts of $36.8 million and certificates of deposit of
$24.7 million. Public funds balances totaled $654.7 million at December 31, 2025 and $660.9 million at December 31, 2024.
Although the overnight funds rate was lowered in the second half of 2025 by 75 basis points to a target range of 3.50%-3.75%,
the overall rate environment remains higher than early 2022 when the overnight funds rate was 0.00%-0.25%. As a result in
2025, we continued to see a shift in mix out of noninterest bearing accounts into interest bearing accounts, primarily NOW,
money market, and certificates of deposit accounts. We have several strategies in place to protect core deposits and mitigate
deposit run-off, and we will continue to closely monitor several metrics such as the sensitivity of our clients to our deposit rates,
our overall liquidity position, and competitor rates when pricing deposits. This strategy is consistent with previous rate cycles and
allows us to manage the mix of our deposits as well as the overall client relationship rather than competing solely on rate.
Table 2 provides an analysis of our average deposits, by category, and average rates paid for each of the last three fiscal years.
Table 15 reflects the shift in our deposit mix over the last year and Table 16 provides a maturity distribution of time deposits in
denominations of greater than $250,000 at December 31, 2025. For 2025, noninterest bearing deposits represented 36.1% of total
average deposits. This compares to 37.2% in 2024 and 41.1% in 2023. The declines in 2025 and 2024 reflected slight migration
into higher yielding deposit products.
Table 15
SOURCES OF DEPOSIT GROWTH
2024 to
Percentage
Components of
2025
of Total
Total Deposits
(Average Balances - Dollars in Thousands)
Change
Change
2025
2024
2023
Noninterest Bearing Deposits
$
(17,265)
32.0
%
36.2
%
37.2
%
41.1
%
NOW Accounts
43,354
(80.4)
33.6
32.9
32.0
Money Market Accounts
20,328
(37.7)
11.5
11.1
8.2
Savings Accounts
(13,918)
25.8
13.8
14.4
16.1
Time Deposits
21,414
(39.7)
4.9
4.4
2.6
Total Deposits
$
53,913
100
%
100
%
100
%
100
%
Table 16
MATURITY DISTRIBUTION OF CERTIFICATES OF DEPOSITS GREATER THAN $250,000
2025
(Dollars in Thousands)
of Deposit
Percent
Three months or less
$
18,657
27.2
%
Over three through six months
30,313
44.3
Over six through 12 months
13,969
20.4
Over 12 months
5,537
8.1
Total
$
68,476
100
%
64
Market Risk and Interest Rate Sensitivity
Overview.
Market risk arises from changes in interest rates, exchange rates, commodity prices, and equity prices. We have risk
management policies designed to monitor and limit exposure to market risk and we do not participate in activities that give rise to
significant market risk involving exchange rates, commodity prices, or equity prices. In asset and liability management activities,
our policies are designed to minimize structural interest rate risk.
Interest Rate Risk Management.
Our net income is largely dependent on net interest income. Net interest income is susceptible to
interest rate risk to the degree that interest-bearing liabilities mature or reprice on a different basis than interest-earning
assets. When interest-bearing liabilities mature or reprice more quickly than interest-earning assets in a given period, a significant
increase in market rates of interest could adversely affect net interest income. Similarly, when interest-earning assets mature or
reprice more quickly than interest-bearing liabilities, falling market interest rates could result in a decrease in net interest
income. Net interest income is also affected by changes in the portion of interest-earning assets that are funded by interest-
bearing liabilities rather than by other sources of funds, such as noninterest -bearing deposits and shareowners’ equity.
We have established what we believe to be a comprehensive interest rate risk management policy, which is administered by
management’s Asset Liability Management Committee (“ALCO”). The policy establishes limits of risk, which are quantitative
measures of the percentage change in net interest income (a measure of net interest income at risk) and the fair value of equity
capital (a measure of economic value of equity (“EVE”) at risk) resulting from a hypothetical change in interest rates for
maturities from one day to 30 years. We measure the potential adverse impacts that changing interest rates may have on our
short-term earnings, long-term value, and liquidity by employing simulation analysis through the use of computer modeling.
The Company’s interest rate risk sensitivity simulations apply various behavior models and assumptions to account for customer
tendencies stemming from interest rate risk changes. The key behavior models and assumptions incorporated in the NII and EVE
simulations impact deposit pricing, deposit runoff, time deposit early withdrawal, and prepayments on loans and investments. The
deposit pricing model is one of the most significant of these assumptions and determines to what degree our deposit rates change
when benchmark interest rates change. The deposit runoff model reflects the increased attrition rate observed in noninterest
bearing deposits in higher rate scenarios as customers migrate to interest bearing deposits and/or alternative investments. The time
deposit early withdrawal model incorporates the customer’s ability to early terminate time deposits and reprice higher. The
prepayment models applied to loans and investments reflects the incentive borrowers have to refinance when market rates are low
while conversely slowing down their payments in higher rate environments. Each of the models and assumptions are tailored to
the specific interest rate environment and validated on a regular basis. However, assumptions and models are inherently uncertain
and actual results may differ from those derived in simulation analysis for multiple reasons, which may include actual balance
sheet composition differences, timing, magnitude and frequency of interest rate changes, deviations from projected customer
behavioral assumptions, and changes in market conditions or management strategies.
The statement of financial condition is subject to testing for both parallel and non-parallel upward and downward shifts in interest
rates (assuming no balance sheet growth) to indicate the inherent interest rate risk. We prepare a base case (assumes a static rate
environment) and several alternative interest rate simulations for various ranges of upward and downward interest rate changes.
This analysis is prepared quarterly and reported to ALCO, our Market Risk Oversight Committee (“MROC”), our Risk Oversight
Committee (“ROC”) and the Board of Directors. We will periodically augment our interest rate simulations with alternative
interest rate scenarios that may include various non-parallel shifts in interest rates, including a flattening or steepening of the yield
curve.
Our goal is to structure the statement of financial condition so that net interest earnings at risk over 12-month and 24-month
periods and the economic value of equity at risk do not exceed policy guidelines at the various interest rate shock levels. We
attempt to achieve this goal by balancing, within policy limits, the volume of floating-rate liabilities with a similar volume of
floating-rate assets, by keeping the average maturity of fixed-rate asset and liability contracts reasonably matched, by managing
the mix of our core deposits, and by adjusting our rates to market conditions on a continuing basis.
Analysis.
Measures of net interest income at risk produced by simulation analysis are indicators of an institution’s short-term
performance in alternative rate environments. These measures are typically based upon a relatively brief period, and do not
necessarily indicate the long-term prospects or economic value of the institution. The following table presents our net interest
income simulation results for gradual 12-month and 24-month “ramp” scenarios applied to base scenario. The “ramp” scenario is
a parallel shift applied gradually over a 12-month period for the projected 12-month and 24-month period on a pro rata basis.
65
Table 17
ESTIMATED CHANGES IN NET INTEREST INCOME
% Change in NII
Policy Limit
Change in Interest Rates
12 Months
24 Months
12 Months
24 Months
+200 bp Ramp
5.3
%
18.5
%
-10.0
%
-12.5
%
+100 bp Ramp
2.0
%
10.8
%
-7.5
%
-10.0
%
-100 bp Ramp
-2.7
%
-4.9
%
-7.5
%
-10.0
%
-200 bp Ramp
-5.5
%
-13.3
%
-10.0
%
-12.5
%
Net Interest Income at risk is within our prescribed policy limits over both the 12-month and 24-month periods for all rate
scenarios with the exception of the down 200 bps scenario primarily due to our limited ability to lower our deposit rates relative
to the decline in market rates for that scenario. Given that our average nonmaturity deposit rate is less than 1.00%, this down 200
bps scenario is more impactful to asset yields than deposit rates.
The measures of equity value at risk indicate our ongoing economic value by considering the effects of changes in interest rates
on all of our cash flows by discounting the cash flows to estimate the present value of assets and liabilities. The difference
between these discounted values of the assets and liabilities is the economic value of equity, which in theory approximates the fair
value of our net assets. The following table presents our equity value at risk simulation applied to immediate parallel shock
scenarios.
Table 18
ESTIMATED CHANGES IN ECONOMIC VALUE OF EQUITY
2025
2024
Changes in Interest Rates
% Change in
EVE
Policy Limit
% Change in
EVE
Policy Limit
EVE Ratio
Policy
Minimum
+200 bp Shock
-21.0
%
-20.0
%
-23.7
%
-20.0
%
17.1
%
5.0
%
+100 bp Shock
-9.7
%
-15.0
%
-17.2
%
-15.0
%
19.8
%
5.0
%
-100 bp Shock
7.0
%
-15.0
%
9.0
%
-15.0
%
24.2
%
5.0
%
-200 bp Shock
10.4
%
-20.0
%
17.0
%
-20.0
%
25.4
%
5.0
%
At December 31, 2025, the economic value of equity was favorable in all rising rate scenarios and unfavorable in the falling rate
scenarios. EVE was within prescribed tolerance levels as the EVE ratio (EVE/EVA) in all rate scenarios is greater than 5.0%.
Factors that can impact EVE values include the absolute level of rates, the overall structure of the balance sheet (including
liquidity levels), pre-payment speeds, loan floors, and the change of model assumptions.
As the interest rate environment and the dynamics of the economy continue to change, additional simulations will be analyzed to
address not only the changing rate environment, but also the changing statement of financial condition mix, measured over
multiple years, to help assess the risk to the Company.
LIQUIDITY AND CAPITAL RESOURCES
Liquidity
In general terms, liquidity is a measurement of our ability to meet our cash needs. Our objective in managing our liquidity is to
maintain our ability to fund loan commitments, purchase securities, accommodate deposit withdrawals or repay other liabilities in
accordance with their terms, without an adverse impact on our current or future earnings. Our liquidity strategy is guided by
policies that are formulated and monitored by our ALCO and senior management, and take into account the marketability of
assets, the sources and stability of funding and the level of unfunded commitments. We regularly evaluate all of our various
funding sources with an emphasis on accessibility, stability, reliability, and cost-effectiveness. For 2025 and 2024, our principal
source of funding was client deposits, supplemented by our short-term and long-term borrowings, primarily from our trust-
preferred securities, securities sold under repurchase agreements, federal funds purchased, and FHLB borrowings. We believe
that the cash generated from operations, our borrowing capacity and our access to capital resources are sufficient to meet our
future operating capital and funding requirements.
66
At December 31, 2025, we had the ability to generate approximately $1.523 billion (excludes overnight funds position of $467.8
million) in additional liquidity through various sources, including various Federal Home Loan Bank borrowings, the Federal
Reserve Discount Window, federal funds purchased lines, and brokered deposits. We recognize the importance of maintaining
liquidity and have developed a Contingent Liquidity Plan, which addresses various liquidity stress levels and our response and
action based on the level of severity. We periodically test our credit facilities for access to the funds but also understand that as
the severity of the liquidity level increases certain credit facilities may no longer be available. We conduct quarterly liquidity
stress tests, and the results are reported to ALCO, MROC, ROC and the Board of Directors. We believe the liquidity available to
us is sufficient to meet our ongoing needs.
We also view our investment portfolio as a liquidity source and have the option to pledge securities in our portfolio as collateral
for borrowings or deposits, and/or to sell selected securities. Our portfolio consists of debt issued by the U.S. Treasury, U.S.
governmental agencies, municipal governments, and corporate entities. At December 31, 2025, the weighted-average maturity
and duration of our portfolio were 2.57 years and 2.12, respectively, and the AFS portfolio had a net unrealized tax-effected loss
of $9.5 million.
Our average net overnight funds sold position (defined as funds sold plus interest-bearing deposits with other banks less funds
purchased) was $366.2 million in 2025 compared to an average net overnight funds sold position of $239.7 million in 2024. The
increase was primarily attributable to deposit growth and a decline in our average loan balances, partially offset by growth in the
investment portfolio.
We expect capital expenditures over the next 12 months to be approximately $10.0 million, which will consist primarily of
technology purchases for banking offices, office leasehold improvements, business applications, and information technology
security needs as well as furniture and fixtures and banking office remodels. We expect that these capital expenditures will be
funded with existing resources without impairing our ability to meet our ongoing obligations.
Borrowings
Average short -term borrowings totaled $36.7 million in 2025 compared to $31.9 million in 2024 with the $4.8 million increase
primarily attributable to a higher level of warehouse line of credit borrowing s to support loans held for sale. Additional detail on
these warehouse borrowings is provided in Note 4 – Mortgage Banking Activities in the Consolidated Financial Statements.
At December 31, 2025, there were no outstanding advances from the FHLB. One advance totaling $0.1 million comprised of one
note was paid off in the third quarter of 2025. FHLB advances are collateralized by a floating lien on certain 1-4 family
residential mortgage loans, commercial real estate mortgage loans, and home equity mortgage loans.
We have issued two junior subordinated deferrable interest notes to wholly owned Delaware statutory trusts. The first note for
$30.9 million was issued to CCBG Capital Trust I in November 2004, of which $10 million was retired in April 2016 and an
additional $5.1 million of principal payments were made in 2025. The second note for $32.0 million was issued to CCBG Capital
Trust II in May 2005, of which $5.1 million of principal payments were made in 2025. The interest payment for the CCBG
Capital Trust I borrowing is due quarterly and adjusts quarterly to a variable rate of three-month CME Term SOFR (secured
overnight financing rate) plus a margin of 1.90%. This note matures on December 31, 2034. The interest payment for the CCBG
Capital Trust II borrowing is due quarterly and adjusts quarterly to a variable interest rate based on three-month CME Term
SOFR plus a margin of 1.80%. This note matures on June 15, 2035. The proceeds from these borrowings were used to partially
fund acquisitions. Under the terms of each junior subordinated deferrable interest note, in the event of default or if we elect to
defer interest on the note, we may not, with certain exceptions, declare or pay dividends or make distributions on our capital stock
or purchase or acquire any of our capital stock. In the second quarter of 2020, we entered into a ten-year derivative cash flow
hedge of our interest rate risk related to our subordinated debt. The notional amount of the derivative is $30 million ($10 million
of the CCBG Capital Trust I borrowing and $20 million of the CCBG Capital Trust II borrowing). In October 2025, the interest
rate swaps were terminated. Additional detail on the interest rate swap agreement is provided in Note 5 – Derivatives in the
Consolidated Financial Statements.
See Note 11 – Short Term Borrowings and Note 12 – Long Term Borrowings in the Notes to Consolidated Financial Statements
for additional information on borrowings.
In the ordinary course of business, we have entered into contractual obligations and have made other commitments to make future
payments. Refer to the accompanying notes to consolidated financial statements elsewhere in this report for the expected timing
of such payments as of December 31, 2025. These include payments related to (i) long-term borrowings (Note 12 – Long-Term
Borrowings), (ii) short-term borrowings (Note 11 – Short-Term Borrowings), (iii) operating leases (Note 7 – Leases), (iv) time
deposits with stated maturities (Note 10 – Deposits), and (v) commitments to extend credit and standby letters of credit (Note 21 –
Commitments and Contingencies).
67
Capital Resources
Shareowners’ equity was $552.9 million at December 31, 2025, compared to $495.3 million at December 31, 2024. For 2025,
shareowners’ equity was positively impacted by net income attributable to shareowners of $61.6 million, a net $9.1 million
decrease in the accumulated other comprehensive loss, the issuance of common stock of $3.5 million, and stock compensation
accretion of $2.4 million. The net favorable change in accumulated other comprehensive loss reflected a $10.7 million decrease in
the investment securities loss that was partially offset by a $1.3 million decrease in the fair value of the interest rate swap related
to subordinated debt and a $0.3 million decrease in the pension plan loss from the year-end re-measurement of the plan.
Shareowners’ equity was reduced by common stock dividends of $17.1 million ($1.00 per share) and net adjustments totaling
$1.9 million related to transactions under our stock compensation plans.
Additional historical information on capital changes is provided in the Consolidated Statements of Changes in Shareowners’
Equity in the Consolidated Financial Statements.
We continue to maintain a strong capital position. The ratio of shareowners' equity to total assets at December 31, 2025 was
12.61% compared to 11.45% at December 31, 2024. Further, our tangible common equity ratio was 10.79% (non-GAAP
financial measure) at December 31, 2025 compared to 9.51% at December 31, 2024. If our unrealized HTM securities losses of
$6.0 million (after-tax) were recognized in accumulated other comprehensive loss, our adjusted tangible capital ratio would be
10.65%. The improvement in the ratios in 2025 was primarily attributable to strong earnings and a decrease in the unrealized loss
on AFS securities which is recognized in accumulated other comprehensive loss.
We are subject to regulatory risk-based capital requirements that measure capital relative to risk-weighted assets and off-balance
sheet financial instruments. At December 31, 2025, our total risk-based capital ratio was 21.45% compared to 18.64% at
December 31, 2024. Our common equity tier 1 capital ratio was 18.56% and 15.54%, respectively, on these dates. Our leverage
ratio was 11.77% and 11.05%, respectively, on these dates. For a detailed discussion of our regulatory capital requirements, refer
to the “Regulatory Considerations – Capital Regulations” section on page 14. See Note 17 in the Notes to Consolidated Financial
Statements for additional information as to our capital adequacy.
At December 31, 2025, our common stock had a book value of $32.23 per diluted share compared to $29.11 at December 31,
2024. Book value is impacted by the net unrealized gains and losses on investment securities. At December 31, 2025, the net
unrealized loss was $9.5 million compared to an unrealized loss of $20.2 million at December 31, 2024. Book value is also
impacted by the recording of our unfunded pension liability through other comprehensive income in accordance with Accounting
Standards Codification Topic 715. At December 31, 2025, the net pension asset reflected in accumulated other comprehensive
loss was $9.4 million compared to $9.7 million at December 31, 2024.
In January 2024, our Board of Directors authorized the Capital City Bank Group, Inc. Share Repurchase Program (“the
Program”), effective February 1, 2024, which authorizes the repurchase of up to 750,000 shares of our outstanding common stock
over a five-year period. Under the Program, shares may be repurchased by the Company from time to time in the open market or
in privately negotiated transactions, as market conditions warrant; however, the Program does not obligate the Company to
repurchase any specified number of shares. We did not repurchase any shares in 2025. We repurchased (i) 73,349 shares under
the Program in 2024 at an average price of $28.03 per share and (ii) 9,101 shares in January 2024 at an average price of $29.47
per share under a substantially similar repurchase plan that was authorized in 2019 and expired in 2024. There are 676,561 shares
remaining for purchase under the Program.
Dividends
Adequate capital and financial strength are paramount to our stability and the stability of CCB. Cash dividends declared and paid
should not place unnecessary strain on our capital levels. When determining the level of dividends, the following factors are
considered:
●
Compliance with state and federal laws and regulations;
●
Our capital position and our ability to meet our financial obligations;
●
Projected earnings and asset levels; and
●
The ability of the Bank and us to fund dividends.
OFF-BALANCE SHEET ARRANGEMENTS
We are a party to financial instruments with off-balance sheet risks in the normal course of business to meet the financing needs
of our clients. See Note 21 in the Notes to Consolidated Financial Statements.
68
If commitments arising from these financial instruments continue to require funding at historical levels, management does not
anticipate that such funding will adversely impact our ability to meet on-going obligations. In the event these commitments
require funding in excess of historical levels, management believes current liquidity, investment security maturities, available
advances from the FHLB and Federal Reserve Bank, and warehouse lines of credit provide a sufficient source of funds to meet
these commitments.
In conjunction with the sale and securitization of loans held for sale and their related servicing rights, we may be exposed to
liability resulting from recourse, repurchase, and make-whole agreements. If it is determined subsequent to our sale of a loan or
its related servicing rights that a breach of the representations or warranties made in the applicable sale agreement has occurred,
which may include guarantees that prepayments will not occur within a specified and customary time frame, we may have an
obligation to either (a) repurchase the loan for the unpaid principal balance, accrued interest, and related advances; (b) indemnify
the purchaser against any loss it suffers; or (c) make the purchaser whole for the economic benefits of the loan and its related
servicing rights. Although such claims can vary with market condition, they have historically been limited.
Our repurchase, indemnification and make-whole obligations vary based upon the terms of the applicable agreements, the nature
of the asserted breach, and the status of the mortgage loan at the time a claim is made. We establish reserves for estimated losses
of this nature inherent in the origination of mortgage loans by estimating the losses inherent in the population of all loans sold
based on trends in claims and actual loss severities experienced. The reserve will include accruals for probable contingent losses
in addition to those identified in the pipeline of claims received. The estimation process is designed to include amounts based on
actual losses experienced from actual activity.
ACCOUNTING POLICIES
Critical Accounting Policies and Estimates
The consolidated financial statements and accompanying Notes to Consolidated Financial Statements are prepared in accordance
with accounting principles generally accepted in the United States of America, which require us to make various estimates and
assumptions (see Note 1 in the Notes to Consolidated Financial Statements). We believe that, of our significant accounting
policies, the following may involve a higher degree of judgment and complexity.
Allowance for Credit Losses
. The amount of the allowance for credit losses represents managemen t’s best estimate of current
expected credit losses considering available information, from internal and external sources, relevant to assessing exposure to
credit loss over the contractual term of the instrument. Relevant available information includes historical credit loss experience,
current conditions, and reasonable and supportable forecasts. While historical credit loss experience provides the basis for the
estimation of expected credit losses, adjustments to historical loss information may be made for changes in loan risk grades, loss
experience trends, loan prepayment trends, differences in current portfolio-specific risk characteristics, environmental conditions,
future expectations, or other relevant factors. While management utilizes its best judgment and information available, the
ultimate adequacy of our allowance accounts is dependent upon a variety of factors beyond our control, including the
performance of our portfolios, the economy, changes in interest rates, and the view of the regulatory authorities toward
classification of assets. Detailed information on the Allowance for Credit Losses valuation, and the assumptions used are provided
in Note 1 – Significant Accounting Policies of the Notes to Consolidated Financial Statements.
Goodwill
. Goodwill represents the excess of the cost of acquired businesses over the fair value of their identifiable net
assets. We perform an impairment review on an annual basis or more frequently if events or changes in circumstances indicate
that the carrying value may not be recoverable. Adverse changes in the economic environment, declining operations, or other
factors could result in a decline in the estimated implied fair value of goodwill. If the estimated implied fair value of goodwill is
less than the carrying amount, a loss would be recognized to reduce the carrying amount to the estimated implied fair value.
We evaluate goodwill for impairment on an annual basis. Accounting Standards Update 2017-04, Intangibles – Goodwill and
Other (Topic 350): Simplifying Accounting for Goodwill Impairment allows for a qualitative assessment of goodwill impairment
indicators. If the assessment indicates that impairment has more than likely occurred, the Company must compare the estimated
fair value of the reporting unit to its carrying amount. If the carrying amount of the reporting unit exceeds its estimated fair value,
an impairment charge is recorded equal to the excess.
During the fourth quarter of 2025, we performed our annual impairment testing. We proceeded with qualitative assessment by
evaluating impairment indicators and concluded there were none that indicated that goodwill impairment had occurred.
69
Pension Assumptions
.
We have a defined benefit pension plan for the benefit of a portion of our associates. On December 30,
2019, the plan was amended to remove plan eligibility for new associates hired after December 31, 2019. Our funding policy
with respect to the pension plan is to contribute, at a minimum, amounts sufficient to meet minimum funding requirements as set
by law. Pension expense is determined by an external actuarial valuation based on assumptions that are evaluated annually as of
December 31, the measurement date for the pension obligation. The service cost component of pension expense is reflected as
“Compensation Expense” in the Consolidated Statements of Income. All other components of pension expense are reflected as
“Other Expense”.
The Consolidated Statements of Financial Condition reflect an accrued pension benefit cost due to funding levels and
unrecognized actuarial amounts. The most significant assumptions used in calculating the pension obligation are the weighted-
average discount rate used to determine the present value of the pension obligation, the weighted-average expected long-term rate
of return on plan assets, and the assumed rate of annual compensation increases. These assumptions are re-evaluated annually
with the external actuaries, taking into consideration both current market conditions and anticipated long-term market conditions.
The discount rate is determined by matching the anticipated defined pension plan cash flows to the spot rates of a corporate AA-
rated bond index/yield curve and solving for the single equivalent discount rate which would produce the same present value.
This methodology is applied consistently from year to year. The discount rate utilized in 2025 was 5.82%. The estimated impact
to 2025 pension expense of a 25 basis point increase or decrease in the discount rate would have been an approximate $0.5
million decrease or increase, respectively. We anticipate using a 5.67% discount rate in 2026.
Based on the balances at the December 31, 2025 measurement date, the estimated impact on accumulated other comprehensive
loss of a 25 basis point increase or decrease in the discount rate would have been a decrease or increase of approximately $3.2
million (after-tax). The estimated impact on accumulated other comprehensive loss of a 1% favorable/unfavorable variance in the
actual rate of return on plan assets versus the assumed rate of return on plan assets of 6.75% would have been an approximate
$1.0 million (after-tax) decrease/increase, respectively.
The weighted-average expected long-term rate of return on plan assets is determined based on the current and anticipated future
mix of assets in the plan. The assets currently consist of equity securities, U.S. Government and Government agency debt
securities, and other securities (typically temporary liquid funds awaiting investment). The weighted-average expected long-term
rate of return on plan assets utilized for 2025 was 6.75%. The estimated impact to 2024 pension expense of a 25 basis point
increase or decrease in the rate of return would have been an approximate $0.2 million decrease or increase, respectively. We
anticipate using a rate of return on plan assets of 6.50% for 2026.
The assumed rate of annual compensation increases of 4.67% for 2025 was based on an experience study performed for the plan
in 2022. It is anticipated that this compensation increase assumption may change based on updates to the actual plan participants
remaining in the plan at the end of each plan year.
Detailed information on the pension plan, the actuarially determined disclosures, and the assumptions used are provided in Note
15 of the Notes to Consolidated Financial Statements.
Income Taxes
.
Income tax expense is the total of the current year income tax due or refundable and the change in deferred tax
assets and liabilities. Deferred tax assets and liabilities are the expected future tax amounts for the temporary differences between
carrying amounts and tax bases of assets and liabilities, computed using enacted tax rates. A valuation allowance, if needed,
reduces deferred tax assets to the amount expected to be realized.
A tax position is recognized as a benefit only if it is “more likely than not” that the tax position would be sustained in a tax
examination, with a tax examination being presumed to occur. The amount recognized is the largest amount of tax benefit that is
greater than 50% likely of being realized on examination. For tax positions not meeting the “more likely than not” test, no tax
benefit is recorded.
We
recognize interest and/or penalties related to income tax matters in other expenses.
ITEM 7A.
QUANTITATIVE AND QUALITATIVE DISCLOSURE ABOUT MARKET RISK
See “Financial Condition - Market Risk and Interest Rate Sensitivity” in Management’s Discussion and Analysis of Financial
Condition and Results of Operations, above, which is incorporated herein by reference.
70
Item 8.
Financial Statements and Supplementary Data
2025 Report of Independent Registered Public Accounting Firm (PCAOB ID
)
CAPITAL CITY BANK GROUP, INC.
CONSOLIDATED FINANCIAL STATEMENTS
PAGE
71
Report of Independent Registered Public Accounting Firm
73
Consolidated Statements of Financial Condition
74
Consolidated Statements of Income
75
Consolidated Statements of Comprehensive Income
76
Consolidated Statements of Changes in Shareowners’ Equity
77
Consolidated Statements of Cash Flows
79
Notes to Consolidated Financial Statements
71
Report of Independent Registered Public Accounting Firm
Shareowners, Board of Directors, and Audit Committee
Capital City Bank Group, Inc.
Tallahassee, Florida
Opinion on the Consolidated Financial Statements
We have audited the accompanying consolidated statements of financial condition of Capital City Bank Group, Inc. (Company) as
of December 31, 2025 and 2024, the related consolidated statements of income, comprehensive income, changes in shareowners’
equity, and cash flows for each of the years in the three-year period ended December 31, 2025, and the related notes (collectively
referred to as the “consolidated financial statements”). In our opinion, the financial statements referred to above present fairly, in
all material respects, the financial position of the Company as of December 31, 2025 and 2024, and the results of its operations
and its cash flows for each of the years in the three-year period ended December 31, 2025, in conformity with accounting
principles generally accepted in the United States of America.
We also have audited, in accordance with the standards of the Public Company Accounting Oversight Board (United States)
(PCAOB), the Company’s internal control over financial reporting as of December 31, 2025, based on criteria established in
Internal Control – Integrated Framework (2013) issued by the Committee of Sponsoring Organizations of the Treadway
Commission and our report dated February 27, 2026, expressed an unqualified opinion.
Basis for Opinion
These financial statements are the responsibility of the Company’s management. Our responsibility is to express an opinion on the
Company’s consolidated financial statements based on our audits.
We are a public accounting firm registered with the Public Company Accounting Oversight Board (United States) (“PCAOB”)
and are required to be independent with respect to the Company in accordance with the U.S. federal securities laws and the
applicable rules and regulations of the Securities and Exchange Commission and the PCAOB.
We conducted our audits in accordance with the standards of the PCAOB. Those standards require that we plan and perform the
audit to obtain reasonable assurance about whether the financial statements are free of material misstatement, whether due to error
or fraud. The Company is not required to have, nor were we engaged to perform, an audit of its internal control over financial
reporting. As part of our audits, we are required to obtain an understanding of internal control over financial reporting but not for
the purpose of expressing an opinion on the effectiveness of the Company’s internal control over financial reporting. Accordingly,
we express no such opinion.
Our audits included performing procedures to assess the risks of material misstatement of the financial statements, whether due to
error or fraud, and performing procedures that respond to those risks. Such procedures include examining, on a test basis,
evidence regarding the amounts and disclosures in the financial statements. Our audits also included evaluating the accounting
principles used and significant estimates made by management, as well as evaluating the overall presentation of the financial
statements. We believe that our audits provide a reasonable basis for our opinion.
72
Critical Audit Matter
The critical audit matter communicated below arises from the current-period audit of the financial statements that were
communicated or required to be communicated to the audit committee and that: (1) relate to accounts or disclosures that are
material to the financial statements and (2) involved our especially challenging, subjective, or complex judgments. The
communication of critical audit matters does not alter in any way our opinion on the financial statements, taken as a whole, and
we are not, by communicating the critical audit matter below, providing a separate opinion on the critical audit matter or on the
accounts or disclosures to which it relates.
Allowance for Credit Losses
The Company’s loans held for investment portfolio totaled $2.55 billion as of December 31, 2025, and the allowance for credit
losses on loans held for investment was $31.0 million. As more fully described in Notes 1 and 3 to the Company’s consolidated
financial statements, the Company estimates its exposure to expected credit losses as of the statement of financial condition date
for existing financial instruments held at amortized cost.
The determination of the ACL requires management to exercise significant judgment and consider numerous subjective factors,
including determining qualitative factors utilized to adjust historical loss rates, loan credit risk grading and identifying loans
requiring individual evaluation, among others. As disclosed by management, different assumptions and conditions could result in
a materially different amount for the estimate of the ACL.
We identified the process for establishing the qualitative factors at December 31, 2025 as a critical audit matter. Auditing the
qualitative factors involved a high degree of subjectivity in evaluating management’s estimates.
The primary procedures we performed as of December 31, 2025 to address this critical audit matter included:
●
Obtained an understanding of the Company’s process for establishing the ACL, including the qualitative factor
adjustments of the ACL.
●
Tested the design and operating effectiveness of controls over the establishment of qualitative adjustments.
●
Evaluated the qualitative adjustments to the ACL, including assessing the basis for adjustments and the reasonableness
of the significant assumptions.
●
Evaluated the overall reasonableness of assumptions used by management considering trends identified within peer
groups.
●
Evaluated credit quality trends in delinquencies, non-accruals, charge -offs, and loan risk ratings.
/s/
We have served as the Company’s auditor since 2021.
February 27, 2026
73
CAPITAL CITY BANK GROUP, INC.
CONSOLIDATED STATEMENTS OF FINANCIAL CONDITION
As of December 31,
(Dollars in Thousands)
2025
2024
ASSETS
Cash and Due From Banks
$
$
Federal Funds Sold and Interest Bearing Deposits
Total Cash and Cash Equivalents
Investment Securities, Available for Sale, at fair value (amortized cost of $
)
Investment Securities, Held to Maturity (fair value of $
)
Equity Securities
Total Investment Securities
Loans Held For Sale, at fair value
Loans, Held for Investment
Allowance for Credit Losses
(31,001 )
(29,251 )
Loans Held for Investment, Net
Premises and Equipment, Net
Goodwill and Other Intangibles
Other Real Estate Owned
Other Assets
Total Assets
$
$
LIABILITIES
Deposits:
Noninterest Bearing Deposits
$
$
Interest Bearing Deposits
Total Deposits
Short-Term Borrowings
Subordinated Notes Payable
Other Long-Term Borrowings
Other Liabilities
Total Liabilities
SHAREOWNERS’ EQUITY
Preferred Stock, $
-
-
Common Stock, $
shares issued and outstanding at December 31, 2025 and 2024, respectively
Additional Paid-In Capital
Retained Earnings
Accumulated Other Comprehensive Income (Loss), Net of Tax
(6,486 )
Total Shareowners’ Equity
Total Liabilities and Shareowners’ Equity
$
$
The accompanying Notes to Consolidated Financial Statements are an integral part of these statements.
74
CAPITAL CITY BANK GROUP, INC.
CONSOLIDATED STATEMENTS OF INCOME
For the Years Ended December 31,
(Dollars in Thousands, Except Per Share Data)
2025
2024
2023
INTEREST INCOME
Loans, including Fees
$
$
$
Investment Securities:
Taxable
Tax Exempt
Federal Funds Sold and Interest Bearing Deposits
Total Interest Income
INTEREST EXPENSE
Deposits
Short-Term Borrowings
Subordinated Notes Payable
Other Long-Term Borrowings
Total Interest Expense
NET INTEREST INCOME
Provision for Credit Losses
Net Interest Income After Provision for Credit Losses
NONINTEREST INCOME
Deposit Fees
Bank Card Fees
Wealth Management Fees
Mortgage Banking Revenues
Other
Total Noninterest Income
NONINTEREST EXPENSE
Compensation
Occupancy, Net
Other
Total Noninterest Expense
INCOME BEFORE INCOME TAXES
Income Tax Expense
NET INCOME
$
$
$
Loss Attributable to Noncontrolling Interests
NET INCOME ATTRIBUTABLE TO COMMON SHAREOWNERS
$
$
$
BASIC NET INCOME PER SHARE
$
$
$
DILUTED NET INCOME PER SHARE
$
$
$
Average Basic Common Shares Outstanding
Average Diluted Common Shares Outstanding
The accompanying Notes to Consolidated Financial Statements are an integral part of these statements.
75
CAPITAL CITY BANK GROUP, INC.
CONSOLIDATED STATEMENTS OF COMPREHENSIVE INCOME
For the Years Ended December 31,
(Dollars in Thousands)
2025
2024
2023
NET INCOME ATTRIBUTABLE TO COMMON SHAREOWNERS
$
$
$
Other comprehensive income, before tax:
Investment Securities:
Change in net unrealized loss on securities available-for-sale
Amortization of unrealized losses on securities transferred from
Derivative:
Change in net unrealized gain on effective cash flow derivative
(1,532 )
(878 )
Amortization of discontinued cash flow derivative gain
(203 )
Benefit Plans:
Reclassification adjustment for amortization of prior service cost
(239 )
Reclassification adjustment for amortization of net gain
(1,771 )
(116 )
Defined benefit plan settlement gain
(1,552 )
(291 )
Current year actuarial gain
Total Benefit Plans
(376 )
Other comprehensive income, before tax:
Deferred tax expense related to other comprehensive income
(3,027 )
(5,268 )
(4,476 )
Other comprehensive income, net of tax
TOTAL COMPREHENSIVE INCOME
$
$
$
The accompanying Notes to Consolidated Financial Statements are an integral part of these statements.
76
CAPITAL CITY BANK GROUP, INC.
CONSOLIDATED STATEMENTS OF CHANGES IN SHAREOWNERS' EQUITY
Accumulated
Other
Comprehensive
(Loss) Gain,
Net of Taxes
(Dollars in Thousands, Except Share Data)
Shares
Outstanding
Common
Stock
Additional
Paid-In
Capital
Retained
Earnings
Total
Balance, January 1, 2023
(37,229 )
Net Income Attributable to Common Shareowners
-
Reclassification to Temporary Equity
(1)
-
(87 )
(87 )
Other Comprehensive Income, Net of Tax
-
Cash Dividends ($
-
(12,905 )
(12,905 )
Stock Based Compensation
-
Stock Compensation Plan Transactions, net
Repurchase of Common Stock
(122,538 )
(3,710 )
(3,710 )
Balance, December 31, 2023
(22,146 )
Net Income Attributable to Common Shareowners
-
Reclassification to Temporary Equity
(1)
-
(751 )
(751 )
Reclassification from Temporary Equity
(2)
-
Other Comprehensive Income, Net of Tax
-
Cash Dividends ($
-
(14,906 )
(14,906 )
Stock Based Compensation
-
Stock Compensation Plan Transactions, net
Repurchase of Common Stock
(82,540 )
-
(2,330 )
-
-
(2,330 )
Balance, December 31, 2024
(6,486 )
Net Income Attributable to Common Shareowners
-
Other Comprehensive Income, Net of Tax
-
Cash Dividends ($
-
(17,063 )
(17,063 )
Stock Based Compensation
-
Stock Compensation Plan Transactions, net
Balance, December 31, 2025
(1)
Adjustments to redemption value for non-controlling interest in CCHL
(2)
Adjustment reflects the difference between the fair value and the book value of the non-controlling interest in CCHL
The accompanying Notes to Consolidated Financial Statements are an integral part of these statements.
77
CAPITAL CITY BANK GROUP, INC.
CONSOLIDATED STATEMENTS OF CASH FLOWS
For the Years Ended December 31,
(Dollars in Thousands)
2025
2024
2023
CASH FLOWS FROM OPERATING ACTIVITIES
Net Income Attributable to Common Shareowners
$
$
$
Adjustments to Reconcile Net Income to Cash From Operating Activities:
(773 )
(1,552 )
(291 )
(441,019 )
(485,901 )
(406,803 )
(16,959 )
(14,343 )
(10,400 )
(102 )
(154 )
(5 )
(48 )
(1,032 )
(483 )
(4,486 )
(979 )
(2,053 )
(12,024 )
(1,029 )
(4,452 )
CASH FLOWS FROM INVESTING ACTIVITIES
Securities Held to Maturity:
(94,089 )
(64,031 )
(1,483 )
Securities Available for Sale:
(307,446 )
(126,783 )
(8,379 )
(120 )
(9,164 )
(13,566 )
Purchases of Loans Held for Investment
(1,183 )
(848 )
(2,488 )
Net Decrease (Increase) in Loans Held for Investment
(226,896 )
Proceeds from Sales of Loans
Net Cash Received for Divestitures
Proceeds From Sales of Other Real Estate Owned
Purchases of Premises and Equipment, net
(7,589 )
(8,688 )
(7,046 )
Net Cash Provided By (Used In) Investing Activities
(68,541 )
CASH FLOWS FROM FINANCING ACTIVITIES
Net Decrease in Deposits
(9,665 )
(29,845 )
(237,495 )
Net Increase (Decrease) in Short-Term Borrowings
(7,236 )
(21,452 )
Principal Payments of Subordinated Notes
(10,305 )
Repayment of Other Long-Term Borrowings
(116 )
(199 )
Net Increase in Other Long-Term Borrowings
Dividends Paid
(17,063 )
(14,906 )
(12,905 )
Payments to Repurchase Common Stock
(2,330 )
(3,710 )
Issuance of Common Stock Under Compensation Plans
Net Cash (Used in) Provided By Financing Activities
(13,904 )
(52,138 )
(274,824 )
NET INCREASE (DECREASE) IN CASH AND CASH EQUIVALENTS
(288,583 )
Cash and Cash Equivalents at Beginning of Year
Cash and Cash Equivalents at End of Year
$
$
$
78
Supplemental Cash Flow Disclosures:
$
$
$
$
$
$
Florida
$
$
$
All Other
$
$
$
Supplemental Noncash Items:
$
$
$
$
$
$
Transfer of Temporary Equity to Other Liabilities
$
$
$
The accompanying Notes to Consolidated Financial Statements are an integral part of these statements.
79
Notes to Consolidated Financial Statements
Note 1
SIGNIFICANT ACCOUNTING POLICIES
Nature of Operations
Capital City Bank Group, Inc. (“CCBG”) provides a full range of banking and banking-related services to individual and
corporate clients through its wholly-owned subsidiary, Capital City Bank (“CCB” or the “Bank” and together with CCBG, the
“Company”), with banking offices located in Florida, Georgia, and Alabama. The Company is subject to competition from other
financial institutions, is subject to regulation by certain government agencies and undergoes periodic examinations by those
regulatory authorities.
Basis of Presentation
The consolidated financial statements include the accounts of CCBG and CCB. CCB has three primary subsidiaries, which are
wholly owned, Capital City Trust Company, Capital City Investments and Capital City Home Loans, LLC (“CCHL”). Prior to
January 1, 2025, the Company maintained a
% membership interest in CCHL that was a consolidated entity in the Company’s
financial statements.
The Company, which operates a single reportable business segment that is comprised of commercial banking within the states of
Florida, Georgia, and Alabama, follows accounting principles generally accepted in the United States of America and reporting
practices applicable to the banking industry. The principles which materially affect the financial position, results of operations
and cash flows are summarized below. See Note 24 – Segment Reporting for additional information.
The Company determines whether it has a controlling financial interest in an entity by first evaluating whether the entity is a
voting interest entity or a variable interest entity under accounting principles generally accepted in the United States of America.
Voting interest entities are entities in which the total equity investment at risk is sufficient to enable the entity to finance itself
independently and provide the equity holders with the obligation to absorb losses, the right to receive residual returns and the
right to make decisions about the entity’s activities. The Company consolidates voting interest entities in which it has all, or at
least a majority of, the voting interest. As defined in applicable accounting standards, variable interest entities (“VIEs”) are
entities that lack one or more of the characteristics of a voting interest entity. A controlling financial interest in an entity is
present when an enterprise has a variable interest, or a combination of variable interests, that will absorb a majority of the entity’s
expected losses, receive a majority of the entity’s expected residual returns, or both. The enterprise with a controlling financial
interest, known as the primary beneficiary, consolidates the VIE. Two of CCBG’s wholly owned subsidiaries, CCBG Capital
Trust I (established November 1, 2004) and CCBG Capital Trust II (established May 24, 2005) are VIEs for which the Company
is not the primary beneficiary. Accordingly, the accounts of these entities are not included in the Company’s consolidated
financial statements.
Certain previously reported amounts have been reclassified to conform to the current year’s presentation. All material inter-
company transactions and accounts have been eliminated in consolidation. The Company has evaluated subsequent events for
potential recognition and/or disclosure through the date the consolidated financial statements included in this Annual Report on
Form 10-K were filed with the United States Securities and Exchange Commission.
Use of Estimates
The preparation of financial statements in conformity with accounting principles generally accepted in the United States of
America requires management to make estimates and assumptions that affect the reported amounts of assets and liabilities, the
disclosure of contingent assets and liabilities at the date of financial statements and the reported amounts of revenues and
expenses during the reporting period. Actual results could vary from these estimates. Material estimates that are particularly
susceptible to significant changes in the near-term relate to the determination of the allowance for credit losses, pension expense,
income taxes, loss contingencies, valuation of other real estate owned, and valuation of goodwill and their respective analysis of
impairment.
80
Significant Accounting Principles
Cash and Cash Equivalents
Cash and cash equivalents include cash and due from banks, interest-bearing deposits in other banks, and federal funds
sold. Generally, federal funds are purchased and sold for one-day periods and all other cash equivalents have a maturity of 90
days or less.
The Company maintains certain cash balances that are restricted under warehouse lines of credit and master repurchase
agreements. The restricted cash balance at December 31, 2025 and 2024 was $
Investment Securities
Investment securities are classified as held-to-maturity (“HTM”) and carried at amortized cost when the Company has the positive
intent and ability to hold them until maturity. Investment securities not classified as HTM are classified as available-for-sale
(“AFS”) and carried at fair value. The Company does not have trading investment securities. Investment securities classified as
equity securities that do not have readily determinable fair values, are measured at cost and remeasured to fair value when
impaired or upon observable transaction prices. The Company determines the appropriate classification of securities at the time
of purchase. For reporting and risk management purposes, the Company further segment s investment securities by the issuer of
the security which correlates to its risk profile: U.S. government treasury, U.S. government agency, state and political
subdivisions, mortgage-backed securities, and corporate debt securities. Certain equity securities with limited marketability, such
as stock in the Federal Reserve Bank and the Federal Home Loan Bank, are classified as AFS and carried at cost.
Interest income includes amortization and accretion of purchase premiums and discounts. Realized gains and losses are derived
from the amortized cost of the security sold. Gains and losses on the sale of securities are recorded on the trade date and are
determined using the specific identification method. Securities transferred from AFS to HTM are recorded at amortized cost plus
or minus any unrealized gain or loss at the time of transfer. Any existing unrecognized gain or loss continues to be reported in
accumulated other comprehensive loss (net of tax) and amortized as an adjustment to interest income over the remaining life of
the security. Any existing allowance for credit loss is reversed at the time of transfer. Subsequent to transfer, the allowance for
credit losses on the transferred security is evaluated in accordance with the accounting policy for HTM securities. Additionally,
any allowance amounts reversed or established as part of the transfer are presented on a gross basis in the Consolidated Statement
of Income.
The accrual of interest is generally suspended on securities more than 90 days past due with respect to principal or interest. When
a security is placed on nonaccrual status, all previously accrued and uncollected interest is reversed against current income and
thus not included in the estimate of credit losses.
Credit losses and changes thereto, are established as an allowance for credit loss through a provision for credit loss expense.
Losses are charged against the allowance when management believes the uncollectability of a security is confirmed or when
either of the criteria regarding intent or requirement to sell is met.
Certain debt securities in the Company’s investment portfolio were issued by a U.S. government entity or agency and are either
explicitly or implicitly guaranteed by the U.S. government. The Company considers the long history of no credit losses on these
securities indicates that the expectation of nonpayment of the amortized cost basis is zero, even if the U.S. government were to
technically default. Further, certain municipal securities held by the Company have been pre-refunded and secured by
government guaranteed treasuries. Therefore, for the aforementioned securities, the Company does not assess or record expected
credit losses due to the zero loss assumption.
81
Impairment - Available -for-Sale Securities
.
Unrealized gains on AFS securities are excluded from earnings and reported, net of tax, in other comprehensive income. For AFS
securities that are in an unrealized loss position, the Company first assesses whether it intends to sell, or whether it is more likely
than not it will be required to sell the security before recovery of its amortized cost basis. If either of the criteria regarding intent
or requirement to sell is met, the security’s amortized cost basis is written down to fair value through income. For AFS securities
that do not meet the aforementioned criteria or have a zero loss assumption, the Company evaluates whether the decline in fair
value has resulted from credit losses or other factors. In making this assessment, management considers the extent to which fair
value is less than amortized cost, any changes to the rating of the security by a rating agency, and adverse conditions specifically
related to the security, among other factors. If the assessment indicates that a credit loss exists, the present value of cash flows to
be collected from the security are compared to the amortized cost basis of the security. If the present value of cash flows
expected to be collected is less than the amortized cost basis, a credit loss exists and an allowance for credit losses is recorded
through a provision for credit loss expense, limited by the amount that fair value is less than the amortized cost basis. Any
impairment that is not credit related is recognized in other comprehensive income.
Allowance for Credit Losses - Held-to-Maturity Securities.
Management measures expected credit losses on each individual HTM debt security that has not been deemed to have a zero
assumption. Each security that is not deemed to have zero credit losses is individually measured based on net realizable value, or
the difference between the discounted value of the expected cash flows, based on the original effective rate, and the recorded
amortized basis of the security. To the extent a shortfall is related to credit loss, an allowance for credit loss is recorded through a
provision for credit loss expense. See Note 2 – Investment Securities for additional information.
Loans Held for Investment
Loans held for investment (“HFI”) are stated at amortized cost which includes the principal amount outstanding, net premiums
and discounts, and net deferred loan fees and costs. Accrued interest receivable on loans is reported in other assets and is not
included in the amortized cost basis of loans. Interest income is accrued on the effective yield method based on outstanding
principal balances and includes loan late fees. Fees charged to originate loans and direct loan origination costs are deferred and
amortized over the life of the loan as a yield adjustment.
The Company defines loans as past due when one full payment is past due or a contractual maturity is over 30 days late. The
accrual of interest is generally suspended on loans more than 90 days past due with respect to principal or interest. When a loan is
placed on nonaccrual status, all previously accrued and uncollected interest is reversed against current income and thus a policy
election has been made to not include accrued interest in the estimate of credit losses. Interest income on nonaccrual loans is
recognized when the ultimate collectability is no longer considered doubtful. Loans are returned to accrual status when the
principal and interest amounts contractually due are brought current or when future payments are reasonably assured.
Loan charge-offs on commercial and investor real estate loans are recorded when the facts and circumstances of the individual
loan confirm the loan is not fully collectible and the loss is reasonably quantifiable. Factors considered in making these
determinations are the borrower’s and any guarantor’s ability and willingness to pay, the status of the account in bankruptcy court
(if applicable), and collateral value. Charge-off decisions for consumer loans are dictated by the Federal Financial Institutions
Examination Council’s Uniform Retail Credit Classification and Account Management Policy which establishes standards for the
classification and treatment of consumer loans, which generally require charge-off after 120 days of delinquency.
The Company has adopted comprehensive lending policies, underwriting standards and loan review procedures designed to
maximize loan income within an acceptable level of risk. Reporting systems are used to monitor loan originations, loan ratings,
concentrations, loan delinquencies, nonperforming and potential problem loans, and other credit quality metrics. The ongoing
review of loan portfolio quality and trends by Management and the Credit Risk Oversight Committee support the process for
estimating the allowance for credit losses. See Note 3 – Loans Held for Investment and Allowance for Credit Losses for
additional information.
Allowance for Credit Losses
The allowance for credit losses is a valuation account that is deducted from the loans’ amortized cost basis to present the net
amount expected to be collected on the loans. The allowance for credit losses is adjusted by a credit loss provision which is
reported in earnings and reduced by the charge-off of loan amounts, net of recoveries. Loans are charged off against the
allowance when management believes the uncollectability of a loan balance is confirmed. Expected recoveries do not exceed the
aggregate of amounts previously charged-off and expected to be charged-off. Expected credit loss inherent in non-cancellable
off-balance sheet credit exposures is provided for through the credit loss provision but recorded separately in other liabilities.
82
Management estimates the allowance balance using relevant available information, from internal and external sources, relating to
past events, current conditions, and reasonable and supportable forecasts. Historical loan default and loss experience provides the
basis for the estimation of expected credit losses. Adjustments to historical loss information incorporate management’s view of
current conditions and forecasts.
The methodology for estimating the amount of credit losses reported in the allowance for credit losses has two basic components:
first, an asset-specific component involving loans that do not share risk characteristics and the measurement of expected credit
losses for such individual loans; and second, a pooled component for expected credit losses for pools of loans that share similar
risk characteristics.
Loans That Do Not Share Risk Characteristics (Individually Analyzed)
Loans that do not share similar risk characteristics are evaluated on an individual basis. Loans deemed to be collateral dependent
have differing risk characteristics and are individually analyzed to estimate the expected credit loss. A loan is collateral
dependent when the borrower is experiencing financial difficulty and repayment of the loan is dependent on the liquidation and
sale of the underlying collateral. For collateral dependent loans where foreclosure is probable, the expected credit loss is
measured based on the difference between the fair value of the collateral (less selling cost) and the amortized cost basis of the
asset. For collateral dependent loans where foreclosure is not probable, the Company has elected the practical expedient allowed
by Financial Accounting Standards Board (“FASB”) Accounting Standards Codification (“ASC”) Topic 326-20 to measure the
expected credit loss under the same approach as those loans where foreclosure is probable. For loans with balances greater than
$250,000, the fair value of the collateral is obtained through independent appraisal of the underlying collateral. For loans with
balances less than $250,000, the Company has made a policy election to measure expected loss for these individual loans utilizing
loss rates for similar loan types.
Loans That Share Similar Risk Characteristics (Pooled Loans)
The general steps in determining expected credit losses for the pooled loan component of the allowance are as follows:
●
Segment loans into pools according to similar risk characteristics
●
Develop historical loss rates for each loan pool segment
●
Incorporate the impact of forecasts
●
Incorporate the impact of other qualitative factors
●
Calculate and review pool specific allowance for credit loss estimate
A discounted cash flow methodology is utilized to calculate expected cash flows for the life of each individual loan. The
discounted present value of expected cash flow is then compared to the loan’s amortized cost basis to determine the credit loss
estimate. Individual loan results are aggregated at the pool level in determining total reserves for each loan pool.
The primary inputs used to calculate expected cash flows include historical loss rates which reflect probability of default (“PD”)
and loss given default (“LGD”), and prepayment rates. The historical look-back period is a key factor in the calculation of the PD
rate and is based on management’s assessment of current and forecasted conditions and may vary by loan pool. Loans subject to
the Company’s risk rating process are further sub-segmented by risk rating in the calculation of PD rates. LGD rates generally
reflect the historical average net loss rate by loan pool. Expected cash flows are further adjusted to incorporate the impact of loan
prepayments which will vary by loan segment and interest rate conditions. In general, prepayment rates are based on observed
prepayment rates occurring in the loan portfolio and consideration of forecasted interest rates.
83
In developing loss rates, adjustments are made to incorporate the impact of forecasted conditions. Certain assumptions are also
applied, including the length of the forecast and reversion periods. The forecast period is the period within which management is
able to make a reasonable and supportable assessment of future conditions. The reversion period is the period beyond which
management believes it can develop a reasonable and supportable forecast and bridges the gap between the forecast period and
the use of historical default and loss rates. The remainder period reflects the remaining life of the loan. The length of the forecast
and reversion periods are periodically evaluated and based on management’s assessment of current and forecasted conditions and
may vary by loan pool. For purposes of developing a reasonable and supportable assessment of future conditions, management
utilizes established industry and economic data points and sources, including the Federal Open Market Committee forecast, with
the forecasted unemployment rate being a significant factor. PD rates for the forecast period will be adjusted accordingly based
on management’s assessment of future conditions. PD rates for the remainder period will reflect the historical mean PD rate.
Reversion period PD rates reflect the difference between forecast and remainder period PD rates calculated using a straight-line
adjustment over the reversion period.
Loss rates are further adjusted to account for other risk factors that impact loan defaults and losses. These adjustments are based
on management’s assessment of trends and conditions that impact credit risk and resulting credit losses, more specifically internal
and external factors that are independent of and not reflected in the quantitative loss rate calculations. Risk factors management
considers in this assessment include trends in underwriting standards, nature/volume/terms of loan originations, past due loans,
loan review systems, collateral valuations, concentrations, legal/regulatory/political conditions, and the unforeseen impact of
natural disasters.
Allowance for Credit Losses on Off-Balance Sheet Credit Exposures
The Company estimates expected credit losses over the contractual period in which it is exposed to credit risk through a
contractual obligation to extend credit, unless that obligation is unconditionally cancellable by the Company. The allowance for
credit losses on off-balance sheet credit exposures is adjusted as a provision for credit loss expense and is recorded in other
liabilities. The estimate includes consideration of the likelihood that funding will occur and an estimate of expected credit losses
on commitments expected to be funded over its estimated life and applies the same estimated loss rate as determined for current
outstanding loan balances by segment. Off-balance sheet credit exposures are identified and classified in the same categories as
the allowance for credit losses with similar risk characteristics that have been previously mentioned. See Note 21 – Commitments
and Contingencies for additional information.
Mortgage Banking Activities
Mortgage Loans Held for Sale and Revenue Recognition
Mortgage loans held for sale (“HFS”) are carried at fair value under the fair value option with changes in fair value recorded in
mortgage banking revenues on the Consolidated Statements of Income. The fair value of mortgage loans held for sale committed
to investors is calculated using observable market information such as the investor commitment, assignment of trade or other
mandatory delivery commitment prices. The Company bases loans committed to Federal National Mortgage Association
(“FNMA”), Government National Mortgage Association (“GNMA”), and Federal Home Loan Mortgage Corporation (“Agency”)
investors based on the Agency’s quoted mortgage backed security (“MBS”) prices. The fair value of mortgage loans held for sale
not committed to investors is based on quoted best execution secondary market prices. If no such quoted price exists, the fair
value is determined using quoted prices for a similar asset or assets, such as MBS prices, adjusted for the specific attributes of that
loan, which would be used by other market participants.
Gains and losses from the sale of mortgage loans held for sale are recognized based upon the difference between the sales
proceeds and carrying value of the related loans upon sale and are recorded in mortgage banking revenues on the Consolidated
Statements of Income. Sales proceeds reflect the cash received from investors through the sale of the loan and servicing release
premium. If the related mortgage loan is sold with servicing retained, the MSR addition is recorded in mortgage banking revenues
on the Consolidated Statements of Income. Mortgage banking revenues also includes the unrealized gains and losses associated
with the changes in the fair value of mortgage loans held for sale, and the realized and unrealized gains and losses from derivative
instruments.
Mortgage loans held for sale are considered sold when the Company surrenders control over the financial assets. Control is
considered to have been surrendered when the transferred assets have been isolated from the Company, beyond the reach of the
Company and its creditors; the purchaser obtains the right (free of conditions that constrain it from taking advantage of that right)
to pledge or exchange the transferred assets; and the Company does not maintain effective control over the transferred assets
through either an agreement that both entitles and obligates the Company to repurchase or redeem the transferred assets before
their maturity or the ability to unilaterally cause the holder to return specific assets. The Company typically considers the above
criteria to have been met upon acceptance and receipt of sales proceeds from the purchaser.
84
GNMA optional repurchase programs allow financial institutions to buy back individual delinquent mortgage loans that meet
certain criteria from the securitized loan pool for which the institution provides servicing. At the servicer’s option and without
GNMA’s prior authorization, the servicer may repurchase such a delinquent loan for an amount equal to 100 percent of the
remaining principal balance of the loan. Under FASB ASC Topic 860, “Transfers and Servicing,” this buy-back option is
considered a conditional option until the delinquency criteria are met, at which time the option becomes unconditional. When the
Company is deemed to have regained effective control over these loans under the unconditional buy-back option, the loans can no
longer be reported as sold and must be brought back onto the Consolidated Statement of Financial Condition, regardless of
whether there is intent to exercise the buy-back option. These loans are reported in other assets with the offsetting liability being
reported in other liabilities.
Derivative Instruments (IRLC/Forward Commitments)
The Company holds and issues derivative financial instruments such as interest rate lock commitments (“IRLCs”) and other
forward sale commitments. IRLCs are subject to price risk primarily related to fluctuations in market interest rates. To hedge the
interest rate risk on certain IRLCs, the Company uses forward sale commitments, such as to-be-announced securities (“TBAs”) or
mandatory delivery commitments with investors. Management expects these forward sale commitments to experience changes in
fair value opposite to the changes in fair value of the IRLCs thereby reducing earnings volatility. Forward sale commitments are
also used to hedge the interest rate risk on mortgage loans held for sale that are not committed to investors and still subject to
price risk. If the mandatory delivery commitments are not fulfilled, the Company pays a pair-off fee. Best effort forward sale
commitments are also executed with investors, whereby certain loans are locked with a borrower and simultaneously committed
to an investor at a fixed price. If the best effort IRLC does not fund, there is no obligation to fulfill the investor commitment.
The Company considers various factors and strategies in determining what portion of the IRLCs and uncommitted mortgage loans
held for sale to economically hedge. All derivative instruments are recognized as other assets or other liabilities on the
Consolidated Statements of Financial Condition at their fair value. Changes in the fair value of the derivative instruments are
recognized in mortgage banking revenues on the Consolidated Statements of Income in the period in which they occur. Gains and
losses resulting from the pairing-out of forward sale commitments are recognized in mortgage banking revenues on the
Consolidated Statements of Income. The Company accounts for all derivative instruments as free-standing derivative instruments
and does not designate any for hedge accounting.
Mortgage Servicing Rights (“MSRs”) and Revenue Recognition
The Company sells residential mortgage loans in the secondary market and may retain the right to service the loans sold. Upon
sale, an MSR asset is capitalized, which represents the then current fair value of future net cash flows expected to be realized for
performing servicing activities. As the Company has not elected to subsequently measure any class of servicing assets under the
fair value measurement method, the Company follows the amortization method. MSRs are amortized to noninterest income
(other income) in proportion to and over the period of estimated net servicing income and are assessed for impairment at each
reporting date. MSRs are carried at the lower of the initial capitalized amount, net of accumulated amortization, or estimated fair
value, and included in other assets, net, on the Consolidated Statements of Financial Condition.
The Company periodically evaluates its MSRs asset for impairment. Impairment is assessed based on fair value at each reporting
date using estimated prepayment speeds of the underlying mortgage loans serviced and stratifications based on the risk
characteristics of the underlying loans (predominantly loan type and note interest rate). As mortgage interest rates fall,
prepayment speeds are usually faster and the value of the MSRs asset generally decreases, requiring additional valuation reserve.
Conversely, as mortgage interest rates rise, prepayment speeds are usually slower and the value of the MSRs asset generally
increases, requiring less valuation reserve. A valuation allowance is established, through a charge to earnings, to the extent the
amortized cost of the MSRs exceeds the estimated fair value by stratification. If it is later determined that all or a portion of the
temporary impairment no longer exists for a stratification, the valuation is reduced through a recovery to earnings. An other-than-
temporary impairment (i.e., recoverability is considered remote when considering interest rates and loan pay off activity) is
recognized as a write-down of the MSRs asset and the related valuation allowance (to the extent a valuation allowance is
available) and then against earnings. A direct write-down permanently reduces the carrying value of the MSRs asset and
valuation allowance, precluding subsequent recoveries. See Note 4 – Mortgage Banking Activities for additional information.
85
Derivative/Hedging Activities
At the inception of a derivative contract, the Company designates the derivative as one of three types based on the Company’s
intentions and belief as to the likely effectiveness as a hedge. These three types are (1) a hedge of the fair value of a recognized
asset or liability or of an unrecognized firm commitment (“fair value hedge”), (2) a hedge of a forecasted transaction or the
variability of cash flows to be received or paid related to a recognized asset or liability (“cash flow hedge”), or (3) an instrument
with no hedging designation (“standalone derivative”). For a fair value hedge, the gain or loss on the derivative, as well as the
offsetting loss or gain on the hedged item, are recognized in current earnings as fair values change. For a cash flow hedge, the
gain or loss on the derivative is reported in other comprehensive income and is reclassified into earnings in the same periods
during which the hedged transaction affects earnings. For both types of hedges, changes in the fair value of derivatives that are
not highly effective in hedging the changes in fair value or expected cash flows of the hedged item are recognized immediately in
current earnings. Net cash settlements on derivatives that qualify for hedge accounting are recorded in interest income or interest
expense, based on the item being hedged. Net cash settlements on derivatives that do not qualify for hedge accounting are
reported in non-interest income. Cash flows on hedges are classified in the cash flow statement the same as the cash flows of the
items being hedged.
The Company formally documents the relationship between derivatives and hedged items, as well as the risk-management
objective and the strategy for undertaking hedge transactions at the inception of the hedging relationship. This documentation
includes linking fair value or cash flow hedges to specific assets and liabilities on the Consolidated Statement of Financial
Condition or to specific firm commitments or forecasted transactions. The Company also formally assesses, both at the hedge’s
inception and on an ongoing basis, whether the derivative instruments that are used are highly effective in offsetting changes in
fair values or cash flows of the hedged items. The Company discontinues hedge accounting when it determines that the derivative
is no longer effective in offsetting changes in the fair value or cash flows of the hedged item, the derivative is settled or
terminates, a hedged forecasted transaction is no longer probable, a hedged firm commitment is no longer firm, or treatment of the
derivative as a hedge is no longer appropriate or intended. When hedge accounting is discontinued, subsequent changes in fair
value of the derivative are recorded as non-interest income. When a fair value hedge is discontinued, the hedged asset or liability
is no longer adjusted for changes in fair value, and the existing basis adjustment is amortized or accreted over the remaining life
of the asset or liability. When a cash flow hedge is discontinued but the hedged cash flows or forecasted transactions are still
expected to occur, gains or losses that were accumulated in other comprehensive income are amortized into earnings over the
same periods, in which the hedged transactions will affect earnings. See Note 5 – Derivatives for additional information.
Long-Lived Assets
Premises and equipment is stated at cost less accumulated depreciation, computed on the straight-line method over the estimated
useful lives for each type of asset with premises being depreciated over a range of
depreciated over a range of
depreciated over the lesser of the useful life or the remaining lease term. Repairs and maintenance are charged to noninterest
expense as incurred.
Long-lived assets are evaluated for impairment if circumstances suggest that their carrying value may not be recoverable, by
comparing the carrying value to estimated undiscounted cash flows. If the asset is deemed impaired, an impairment charge is
recorded equal to the carrying value less the fair value. See Note 6 – Premises and Equipment for additional information.
Leases
The Company has entered into various operating leases, primarily for banking offices. Generally, these leases have initial lease
terms from one to ten years. Many of the leases have one or more lease renewal options. The exercise of lease renewal options is
at the Company’s sole discretion. The Company does not consider exercise of any lease renewal options reasonably certain.
Certain leases contain early termination options. No renewal options or early termination options have been included in the
calculation of the operating right-of-use assets or operating lease liabilities. Certain lease agreements provide for periodic
adjustments to rental payments for inflation. At the commencement date of the lease, the Company recognizes a lease liability at
the present value of the lease payments not yet paid, discounted using the discount rate for the lease or the Company’s
incremental borrowing rate. As the majority of the Company’s leases do not provide an implicit rate, the Company uses its
incremental borrowing rate at the commencement date in determining the present value of lease payments. The incremental
borrowing rate is based on the term of the lease. At the commencement date, the Company also recognizes a right-of-use asset
measured at (i) the initial measurement of the lease liability; (ii) any lease payments made to the lessor at or before the
commencement date less any lease incentives received; and (iii) any initial direct costs incurred by the lessee. Leases with an
initial term of 12 months or less are not recorded on the Consolidated Statement of Financial Condition. For these short-term
leases, lease expense is recognized on a straight-line basis over the lease term. The Company has no leases classified as finance
leases. See Note 7 – Leases for additional information.
86
Bank Owned Life Insurance
The Company, through its subsidiary bank, has purchased life insurance policies on certain key officers. Bank owned life
insurance is recorded at the amount that can be realized under the insurance contract at the statement of financial condition date,
which is the cash surrender value adjusted for other charges or other amounts due that are probable at settlement.
Goodwill and Other Intangibles
Goodwill represents the excess of the cost of businesses acquired over the fair value of the net assets acquired. In accordance
with FASB ASC Topic 350, the Company determined it has one goodwill reporting unit. Goodwill is tested for impairment
annually during the fourth quarter or on an interim basis if an event occurs or circumstances change that would more likely than
not reduce the fair value of the reporting unit below its carrying value. Other intangible assets relate to customer intangibles
purchased as part of a business acquisition. Intangible assets are tested for impairment at least annually or whenever changes in
circumstances indicate the carrying amount of the assets may not be recoverable from future undiscounted cash flows. See Note 8
– Goodwill and Other Intangibles for additional information
.
Other Real Estate Owned
Assets acquired through, or in lieu of, loan foreclosure are held for sale and are initially recorded at the lower of cost or fair value
less estimated selling costs, establishing a new cost basis. Subsequent to foreclosure, valuations are periodically performed by
management, and the assets are carried at the lower of carrying amount or fair value less cost to sell. The valuation of foreclosed
assets is subjective in nature and may be adjusted in the future because of changes in economic conditions. Revenue and
expenses from operations and changes in value are included in noninterest expense. See Note 9 – Other Real Estate for additional
information.
Loss Contingencies
Loss contingencies, including claims and legal actions arising in the ordinary course of business are recorded as liabilities when
the likelihood of loss is probable and an amount or range of loss can be reasonably estimated. See Note 21 – Commitments and
Contingencies for additional information.
Noncontrolling Interest
Prior to January 1, 2025, the Company maintained a
% membership interest in CCHL that was a consolidated entity in the
Company’s financial statements. To the extent the Company’s interest in a consolidated entity represents less than 100% of the
entity’s equity, the Company recognizes noncontrolling interests in subsidiaries. In the case of the CCHL acquisition, the
noncontrolling interest represents equity which is redeemable or convertible for cash at the option of the equity holder and is
classified within temporary equity in the mezzanine section of the Consolidated Statements of Financial Condition. The
subsidiary’s net income or loss and related dividends are allocated to CCBG and the noncontrolling interest holder based on their
relative ownership percentages. The noncontrolling interest carrying value is adjusted on a quarterly basis to the higher of the
carrying value or current redemption value, at the Statement of Financial Condition date, through a corresponding adjustment to
retained earnings. The redemption value is calculated quarterly and is based on the higher of a predetermined book value or pre-
tax earnings multiple. To the extent the redemption value exceeds the fair value of the noncontrolling interest, the Company’s
earnings per share attributable to common shareowners is adjusted by that amount. The Company uses an independent valuation
expert to assist in estimating the fair value of the noncontrolling interest using: 1) the discounted cash flow methodology under
the income approach, and (2) the guideline public company methodology under the market approach. The estimated fair value is
derived from equally weighting the result of each of the two methodologies. The estimation of the fair value includes significant
assumptions concerning: (1) projected loan volumes; (2) projected pre-tax profit margins; (3) tax rates and (4) discount rates.
Concurrent with the agreement to assign the minority membership interest (49%) in CCHL, temporary equity was reclassified to
other liabilities and recorded at the fair value of the minority interest of $
87
Income Taxes
Income tax expense is the total of the current year income tax due or refundable and the change in deferred tax assets and
liabilities (excluding deferred tax assets and liabilities related to business combinations or components of other comprehensive
income). Deferred tax assets and liabilities are the expected future tax amounts for the temporary differences between carrying
amounts and tax bases of assets and liabilities, computed using enacted tax rates. A valuation allowance, if needed, reduces
deferred tax assets to the expected amount most likely to be realized. Realization of deferred tax assets is dependent upon the
generation of a sufficient level of future taxable income and recoverable taxes paid in prior years. The income tax effects related
to settlements of share-based payment awards are reported in earnings as an increase or decrease in income tax expense. See Note
13 – Income Taxes for additional information.
The Company files a consolidated federal income tax return and a separate federal tax return for CCHL. Each subsidiary files a
separate state income tax return.
Earnings Per Common Share
Basic earnings per common share is based on net income divided by the weighted -average number of common shares outstanding
during the period excluding non-vested stock. Diluted earnings per common share include the dilutive effect of stock options and
non-vested stock awards granted using the treasury stock method. A reconciliation of the weighted-average shares used in
calculating basic earnings per common share and the weighted average common shares used in calculating diluted earnings per
common share for the reported periods is provided in Note 16 — Earnings Per Share.
Comprehensive Income
Comprehensive income includes all changes in shareowners’ equity during a period, except those resulting from transactions with
shareowners. Besides net income, other components of the Company’s comprehensive income include the after tax effect of
changes in the net unrealized gain/loss on securities AFS, unrealized gain/loss on cash flow derivatives, and changes in the funded
status of defined benefit and supplemental executive retirement plans. Comprehensive income is reported in the accompanying
Consolidated Statements of Comprehensive Income and Changes in Shareowners’ Equity.
Stock Based Compensation
Compensation cost is recognized for share-based awards issued to employees, based on the fair value of these awards at the date
of grant. Compensation cost is recognized over the requisite service period, generally defined as the vesting period. The market
price of the Company’s common stock at the date of the grant is used for restricted stock awards. For stock purchase plan awards,
a Black-Scholes model is utilized to estimate the fair value of the award. The impact of forfeitures of share-based awards on
compensation expense is recognized as forfeitures occur. See Note 14 – Stock-based Compensation for additional information.
Revenue Recognition
FASB ASC Topic 606, Revenue from Contracts with Customers (“ASC 606”), establishes principles for reporting information
about the nature, amount, timing and uncertainty of revenue and cash flows arising from the entity’s contracts to provide goods or
services to customers. The core principle requires an entity to recognize revenue to depict the transfer of goods or services to
customers in an amount that reflects the consideration that it expects to be entitled to receive in exchange for those goods or
services recognized as performance obligations are satisfied.
The majority of the Company’s revenue -generating transactions are not subject to ASC 606, including revenue generated from
financial instruments, such as our loans, letters of credit, and investment securities, and revenue related to the sale of residential
mortgages in the secondary market, as these activities are subject to other GAAP discussed elsewhere within our disclosures. The
Company recognizes revenue from these activities as it is earned based on contractual terms, as transactions occur, or as services
are provided and collectability is reasonably assured. Descriptions of the major revenue-generating activities that are within the
scope of ASC 606, which are presented in the accompanying Consolidated Statements of Income as components of non-interest
income are as follows:
Deposit Fees - these represent general service fees for monthly account maintenance and activity- or transaction-based fees and
consist of transaction-based revenue, time-based revenue (service period), item-based revenue or some other individual attribute-
based revenue. Revenue is recognized when the Company’s performance obligation is completed, which is generally monthly for
account maintenance services or when a transaction has been completed. Payment for such performance obligations are generally
received at the time the performance obligations are satisfied.
88
Wealth Management - trust fees and retail brokerage fees – trust fees represent monthly fees due from wealth management clients
as consideration for managing the client’s assets. Trust services include custody of assets, investment management, fees for trust
services and similar fiduciary activities. Revenue is recognized when the Company’s performance obligation is completed each
month or quarter, which is the time that payment is received. Also, retail brokerage fees are received from a third-party broker-
dealer, for which the Company acts as an agent, as part of a revenue-sharing agreement for fees earned from customers that are
referred to the third party. These fees are for transactional and advisory services and are paid by the third party on a monthly
basis and recognized ratably throughout the quarter as the Company’s performance obligation is satisfied.
Bank Card Fees – bank card related fees primarily includes interchange income from client use of consumer and business debit
cards. Interchange income is a fee paid by a merchant bank to the card-issuing bank through the interchange network.
Interchange fees are set by the credit card associations and are based on cardholder purchase volumes. The Company records
interchange income as transactions occur.
Gains and Losses from the Sale of Bank Owned Property – the performance obligation in the sale of other real estate owned
typically will be the delivery of control over the property to the buyer. If the Company is not providing the financing of the sale,
the transaction price is typically identified in the purchase and sale agreement. However, if the Company provides seller
financing, the Company must determine a transaction price, depending on if the sale contract is at market terms and taking into
account the credit risk inherent in the arrangement.
Insurance Commissions – insurance commissions recorded by the Company are received from various insurance carriers based on
contractual agreements to sell policies to customers on behalf of the carriers. The performance obligation for the Company is to
sell life and health insurance policies to customers. This performance obligation is met when a new policy is sold (effective date)
or when an existing policy renews. New policies and renewals generally have a one -year term. In the agreements with the
insurance carriers, a commission rate is agreed upon. The commission is recognized at the time of the sale of the policy (effective
date) or when a policy renews, which is the time that payment is received. Insurance commissions are recorded within other
noninterest income.
Other non-interest income primarily includes items such as mortgage banking fees (gains from the sale of residential mortgage
loans held for sale), bank-owned life insurance, and safe deposit box fees, none of which are subject to the requirements of ASC
606.
The Company has made no significant judgments in applying the revenue guidance prescribed in ASC 606 that affects the
determination of the amount and timing of revenue from the above-described contracts with clients.
Recently Adopted Accounting Pronouncements
ASU No. 2023-09, “Income Taxes (Topic 740): Improvements to Income Tax Disclosures.”
ASU 2023-09 is intended to enhance
transparency and decision usefulness of income tax disclosures. The ASU addresses investor requests for more transparency about
income tax information through improvements to income tax disclosures, primarily related to the rate reconciliation and income
taxes paid information. Retrospective application in all prior periods is permitted. ASU 2023-09 will be effective for the company
on January 1, 2025.
The adoption of the standard did not have a material impact on its consolidated financial statements. Refer to
Note 13 – Income Taxes.
Issued But Not Yet Effective Accounting Standards
ASU No. 2023-06, “Disclosure Improvements: Codification Amendments in Response to the SEC’s Disclosure Update and
Simplification Initiative.”
ASU 2023-06 is intended to clarify or improve disclosure and presentation requirements of a variety of
topics, which will allow users to more easily compare entities subject to the SEC’s existing disclosures with those entities that
were not previously subject to the requirements and align the requirements in the FASB accounting standard codification with the
SEC’s regulations. ASU 2023 -06 is to be applied prospectively, and early adoption is prohibited. For reporting entities subject to
the SEC’s existing disclosure requirements, the effective dates of ASU 2023-06 will be the date on which the SEC’s removal of
that related disclosure requirement from Regulation S-X or Regulation S-K becomes effective. If by June 30, 2027, the SEC has
not removed the applicable requirement from Regulation S-X or Regulation S-K, the pending content of the related amendment
will be removed from the Codification and will not become effective for any entities. The Company is currently evaluating the
provisions of the amendments and the impact on its future consolidated statements.
ASU No. 2023-03, “Income Statement — Reporting Comprehensive Income — Expense Disaggregation Disclosures (Subtopic
220-40): Disaggregation of Income Statement Expenses.”
information about certain types of expenses, including employee compensation, depreciation, intangible asset amortization, and
selling expenses. ASU 2024-03 is effective for the Company as of January 1, 2026. The Company is currently evaluating the
impact of the incremental disclosures that will be required under the standard.
89
ASU 2025-06, “Intangibles - Goodwill and Other -Internal-Use Software (Subtopic 350-40): Targeted Improvements to the
Accounting for Internal-Use Software.”
model to a principles-based approach aligned with modern development. Key provisions include new capitalization criteria based
on authorization, funding commitment, and probable completion, removal of development stages, integrated website guidance,
and enhanced disclosures. ASU 2025-06 is effective for the Company as of January 1, 2027. The Company is currently evaluating
the provisions of the amendments and the impact on its future consolidated statements and disclosures.
ASU 2025-08, “Financial Instruments—Credit Losses (Topic 326): Purchased Loans.”
purchased loans under ASC 326. The amendments expand the population of loans subject to the “gross-up” accounting model by
eliminating the former distinction between purchased credit -deteriorated (“PCD”) and non-PCD loans. Under the new guidance,
entities will apply a single model for purchased loans by recognizing an allowance for credit losses and adjusting the amortized
cost basis for the associated noncredit discount at acquisition. ASU 2025 -08 is effective for the Company as of January 1, 2027.
The Company is currently evaluating the provisions of the amendments and the impact on its future consolidated statements and
disclosures.
ASU 2025-11, “Interim Reporting (Topic 270): Narrow-Scope Improvements.”
financial reporting by defining its scope, consolidating GAAP disclosures in Topic 270, adding a principle for material post-year-
end event disclosure, and refining statement format guidance to improve consistency for all preparers. These changes do not alter
the fundamental requirements of interim reporting but seek to streamline and standardize the process. ASU 2025-11 is effective
for interim reporting periods beginning after December 15, 2027. The Company is currently evaluating the provisions of the
amendments and the impact on its future consolidated statements.
ASU 2025-12, “Codification Improvements/”
and generally streamline the Accounting Standards Codification across various topics, affecting most reporting entities, with key
changes including clarifications for diluted EPS during losses, lease receivable disclosures, beneficial interest calculations, and
treasury stock accounting, aiming for better usability without significantly altering core accounting outcomes. The Company is
currently evaluating the provisions of the amendments and the impact on its future consolidated statements. ASU 2025-12 is
effective for the Company as of January 1, 2027. The Company is currently evaluating the provisions of the amendments and the
impact on its future consolidated statements.
90
Note 2
INVESTMENT SECURITIES
Investment Portfolio Composition
. The following tables summarize the amortized cost and related fair value of investment
securities AFS and securities HTM, the corresponding amounts of gross unrealized gains and losses, and allowance for credit
losses.
Available for Sale
Amortized
Unrealized
Unrealized
Allowance for
Fair
(Dollars in Thousands)
Cost
Gains
Losses
Credit Losses
Value
December 31, 2025
U.S. Government Treasury
$
$
$
$
$
U.S. Government Agency
States and Political Subdivisions
Mortgage-Backed Securities
(1)
Corporate Debt Securities
(42 )
Other Securities
(2)
Total
$
$
$
$
(42 )
$
December 31, 2024
U.S. Government Treasury
$
$
$
$
$
U.S. Government Agency
States and Political Subdivisions
(3 )
Mortgage-Backed Securities
(1)
Corporate Debt Securities
(64 )
Other Securities
(2)
Total
$
$
$
$
(67 )
$
Held to Maturity
Amortized
Unrealized
Unrealized
Fair
(Dollars in Thousands)
Cost
Gains
Losses
Value
December 31, 2025
U.S. Government Treasury
$
$
$
$
Mortgage-Backed Securities
Total
$
$
$
$
December 31, 2024
U.S. Government Treasury
$
$
$
$
Mortgage-Backed Securities
Total
$
$
$
$
(1)
Comprised of residential mortgage-backed securities.
(2)
Includes Federal Home Loan Bank and Federal Reserve Bank recorded at cost of $
At December 31, 2025, and 2024, the investment portfolio had $
These securities do not have a readily determinable fair value and were not credit impaired.
Securities with an amortized cost of $
pledged to secure public deposits and for other purposes.
At December 31, 2025 and 2024, there were
agencies, in an amount greater than 10% of shareowners’ equity.
91
The Bank, as a member of the Federal Home Loan Bank of Atlanta (“FHLB”), is required to own capital stock in the FHLB based
generally upon the balances of residential and commercial real estate loans, and FHLB advances. FHLB stock which is included
in other securities is pledged to secure FHLB advances. No ready market exists for this stock, and it has no quoted fair value;
however, redemption of this stock has historically been at par value. As a member of the Federal Reserve Bank of Atlanta, the
Bank is required to maintain stock in the Federal Reserve Bank of Atlanta based on a specified ratio relative to the Bank’s capital.
Federal Reserve Bank stock is carried at cost.
Investment Sales
. During 2023, the Company sold $
investment securities during 2025 and 202
4.
Maturity Distribution
. The following table shows the Company’s AFS and HTM investment securities maturity distribution
based on contractual maturity at December 31, 2025. Expected maturities may differ from contractual maturities because
borrowers may have the right to call or prepay obligations. Mortgage-backed securities and certain amortizing U.S. government
agency securities are shown separately since they are not due at a certain maturity date. Equity securities do not have a
contractual maturity date.
Available for Sale
Held to Maturity
Amortized
Fair
Amortized
Fair
(Dollars in Thousands)
Cost
Value
Cost
Value
Due in one year or less
$
$
$
$
Due after one through five years
Due after five through ten years
-
-
Mortgage-Backed Securities
U.S. Government Agency
-
-
Other Securities
-
-
Total
$
$
$
$
92
Unrealized Losses
. The following table summarizes the investment securities with unrealized losses at December 31, aggregated
by major security type and length of time in a continuous unrealized loss position:
Less Than 12 Months
Greater Than 12 Months
Total
Fair
Unrealized
Fair
Unrealized
Fair
Unrealized
(Dollars in Thousands)
Value
Losses
Value
Losses
Value
Losses
December 31, 2025
Available for Sale
U.S. Government Treasury
$
$
$
$
$
$
U.S. Government Agency
States and Political Subdivisions
Mortgage-Backed Securities
Corporate Debt Securities
Total
Held to Maturity
U.S. Government Treasury
Mortgage-Backed Securities
Total
$
$
$
$
$
$
December 31, 2024
Available for Sale
U.S. Government Treasury
$
$
$
$
$
$
U.S. Government Agency
States and Political Subdivisions
Mortgage-Backed Securities
Corporate Debt Securities
Total
Held to Maturity
U.S. Government Treasury
Mortgage-Backed Securities
Total
$
$
$
$
$
$
At December 31, 2025, there were
$
losses totaling $
of the U.S. Government.
government sponsored entities. We believe the long history of
expectation of nonpayment of the amortized cost basis is
. The remaining
bonds) have a credit component. At December 31, 2025, all collateralized mortgage obligation securities (“CMO”), MBS, Small
Business Administration securities (“SBA”), U.S. Agency, and U.S. Treasury bonds held were AA1 or above rated. At December
31, 2025, corporate debt securities had an allowance for credit losses of $
ne of the securities held by the
Company were past due or in nonaccrual status at December 31, 2025.
Credit Quality Indicators
The Company monitors the credit quality of its investment securities through various risk management procedures, including the
monitoring of credit ratings. A large portion of the debt securities in the Company’s investment portfolio were issued by a U.S.
government entity or agency and are either explicitly or implicitly guaranteed by the U.S. government. The Company believes
the long history of no credit losses on these securities indicates that the expectation of nonpayment of the amortized cost basis is
zero, even if the U.S. government were to technically default. Further, certain municipal securities held by the Company have
been pre-refunded and secured by government guaranteed treasuries. Therefore, for the aforementioned securities, the Company
does
t assess or record expected credit losses due to the zero loss assumption. The Company monitors the credit quality of its
municipal and corporate securities portfolio via credit ratings which are updated on a quarterly basis. On a quarterly basis,
municipal and corporate securities in an unrealized loss position are evaluated to determine if the loss is attributable to credit
related factors and if an allowance for credit loss is needed.
93
Note 3
LOANS HELD FOR INVESTMENT AND ALLOWANCE FOR CREDIT LOSSES
Loan Portfolio Composition
. The composition of the HFI loan portfolio at December 31 was as follows:
(Dollars in Thousands)
2025
2024
Commercial, Financial and Agricultural
$
$
Real Estate – Construction
Real Estate – Commercial Mortgage
Real Estate – Residential
(1)
Real Estate – Home Equity
Consumer
(2)
Loans Held for Investment, Net of Unearned Income
$
$
(1)
Includes loans in process with outstanding balances of $
(2)
Net deferred costs, which include premiums on purchased loans, included in loans were $
$
Accrued interest receivable on loans which is excluded from amortized cost totaled $
million at December 31, 2024, and is reported separately in Other Assets.
The Company has pledged a floating lien on certain 1-4 family residential mortgage loans, commercial real estate mortgage loans,
and home equity loans to support available borrowing capacity at the FHLB and has pledged a blanket floating lien on all
consumer loans, commercial loans, and construction loans to support available borrowing capacity at the Federal Reserve Bank of
Atlanta.
Loan Purchases and Sales
. During the year ended December 31, 2025, the Company sold loans classified as held for investment
totaling $
Allowance for Credit Losses
. The methodology for estimating the amount of credit losses reported in the allowance for credit
losses (“ACL”) has two basic components: first, an asset-specific component involving loans that do not share risk characteristics
and the measurement of expected credit losses for such individual loans; and second, a pooled component for expected credit
losses for pools of loans that share similar risk characteristics. This methodology is discussed further in Note 1 – Significant
Accounting Policies.
94
The following table details the activity in the allowance for credit losses by portfolio segment for the years ended December 31.
Allocation of a portion of the allowance to one category of loans does not preclude its availability to absorb losses in other
categories.
Commercial
,
Real Estate
Financial,
Real Estate
Commercial
Real Estate
Real Estate
(Dollars in Thousands)
Agricultural
Construction
Mortgage
Residential
Home Equity
Consumer
Total
2025
Beginning Balance
$
$
$
$
$
$
$
(703 )
(782 )
(4 )
(136 )
(44 )
(5,954 )
(6,920 )
(451 )
(3,268 )
(3,585 )
Ending Balance
$
$
$
$
$
$
$
2024
Beginning Balance
$
$
$
$
$
$
$
(74 )
(173 )
(603 )
(1,512 )
(47 )
(3 )
(61 )
(132 )
(7,627 )
(9,382 )
(1,133 )
(44 )
(4,866 )
(5,665 )
Ending Balance
$
$
$
$
$
$
$
2023
Beginning Balance
$
$
$
$
$
$
$
(154 )
(233 )
(511 )
(120 )
(79 )
(39 )
(8,543 )
(9,292 )
(234 )
(68 )
(4,783 )
(4,722 )
Ending Balance
$
$
$
$
$
$
$
The $
charge-offs of $
of $
qualitative factor adjustments that were partially offset by lower loan balances. The decrease in the allowance in 2024 was
primarily due to lower new loan volume and loan balances and favorable loan grade migration. Four unemployment rate forecast
scenarios continue to be utilized to estimate probability of default and are weighted based on management’s estimate of
probability. See Note 1 – Significant accounting policies for more on the calculation of the provision for credit losses. See Note
21 – Commitments and Contingencies for information on the provision for credit losses related to off-balance sheet commitments.
95
Loan Portfolio Aging.
A loan is defined as a past due loan when one full payment is past due or a contractual maturity is over 30
days past due (“DPD”).
The following table presents the aging of the amortized cost basis in accruing past due loans by class of loans at December 31,
30-59
60-89
90 +
Total
Total
Nonaccrual
Total
(Dollars in Thousands)
DPD
DPD
DPD
Past Due
Current
Loans
Loans
2025
Commercial, Financial and Agricultural
$
$
$
$
$
$
$
Real Estate – Construction
Real Estate – Commercial Mortgage
Real Estate – Residential
Real Estate – Home Equity
Consumer
Total
$
$
$
$
$
$
$
2024
Commercial, Financial and Agricultural
$
$
$
$
$
$
$
Real Estate – Construction
Real Estate – Commercial Mortgage
Real Estate – Residential
Real Estate – Home Equity
Consumer
Total
$
$
$
$
$
$
$
Nonaccrual Loans
. Loans are generally placed on nonaccrual status if principal or interest payments become 90 days past due
and/or management deems the collectability of the principal and/or interest to be doubtful. Loans are returned to accrual status
when the principal and interest amounts contractually due are brought current or when future payments are reasonably assured.
The Company did not recognize a significant amount of interest income on nonaccrual loans for the years ended December 31,
2025 and 2024.
The following table presents the amortized cost basis of loans in nonaccrual status and loans past due over 90 days and still on
accrual by class of loans.
2025
2024
Nonaccrual
Nonaccrual
90 + Days
Nonaccrual
Nonaccrual
90 + Days
With No
With
Still
With No
With
Still
(Dollars in Thousands)
ACL
ACL
Accruing
ACL
ACL
Accruing
Commercial, Financial and Agricultural
$
$
$
$
$
$
Real Estate – Construction
Real Estate – Commercial Mortgage
Real Estate – Residential
Real Estate – Home Equity
Consumer
Total Nonaccrual Loans
$
$
$
$
$
$
96
Collateral Dependent Loans
. The following table presents the amortized cost basis of collateral dependent loans at December 31:
2025
2024
Real Estate
Non Real Estate
Real Estate
Non Real Estate
(Dollars in Thousands)
Secured
Secured
Secured
Secured
Commercial, Financial and Agricultural
$
$
$
$
Real Estate – Construction
Real Estate – Commercial Mortgage
Real Estate – Residential
Real Estate – Home Equity
Consumer
Total
$
$
$
$
A loan is collateral dependent when the borrower is experiencing financial difficulty and repayment of the loan is dependent on
the sale or operation of the underlying collateral.
The Bank’s collateral dependent loan portfolio is comprised primarily of real estate secured loans, collateralized by either
residential or commercial collateral types. The loans are carried at fair value based on current values determined by either
independent appraisals or internal evaluations, adjusted for selling costs or other amounts to be deducted when estimating
expected net sales proceeds.
Residential Real Estate Loans In Process of Foreclosure
. At December 31, 2025 and 2024, the Company had $
$
Modifications to Borrowers Experiencing Financial Difficulty
. Occasionally, the Company may modify loans to borrowers who
are experiencing financial difficulty. Loan modifications to borrowers in financial difficulty are loans in which the Company has
granted an economic concession to the borrower that it would not otherwise consider. In these instances, as part of a work-out
alternative, the Company will make concessions including the extension of the loan term, a principal moratorium, a reduction in
the interest rate, or a combination thereof. The impact of the modifications and defaults are factored into the allowance for credit
losses on a loan-by-loan basis. Thus, specific reserves are established based upon the results of either a discounted cash flow
analysis or the underlying collateral value, if the loan is deemed to be collateral dependent. A modified loan classification can be
removed if the borrower’s financial condition improves such that the borrower is no longer in financial difficulty, the loan has not
had any forgiveness of principal or interest, and the loan is subsequently refinanced or restructured at market terms and qualifies
as a new loan.
The financial effects of the loan modifications made to borrowers during the 12 months ended December 31, 2025 and 2024 were
not significant.
During the year ended December 31, 2025, the Company modified
financial difficulty.
-month interest only extension in
exchange for additional collateral and had a $
provided a
-month interest only forbearance period, and the outstanding balances at the modification date remained unchanged at
December 31, 2025. All
During the year ended December 31, 2024, the Company modified
experiencing financial difficulty. The balance of the loan at December 31, 2024 was $
interest rate on the loan by
% in addition to extending the term of the loan from
status at December 31, 2024 and did not have a payment delay as of December 31, 2024.
Credit Risk Management
. The Company has adopted comprehensive lending policies, underwriting standards and loan review
procedures designed to maximize loan income within an acceptable level of risk. Management and the Board of Directors of the
Company review and approve these policies and procedures on a regular basis (at least annually).
97
Reporting systems are used to monitor loan originations, loan quality, concentrations of credit, loan delinquencies and
nonperforming loans and potential problem loans. Management and the Credit Risk Oversight Committee periodically review
our lines of business to monitor asset quality trends and the appropriateness of credit policies. In addition, total borrower
exposure limits are established, and concentration risk is monitored. As part of this process, the overall composition of the loan
portfolio is reviewed to gauge diversification of risk, client concentrations, industry group, loan type, geographic area, or other
relevant classifications of loans. Specific segments of the loan portfolio are monitored and reported to the Board on a quarterly
basis and have strategic plans in place to supplement board-approved credit policies governing exposure limits and underwriting
standards. Detailed below are the types of loans within the Company’s loan portfolio and risk characteristics unique to each.
Commercial, Financial, and Agricultural – Loans in this category are primarily made based on identified cash flows of the
borrower with consideration given to underlying collateral and personal or other guarantees. Lending policy establishes debt
service coverage ratio limits that require a borrower’s cash flow to be sufficient to cover principal and interest payments on all
new and existing debt. The majority of these loans are secured by the assets being financed or other business assets such as
accounts receivable, inventory, or equipment. Collateral values are determined based upon third-party appraisals and evaluations.
Loan to value ratios at origination are governed by established policy guidelines.
Real Estate Construction – Loans in this category consist of short-term construction loans, revolving and non-revolving credit
lines and construction/permanent loans made to individuals and investors to finance the acquisition, development, construction or
rehabilitation of real property. These loans are primarily made based on identified cash flows of the borrower or project and
generally secured by the property being financed, including 1-4 family residential properties and commercial properties that are
either owner-occupied or investment in nature. These properties may include either vacant or improved property. Construction
loans are generally based upon estimates of costs and value associated with the completed project. Collateral values are
determined based upon third-party appraisals and evaluations. Loan to value ratios at origination are governed by established
policy guidelines. The disbursement of funds for construction loans is made in relation to the progress of the project and as such
these loans are closely monitored by on-site inspections.
Real Estate Commercial Mortgage – Loans in this category consist of commercial mortgage loans secured by property that is
either owner-occupied or investment in nature. These loans are primarily made based on identified cash flows of the borrower or
project with consideration given to underlying real estate collateral and personal guarantees. Lending policy establishes debt
service coverage ratios and loan to value ratios specific to the property type. Collateral values are determined based upon third-
party appraisals and evaluations.
Real Estate Residential – Residential mortgage loans held in the Company’s loan portfolio are made to borrowers that
demonstrate the ability to make scheduled payments with full consideration to underwriting factors such as current income,
employment status, current assets, other financial resources, credit history, and the value of the collateral. Collateral consists of
mortgage liens on 1-4 family residential properties. Collateral values are determined based upon third party appraisals and
evaluations. The Company does not originate sub-prime loans.
Real Estate Home Equity – Home equity loans and lines are made to qualified individuals for legitimate purposes generally
secured by senior or junior mortgage liens on owner-occupied 1-4 family homes or vacation homes. Borrower qualifications
include favorable credit history combined with supportive income and debt ratio requirements and combined loan to value ratios
within established policy guidelines. Collateral values are determined based upon third-party appraisals and evaluations.
Consumer Loans – This loan category includes personal installment loans, direct and indirect automobile financing, and overdraft
lines of credit. The majority of the consumer loan category consists of indirect and direct automobile loans. Lending policy
establishes maximum debt to income ratios, minimum credit scores, and includes guidelines for verification of applicants’ income
and receipt of credit reports.
Credit Quality Indicators
. As part of the ongoing monitoring of the Company’s loan portfolio quality, management categorizes
loans into risk categories based on relevant information about the ability of borrowers to service their debt such as: current
financial information, historical payment performance, credit documentation, and current economic and market trends, among
other factors. Risk ratings are assigned to each loan and revised as needed through established monitoring procedures for
individual loan relationships over a predetermined amount and review of smaller balance homogenous loan pools. The Company
uses the definitions noted below for categorizing and managing its criticized loans. Loans categorized as “Pass” do not meet the
criteria set forth below and are not considered criticized.
Special Mention – Loans in this category are presently protected from loss, but weaknesses are apparent which, if not corrected,
could cause future problems. Loans in this category may not meet required underwriting criteria and have no mitigating
factors. More than the ordinary amount of attention is warranted for these loans.
98
Substandard – Loans in this category exhibit well-defined weaknesses that would typically bring normal repayment into jeopardy.
These loans are no longer adequately protected due to well-defined weaknesses that affect the repayment capacity of the
borrower. The possibility of loss is much more evident and above average supervision is required for these loans.
Doubtful – Loans in this category have all the weaknesses inherent in a loan categorized as Substandard, with the characteristic
that the weaknesses make collection or liquidation in full, on the basis of currently existing facts, conditions, and values, highly
questionable and improbable.
Performing/Nonperforming – Loans within certain homogenous loan pools (home equity and consumer) are not individually
reviewed but are monitored for credit quality via the aging status of the loan and by payment activity. The performing or
nonperforming status is updated on an on-going basis dependent upon improvement and deterioration in credit quality.
99
The following tables summarize gross loans held for investment at December 31, 2025 and December 31, 2024 and current period
gross write-offs for each of the 12-month periods ended December 31, 2025 and December 31, 2024 by years of origination and
internally assigned credit risk ratings (refer to Credit Risk Management section for detail on risk rating system).
(Dollars in Thousands)
Term Loans by Origination Year
Revolving
December 31, 2025
2025
2024
2023
2022
2021
Prior
Loans
Total
Commercial, Financial,
Agricultural:
Pass
$
$
$
$
$
$
$
$
Special Mention
Substandard
Total
$
$
$
$
$
$
$
$
Current-Period Gross
Writeoffs
$
$
$
$
$
$
$
$
Real Estate - Construction:
Pass
$
$
$
$
$
$
$
$
Special Mention
Substandard
Total
$
$
$
$
$
$
$
$
Current-Period Gross
Writeoffs
$
$
$
$
$
$
$
$
Real Estate - Commercial
Mortgage:
Pass
$
$
$
$
$
$
$
$
Special Mention
Substandard
Total
$
$
$
$
$
$
$
$
Current-Period Gross
Writeoffs
$
$
$
$
$
$
$
$
Real Estate - Residential:
Pass
$
$
$
$
$
$
$
$
Special Mention
Substandard
Total
$
$
$
$
$
$
$
$
Current-Period Gross
Writeoffs
$
$
$
$
$
$
$
$
Real Estate - Home
Equity:
Performing
$
$
$
$
$
$
$
$
Nonperforming
Total
$
Current-Period Gross
Writeoffs
$
$
$
$
$
$
$
$
Consumer:
Performing
$
$
$
$
$
$
$
$
Nonperforming
Total
$
$
$
$
$
$
$
$
Current-Period Gross
Writeoffs
$
$
$
$
$
$
$
$
100
(Dollars in Thousands)
Term Loans by Origination Year
Revolving
December 31, 2024
2024
2023
2022
2021
2020
Prior
Loans
Total
Commercial, Financial,
Agricultural:
Pass
$
$
$
$
$
$
$
$
Special Mention
Substandard
Total
$
$
$
$
$
$
$
$
Current-Period Gross
Writeoffs
$
$
$
$
$
$
$
$
Real Estate - Construction:
Pass
$
$
$
$
$
$
$
$
Special Mention
Total
$
$
$
$
$
$
$
$
Current-Period Gross
Writeoffs
$
$
$
$
$
$
$
$
Real Estate - Commercial
Mortgage:
Pass
$
$
$
$
$
$
$
$
Special Mention
Substandard
Total
$
$
$
$
$
$
$
$
Current-Period Gross
Writeoffs
$
$
$
$
$
$
$
$
Real Estate - Residential:
Pass
$
$
$
$
$
$
$
$
Special Mention
Substandard
Total
$
$
$
$
$
$
$
$
Current-Period Gross
Writeoffs
$
$
$
$
$
$
$
$
Real Estate - Home
Equity:
Performing
$
$
$
$
$
$
$
$
Nonperforming
Total
$
Current-Period Gross
Writeoffs
$
$
$
$
$
$
$
$
Consumer:
Performing
$
$
$
$
$
$
$
$
Nonperforming
Total
$
$
$
$
$
$
$
$
Current-Period Gross
Writeoffs
$
$
$
$
$
$
$
$
101
Note 4
MORTGAGE BANKING ACTIVITIES
The Company’s mortgage banking activities include mandatory delivery loan sales, forward sales contracts used to manage
residential loan pipeline price risk, utilization of warehouse lines to fund secondary market residential loan closings, and
residential mortgage servicing.
Residential Mortgage Loan Production
The Company originates, markets, and services conventional and government-sponsored residential mortgage loans. Generally,
conforming fixed rate residential mortgage loans are held for sale in the secondary market and non-conforming and adjustable-
rate residential mortgage loans may be held for investment. The volume of residential mortgage loans originated for sale and
secondary market prices are the primary drivers of origination revenue.
Residential mortgage loan commitments are generally outstanding for 30 to 90 days, which represents the typical period from
commitment to originate a residential mortgage loan to when the closed loan is sold to an investor. Residential mortgage loan
commitments are subject to both credit and price risk. Credit risk is managed through underwriting policies and procedures,
including collateral requirements, which are generally accepted by the secondary loan markets. Price risk is primarily related to
interest rate fluctuations and is partially managed through forward sales of residential mortgage-backed securities (primarily
TBAs) or mandatory delivery commitments with investors.
The unpaid principal balance of residential mortgage loans held for sale, notional amounts of derivative contracts related to
residential mortgage loan commitments and forward contract sales and their related fair values are set forth below.
December 31, 2025
December 31, 2024
Unpaid Principal
Unpaid Principal
(Dollars in Thousands)
Balance/Notional
Fair Value
Balance/Notional
Fair Value
Residential Mortgage Loans Held for Sale
$
$
$
$
Residential Mortgage Loan Commitments
(1)
Forward Sales Contracts
(2)
(84 )
$
$
(1)
Recorded in other assets at fair value
(2)
Recorded in other liabilities and other assets at fair value at December 31, 2025 and 2024, respectively
At December 31, 2025 and 2024, the Company had
nonaccrual status.
Mortgage banking revenues for the year ended December 31, were as follows:
(Dollars in Thousands)
2025
2024
2023
Net realized gain on sales of mortgage loans
$
$
$
Net change in unrealized gain on mortgage loans held for sale
(384 )
(252 )
Net change in the fair value of mortgage loan commitments
(275 )
(296 )
Net change in the fair value of forward sales contracts
(180 )
(395 )
Pair-Offs on net settlement of forward sales contracts
(473 )
Mortgage servicing rights additions
Net origination fees
Total mortgage banking revenues
$
$
$
Residential Mortgage Servicing
The Company may retain the right to service residential mortgage loans sold. The unpaid principal balance of loans serviced for
others is the primary driver of servicing revenue.
102
The following represents a summary of mortgage servicing rights.
(Dollars in Thousands)
2025
2024
Number of residential mortgage loans serviced for others
Outstanding principal balance of residential mortgage loans serviced for others
$
$
Weighted average interest rate
Remaining contractual term (in months)
Conforming conventional loans serviced by the Company are sold to the FNMA on a non-recourse basis, whereby foreclosure
losses are generally the responsibility of FNMA and not the Company. The government loans serviced by the Company are
secured through the GNMA, whereby the Company is insured against loss by the Federal Housing Administration or partially
guaranteed against loss by the Veterans Administration. At December 31, 2025, the servicing portfolio balance consisted of the
following loan types: FNMA (
%), GNMA (
%), and private investor (
%). FNMA and private investor loans are
structured as actual/actual payment remittance.
At December 31, 2025 and 2024, the Company did
t have delinquent residential mortgage loans currently in GNMA pools
serviced by the Company. The right to repurchase these loans and the corresponding liability has been recorded in other assets
and other liabilities, respectively, in the Consolidated Statements of Financial Condition. The Company had
the 12 months ended December 31, 2025 and 2024, of GNMA delinquent or defaulted mortgage loans with the intention to
modify their terms and include the loans in new GNMA pools.
Activity in the capitalized mortgage servicing rights for the year ended December 31 was as follows:
(Dollars in Thousands)
2025
2024
2023
Beginning balance
$
$
$
Additions due to loans sold with servicing retained
Deletions and amortization
(176 )
(201 )
(232 )
Sale of Servicing Rights
(1)
(2,187 )
Ending balance
$
$
$
(1)
In 2023, the Company sold an MSR portfolio with an unpaid principal balance of $
recognizing a $
The Company did
t record any permanent impairment losses on mortgage servicing rights for the years ended December 31,
2025 and 2024.
The key unobservable inputs used in determining the fair value of the Company’s mortgage servicing rights at December 31, were
as follows:
2025
2024
Minimum
Maximum
Minimum
Maximum
Discount rates
Annual prepayment speeds
Cost of servicing (per loan)
$
$
103
Changes in residential mortgage interest rates directly affect the prepayment speeds used in valuing the Company’s mortgage
servicing rights. A separate third-party model is used to estimate prepayment speeds based on interest rates, housing turnover
rates, estimated loan curtailment, anticipated defaults, and other relevant factors. The weighted average annual prepayment speed
was
% at December 31, 2025 and
% at December 31, 2024.
Warehouse Line Borrowings
The Company has the following warehouse lines of credit and master repurchase agreements with various financial institutions at
December 31, 2025:
Amounts
(Dollars in Thousands)
Outstanding
$
, with a floor rate of
. A cash pledge deposit of $
required by the lender.
$
$
June 2026
. Interest is at the SOFR plus
to
.
$
Warehouse line borrowings are classified as short-term borrowings. At December 31, 2024, warehouse line borrowings totaled
$
warehouse lines of credit and master repurchase agreements. The above agreements also contain covenants which include certain
financial requirements, including maintenance of minimum tangible net worth, minimum liquid assets and maximum debt to net
worth ratio, as defined in the agreements. The Company was in compliance with all significant debt covenants at December 31,
2025.
The Company intends to renew the warehouse lines of credit and master repurchase agreements when they mature.
The Company extended a $
eliminated in the Company’s consolidated financial statements and thus not included in the total short-term borrowings noted on
the Consolidated Statement of Financial Condition. The line of credit was discontinued in December 2025. The balance of this
line of credit at December 31, 2024 was $
Note 5
DERIVATIVES
The Company enters into derivative financial instruments to manage exposures that arise from business activities that result in the
receipt or payment of future known and uncertain cash amounts, the value of which are determined by interest rates. The
Company’s derivative financial instruments are used to manage differences in the amount, timing, and duration of the Company’s
known or expected cash receipts and its known or expected cash payments principally related to the Company’s subordinated
debt.
Cash Flow Hedges of Interest Rate Risk
At December 31, 2024, the Company maintained interest rate swaps with notional amounts totaling $
cash flow hedge for subordinated debt. Under the swap arrangement, the Company paid a fixed interest rate of
% and
received a variable interest rate based on three-month CME Term SOFR (secured overnight financing rate). In October 2025, the
Company terminated the swaps and derecognized the derivative assets. The unrealized gain of $
accumulated other comprehensive income and will be amortized on a straight-line basis into interest expense through the
remaining term of the original cash flow hedge. The Company estimates there will be approximately $
decrease to interest expense within the next 12 months.
For derivatives designated and that qualify as cash flow hedges of interest rate risk, the gain or loss on the derivative is recorded
in accumulated other comprehensive loss (“AOCI”) and subsequently reclassified into interest expense in the same period(s)
during which the hedged transaction affects earnings. Amounts reported in accumulated other comprehensive loss related to
derivatives will be reclassified to interest expense as interest payments are made on the Company’s variable-rate subordinated
debt.
104
The following table reflects the cash flow hedges included in the Consolidated Statements of Financial Condition.
Statement of Financial
Notional
Fair
Weighted Average
(Dollars in Thousands)
Condition Location
Value
Interest rate swaps related to subordinated debt:
December 31, 2024
Other Assets
$
$
The following table presents the net gains (losses) recorded in AOCI and the Consolidated Statement of Income related to the
cash flow derivative instruments (interest rate swaps related to subordinated debt).
Amount of Gain
Amount of Gain
(Loss) Recognized
(Loss) Reclassified
(Dollars in Thousands)
Category
in AOCI
from AOCI to Income
December 31, 2025
Interest Expense
$
$
December 31, 2024
Interest Expense
$
$
December 31, 2023
Interest Expense
$
$
At December 31, 2024, the Company had a collateral liability of $
Note 6
PREMISES AND EQUIPMENT
The composition of the Company’s premises and equipment at December 31 was as follows:
(Dollars in Thousands)
2025
2024
Land
$
$
Buildings
Fixtures and Equipment
Total Premises and Equipment
Accumulated Depreciation
(106,959 )
(116,140 )
Premises and Equipment, Net
$
$
Depreciation expense for the above premises and equipment was approximately $
. million, $
2025, 2024, and 2023, respectively
.
105
Note 7
LEASES
Operating leases in which the Company is the lessee are recorded as operating lease right of use (“ROU”) assets and operating
liabilities, included in
other assets
liabilities
, respectively, on its Consolidated Statement of Financial Condition.
Operating lease ROU assets represent the Company’s right to use an underlying asset during the lease term and operating lease
liabilities represent the Company’s obligation to make lease payments arising from the lease. ROU assets and operating lease
liabilities are recognized at lease commencement based on the present value of the remaining lease payments using a discount rate
that represents the Company’s incremental borrowing rate at the lease commencement date. Operating lease expense, which is
comprised of amortization of the ROU asset and the implicit interest accreted on the operating lease liability, is recognized on a
straight-line basis over the lease term and is recorded in occupancy expense in the Consolidated Statement of Income.
The Company’s operating leases primarily relate to banking offices with remaining lease terms from
one
. The
Company’s leases are not complex and do not contain residual value guarantees, variable lease payments, or significant
assumptions or judgments made in applying the requirements of ASC Topic 842. Operating leases with an initial term of 12
months or less are not recorded on the Consolidated Statement of Financial Condition and the related lease expense is recognized
on a straight-line basis over the lease term. At December 31, 2025, the operating lease ROU assets and liabilities were $
million and $
and $
ended December 31, 2025 and 2024, respectively, for a lease that terminated in February 2025. The Company does not have any
finance leases.
The table below summarizes our lease expense and other information at December 31, related to the Company’s operating leases:
(Dollars in Thousands)
2025
2024
2023
Operating lease expense
$
$
$
Short-term lease expense
Total lease expense
$
$
$
Other information:
Cash paid for amounts included in the measurement of lease liabilities:
Operating cash flows from operating leases
$
$
$
Right-of-use assets obtained in exchange for new operating lease liabilities
Weighted-average remaining lease term — operating leases (in years)
Weighted-average discount rate — operating leases
%
%
%
The table below summarizes the maturity of remaining lease liabilities:
(Dollars in Thousands)
December 31, 2025
2026
$
2027
2028
2029
2030
2031 and thereafter
Total
$
Less: Interest
(7,350 )
Present Value of Lease Liability
$
A related party is the lessor in an operating lease with the Company. The terms of this lease agreement are further described in
Note 19 – Related Party Transactions.
In December 2024, the Company entered into a sale leaseback agreement related to the sale of an office location. This agreement
contained a
two-year
resulted in a gain on sale of $
106
Note 8
GOODWILL AND OTHER INTANGIBLES
At December 31, 2025 and 2024, the Company had goodwill of $
impairment on an annual basis, or more often if impairment indicators exist. Testing allows for a qualitative assessment of
goodwill impairment indicators. If the assessment indicates that impairment has more than likely occurred, the Company must
compare the estimated fair value of the reporting unit to its carrying amount. If the carrying amount of the reporting unit exceeds
its estimated fair value, an impairment charge is recorded equal to the excess.
On April 30, 2021, CCSW acquired substantially all of the assets of Strategic Wealth Group, LLC (“SWG”), including advisory,
service, and insurance carrier agreements, and the assignment of all related revenues thereof. Under the terms of the purchase
agreement, SWG principles became officers of CCSW and will continue the operation of their
offering wealth management services and comprehensive risk management and asset protection services for individuals and
businesses.
CCBG paid $
intangible asset (
reduction in goodwill and customer relationship
, respectively. Amortization expense related to the customer
relationship intangible totaled $
December 31, 2024 was $
The Company evaluates goodwill for impairment as defined by ASC Topic 350. During the fourth quarter of 2025, the Company
performed its annual goodwill impairment testing and determined that
Note 9
OTHER REAL ESTATE OWNED
The following table presents other real estate owned activity at December 31,
(Dollars in Thousands)
2025
2024
2023
Beginning Balance
$
$
$
Additions
Valuation Write-Downs
(28 )
(16 )
Sales
(2,827 )
(613 )
(1,926 )
Ending Balance
$
$
$
Net expenses applicable to other real estate owned for the three years ended December 31, were as follows:
(Dollars in Thousands)
2025
2024
2023
Gains from the Sale of Properties
$
(4,514 )
$
(980 )
$
(2,072 )
Losses from the Sale of Properties
Rental Income from Properties
(5 )
Property Carrying Costs
Valuation Adjustments
Total
$
(4,309 )
$
(868 )
$
(1,969 )
Note 10
DEPOSITS
The composition of the Company’s interest bearing deposits at December 31 was as follows:
(Dollars in Thousands)
2025
2024
NOW Accounts
$
$
Money Market Accounts
Savings Deposits
Time Deposits
Total Interest Bearing Deposits
$
$
At December 31, 2025 and 2024, $
107
The amount of time deposits that meet or exceed the FDIC insurance limit of $250,000 totaled $
December 31, 2025 and 2024, respectively.
At December 31, the scheduled maturities of time deposits were as follows:
(Dollars in Thousands)
2025
2026
$
2027
2028
2029
2030
Total
$
Interest expense on deposits for the three years ended December 31 was as follows:
(Dollars in Thousands)
2025
2024
2023
NOW Accounts
$
$
$
Money Market Accounts
Savings Deposits
Time Deposits < $250,000
Time Deposits > $250,000
Total Interest Expense
$
$
$
Note 11
SHORT-TERM BORROWINGS
Short-term borrowings included the following:
(Dollars in Thousands)
Federal Funds
Purchased
Securities
Sold Under
Repurchase
Agreements
(1)
Other
Short-Term
Borrowings
(2)
2025
Balance at December 31
$
$
$
Maximum indebtedness at any month end
Daily average indebtedness outstanding
Average rate paid for the year
%
%
%
Average rate paid on period-end borrowings
%
%
%
2024
Balance at December 31
$
$
$
Maximum indebtedness at any month end
Daily average indebtedness outstanding
Average rate paid for the year
%
%
%
Average rate paid on period-end borrowings
%
%
%
2023
Balance at December 31
$
$
$
Maximum indebtedness at any month end
Daily average indebtedness outstanding
Average rate paid for the year
%
%
%
Average rate paid on period-end borrowings
%
%
%
(1)
Balances are fully collateralized by government treasury or agency securities held in the Company's investment portfolio.
(2)
Comprised of warehouse lines of credit totaling $
108
Note 12
LONG-TERM BORROWINGS
Federal Home Loan Bank Advances.
The Company had one FHLB long-term advance for $
This outstanding balance was reclassified to Short-Term Borrowings in 2024,
advances are collateralized by a floating lien on certain 1-4 family residential mortgage loans, commercial real estate mortgage
loans, and home equity mortgage loans. Interest on the FHLB advances is paid on a monthly basis.
Long-term Notes Payable
. During 2024, the Company entered into
vendor for its retail brokerage platform. The notes mature in 2031 and accrue interest at the minimum federal rate per annum
published by the Internal Revenue Service. The notes are forgivable in annual installments commencing
issuance date. For the year ended December 31, 2025, $
notes payable was $
Junior Subordinated Deferrable Interest Notes.
The Company has issued
wholly owned Delaware statutory trusts. The first note for $
for $
Company is not the primary beneficiary. Accordingly, the accounts of the trusts are not included in the Company’s consolidated
financial statements. See Note 1 - Significant Accounting Policies for additional information about the Company’s consolidation
policy. Details of the Company’s transaction with the two trusts are provided below.
In November 2004, CCBG Capital Trust I issued $
of the trust. The interest payments are due quarterly and adjust quarterly to a variable rate of
margin of
%. The trust preferred securities will mature on
, and are redeemable upon approval of the
Federal Reserve in whole or in part at the option of the Company at any time after December 31, 2009 and in whole at any time
upon occurrence of certain events affecting their tax or regulatory capital treatment. Distributions on the trust preferred securities
are payable quarterly on March 31, June 30, September 30, and December 31 of each year. CCBG Capital Trust I also issued
$
securities were used to purchase a $
terms similar to the trust preferred securities. On April 12, 2016, the Company retired $
preferred securities that were auctioned as part of a liquidation of a pooled collateralized debt obligation fund. During the second
quarter of 2025, the Company made a principal payment of $
originally issued through CCBG Capital Trust I.
In May 2005, CCBG Capital Trust II issued $
trust. The interest payments are due quarterly and adjusted quarterly to a variable rate of
margin of
%. The trust preferred securities will mature on
, and are redeemable upon approval of the Federal
Reserve in whole or in part at the option of the Company and in whole at any time upon occurrence of certain events affecting
their tax or regulatory capital treatment. Distributions on the trust preferred securities are payable quarterly on March 15, June
15, September 15, and December 15 of each year. CCBG Capital Trust II also issued $
CCBG. The proceeds of the offering of trust preferred securities and common equity securities were used to purchase a $
million junior subordinated deferrable interest note issued by the Company, which has terms substantially similar to the trust
preferred securities. During the second quarter of 2025, the Company made a principal payment of $
The Company has the right to defer payments of interest on the two notes at any time or from time to time for a period of up to
twenty consecutive quarterly interest payment periods. Under the terms of each note, in the event that under certain
circumstances there is an event of default under the note or the Company has elected to defer interest on the note, the Company
may not, with certain exceptions, declare or pay any dividends or distributions on its capital stock or purchase or acquire any of
its capital stock. At December 31, 2025, the Company has paid all interest payments in full.
The Company has entered into agreements to guarantee the payments of distributions on the trust preferred securities and
payments of redemption of the trust preferred securities. Under these agreements, the Company also agrees, on a subordinated
basis, to pay expenses and liabilities of the two trusts other than those arising under the trust preferred securities. The obligations
of the Company under the two junior subordinated notes, the trust agreements establishing the two trusts, the guarantee and
agreement as to expenses and liabilities, in aggregate, constitute a full and unconditional guarantee by the Company of the two
trusts’ obligations under the two trust preferred security issuances.
Despite the fact that the accounts of CCBG Capital Trust I and CCBG Capital Trust II are not included in the Company’s
consolidated financial statements, the $
subsidiary trusts are included in the Tier 1 Capital of Capital City Bank Group, Inc. as allowed by Federal Reserve guidelines.
109
Note 13
INCOME TAXES
The provision for income taxes reflected in the Consolidated Statements of Comprehensive Income is comprised of the following
components:
(Dollars in Thousands)
2025
2024
2023
Current:
Federal
$
$
$
State
Deferred:
Federal
(877 )
(391 )
State
(116 )
(351 )
Change in Valuation Allowance
(161 )
(39 )
(1,032 )
(483 )
Total:
Federal
State
Change in Valuation Allowance
(161 )
(39 )
Total
$
$
$
Income taxes provided were different than the tax expense computed by applying the statutory federal income tax rate of
% to
pre-tax income as a result of the following:
(Dollars in Thousands)
2025
2024
2023
Tax Expense at Federal Statutory Rate
$
%
$
%
$
%
State Taxes, Net of Federal Benefit
(1)
Federal Tax Credits: Renewable Energy
(2)
(2,093 )
(3.2 )
(1,938 )
(3.0 )
Nontaxable or Nondeductible Items:
Tax Exempt Interest Income, Net of Interest Expense
Disallowance
(120 )
(0.1 )
(161 )
(0.3 )
(259 )
(0.4 )
Tax-Exempt Cash Surrender Value Life Insurance
Benefit
(211 )
(0.3 )
(201 )
(0.3 )
(187 )
(0.3 )
Other
Changes in Unrecognized Tax Benefits
Other Adjustments:
Noncontrolling Interest
Other Items, Net
(220 )
(0.3 )
(242 )
(0.4 )
Actual Tax Expense
$
%
$
%
$
%
(1)
(2)
in earlier periods and tax expense in later periods as the investment yield is recognized.
Deferred income tax liabilities and assets result from differences between assets and liabilities measured for financial reporting
purposes and for income tax return purposes. These assets and liabilities are measured using the enacted tax rates and laws that
are currently in effect.
110
The net deferred tax asset and the temporary differences comprising that balance at December 31, 2025 and 2024 are as follows:
(Dollars in Thousands)
2025
2024
Deferred Tax Assets Attributable to:
Allowance for Credit Losses
$
$
State Net Operating Loss and Tax Credit Carry-Forwards
Other Real Estate Owned
Accrued SERP Liability
Lease Liability
Net Unrealized Losses on Investment Securities
Investment in Partnership
Other
Total Deferred Tax Assets
$
$
Deferred Tax Liabilities Attributable to:
Depreciation on Premises and Equipment
$
$
Deferred Loan Fees and Costs
Intangible Assets
Accrued Pension/SERP
Accrued Pension Liability
Right of Use Asset
Investments
Other
Total Deferred Tax Liabilities
Valuation Allowance
Net Deferred Tax Asset
$
$
In the opinion of management, it is more likely than not that all of the deferred tax assets, with the exception of certain state net
operating loss carry-forwards and certain state tax credit carry-forwards expected to expire prior to utilization, will be realized.
Accordingly, a valuation allowance of $
respectively. At December 31, 2025, the Company had state loss and tax credit carry-forwards of approximately $
which expire at various dates from
202
6 through
2037
.
The following table presents a reconciliation of the beginning and ending amount of unrecognized tax benefits:.
(Dollars in Thousands)
2025
2024
2023
Balance at January 1,
$
$
$
Additions Based on Tax Positions Related to Current Year
Balance at December 31
$
$
$
Of this total, $
effective tax rate in future periods. The Company does not expect the total amount of unrecognized tax benefits to significantly
increase or decrease in the next 12 months.
It is the Company’s policy to recognize interest and penalties accrued relative to unrecognized tax benefits in their respective
federal or state income taxes accounts. There were
Statements of Income for the years ended December 31, 2025, 2024, and 2023. There were
Consolidated Statements of Financial Condition for penalties and interest as of December 31, 2025 and 2024.
The Company files a consolidated U.S. federal income tax return and a separate U.S. federal income tax return for CCHL. Each
subsidiary files various returns in states where its banking offices are located. The Company is generally no longer subject to
U.S. federal or state tax examinations for years before 2022.
111
Note 14
STOCK-BASED COMPENSATION
At December 31, 2025, the Company had three stock-based compensation plans, consisting of the 2021 Associate Incentive Plan
(“AIP”), the 2021 Associate Stock Purchase Plan (“ASPP”), and the 2021 Director Stock Purchase Plan (“DSPP”). These plans,
which were approved by the shareowners in April 2021, replaced substantially similar plans approved by the shareowners in
2011. Total compensation expense associated with these plans for the years ended December 31, 2025, 2024 and 2023 was $
million, $
AIP.
there were
AIP, will create an annual incentive plan (“Plan”), under which all participants are eligible to earn performance shares. Awards to
associates under the 2021 Plan were tied to internally established goals. At base level targets, the grant-date fair value of the
shares eligible to be awarded in 2025 was approximately $
issuance, but additional shares could be earned if performance exceeded established goals. A total of
for 2025 that were issued in January 2026. For the years ended December 31, 2025, 2024 and 2023, Directors earned
,
million for the years ended December 31, 2025, 2024 and 2023, respectively , related to the AIP.
Executive Long-Term Incentive Plan (“LTIP”)
. The Company has established a Performance Share Unit Plan under the
provisions of the AIP that allows William G. Smith, Jr., the Chairman and Chief Executive Officer of CCBG, Inc, Thomas A.
Barron, the President of CCBG, Inc., and Bethany Corum, the President of CCB, to earn shares based on the compound annual
growth rate in diluted earnings per share over a three-year period. The Company recognized expense of $
million, and $
,
, and
earned in 2025 that were issued in January 2026.
After deducting the shares earned, but not issued, in 2025 under the AIP and LTIP,
under the 2021 AIP.
DSPP.
The Company’s DSPP allows the directors to purchase the Company’s common stock at a price equal to
% of the
closing price on the date of purchase. Stock purchases under the DSPP are limited to the amount of the directors’ annual retainer
and meeting fees. Under the DSPP, there were
expense under the DSPP for each of the years ended December 31, 2025, 2024 and 2023. The Company issued shares under the
DSPP totaling
,
2025, there were
ASPP.
Under the Company’s ASPP, substantially all associates may purchase the Company’s common stock through payroll
deductions at a price equal to
% of the lower of the fair market value at the beginning or end of each six-month offering
period. Stock purchases under the ASPP are limited to
% of an associate’s eligible compensation, up to a maximum of $
(fair market value on each enrollment date) in any plan year. Under the ASPP, there were
reserved for issuance. The Company recognized $
of the years ended December 31, 2025, 2024 and 2023, respectively. The Company issued shares under the ASPP totaling
,
shares remained eligible for issuance under the ASPP.
Based on the Black-Scholes option pricing model, the weighted average estimated fair value of each of the purchase rights
granted under the ASPP was $
$
, respectively. In calculating compensation, the fair value of each stock purchase right was estimated on the date
of grant using the following weighted average assumptions:
2025
2024
2023
Dividend yield
%
%
%
Expected volatility
%
%
%
Risk-free interest rate
%
%
%
Expected life (in years)
112
Note 15
EMPLOYEE BENEFIT PLANS
Pension Plan
The Company sponsors a noncontributory pension plan covering a portion of its associates. On December 30, 2019, the plan was
amended to remove plan eligibility for new associates hired after December 31, 2019. There were no amendments to the Plan in
2020 or 2021. The Plan was also amended in December 2022, effective January 1, 2020, increasing the required minimum
distribution age to
, per the SECURE Act 1.0. During 2023 and effective January 1, 2023, the Plan was amended increasing the
required minimum distribution age to
, per the SECURE Act 2.0. Benefits under this plan generally are based on the associate’s
total years of service and average of the
five
departure. The Company’s general funding policy is to contribute amounts sufficient to meet minimum funding requirements as
set by law and to ensure deductibility for federal income tax purposes.
The following table details on a consolidated basis the changes in benefit obligation, changes in plan assets, the funded status of
the plan, components of pension expense, amounts recognized in the Company’s Consolidated Statements of Financial Condition,
and major assumptions used to determine these amounts.
113
(Dollars in Thousands)
2025
2024
2023
Change in Projected Benefit Obligation:
Benefit Obligation at Beginning of Year
$
$
$
Service Cost
Interest Cost
Actuarial Loss (Gain)
(1,974 )
Benefits Paid
(2,320 )
(4,829 )
(3,843 )
Expenses Paid
(368 )
(277 )
(276 )
Settlements
(12,600 )
Projected Benefit Obligation at End of Year
$
$
$
Change in Plan Assets:
Fair Value of Plan Assets at Beginning of Year
$
$
$
Actual Return on Plan Assets
Employer Contributions
Benefits Paid
(2,320 )
(4,829 )
(3,843 )
Expenses Paid
(368 )
(277 )
(276 )
Settlements
(12,600 )
Fair Value of Plan Assets at End of Year
$
$
$
Funded Status of Plan and Prepaid Asset Recognized at End of Year:
Other Assets
$
$
$
Accumulated Benefit Obligation at End of Year
$
$
$
Components of Net Periodic Benefit (Income) Costs:
Service Cost
$
$
$
Interest Cost
Expected Return on Plan Assets
(9,058 )
(8,117 )
(6,805 )
Amortization of Prior Service Costs
Net (Gain) Loss Amortization
(1,654 )
Net Gain Settlements
(1,552 )
Net Periodic Benefit (Income) Cost
$
(2,117 )
$
$
Weighted-Average Assumptions Used to Determine Benefit Obligation:
Discount Rate
Rate of Compensation Increase
(1)
Measurement Date
12/31/25
12/31/24
12/31/23
Weighted-Average Assumptions Used to Determine Benefit Cost:
Discount Rate
Expected Return on Plan Assets
Rate of Compensation Increase
(1)
Amortization Amounts from Accumulated Other Comprehensive Income:
Net Actuarial Gain
$
(5,085 )
$
(14,145 )
$
(5,397 )
Prior Service Cost
(5 )
Net Gain (Loss)
(165 )
(934 )
Deferred Tax Expense
Other Comprehensive Income, net of tax
$
(1,403 )
$
(10,682 )
$
(4,730 )
Amounts Recognized in Accumulated Other Comprehensive (Income) Loss:
Net Actuarial (Gain) Loss
$
(14,867 )
$
(12,988 )
$
Deferred Tax Expense (Benefit)
(335 )
Accumulated Other Comprehensive (Income) Loss, net of tax
$
(11,098 )
$
(9,695 )
$
(1)
114
During 2025, lump sum payments made under the Company’s defined benefit pension plan triggered settlement accounting,
which resulted in a $
Company recorded
The service cost component of net periodic benefit cost is reflected in compensation expense in the accompanying Consolidated
Statements of Income. The other components of net periodic cost are included in “other” within the noninterest expense category
in the Consolidated Statements of Income. See Note 1 – Significant Accounting Policies for additional information.
The Company expects to recognize $
December 31, 2025 as a component of net periodic benefit cost during 202 6.
Plan Assets.
The Company’s pension plan asset allocation at December 31, 2025 and 2024, and the target asset allocation at
December 31, 2025 are as follows:
Target
Percentage of Plan
Allocation
Assets at December 31
(1)
2026
2025
2024
Equity Securities
%
%
%
Debt Securities
%
%
%
Cash and Cash Equivalents
(2)
%
%
%
Total
%
%
%
(1)
Represents asset allocation at December 31 which may differ from the average target allocation for the year due to the year-
end cash contribution to the plan.
(2)
Cash levels will be maintained in the Plan sufficient to fund expected distributions.
The Company’s pension plan assets are overseen by the CCBG Retirement Committee. Capital City Trust Company acts as the
investment manager for the plan. The investment strategy is to maximize return on investments while minimizing risk. The
Company believes the best way to accomplish this goal is to take a conservative approach to its investment strategy by investing
in mutual funds that include various high-grade equity securities and investment -grade debt issuances with varying investment
strategies. The target asset allocation will periodically be adjusted based on market conditions. For the majority of 2025, the
target asset allocation was within the following investment allocation ranges: equity securities ranging from
% and
%, debt
securities ranging from
% and
%, and cash and cash equivalents ranging from
% and
%. In December 2025, the target
asset allocation was changed to the following:
% equity securities and
% fixed income. Cash levels will be maintained in the
Plan sufficient to fund expected distributions. The overall expected long-term rate of return on assets is a weighted-average
expectation for the return on plan assets. The Company considers historical performance data and economic/financial data to
arrive at expected long-term rates of return for each asset category.
The major categories of assets in the Company’s pension plan at December 31 are presented in the following table. Assets are
segregated by the level of the valuation inputs within the fair value hierarchy established by ASC Topic 820 utilized to measure
fair value (see Note 22 – Fair Value Measurements).
(Dollars in Thousands)
2025
2024
Level 1:
U.S. Treasury Securities
$
$
Mutual Funds
Cash and Cash Equivalents
Level 2:
Corporate Notes/Bonds
Total Fair Value of Plan Assets
$
$
115
Expected Benefit Payments.
follows:
(Dollars in Thousands)
2025
2026
$
2027
2028
2029
2030
2031 through 2035
Total
$
Contributions.
The following table details the amounts contributed to the pension plan in 2025 and 2024, and the expected
amount to be contributed in 2026.
Expected
Contribution
(Dollars in Thousands)
2024
2025
2026
(1)
Actual Contributions
$
$
$
(1)
Supplemental Executive Retirement Plan
The Company has a Supplemental Executive Retirement Plan (“SERP”) and a Supplemental Executive Retirement Plan II
(“SERP II”) covering selected executive officers. Benefits under this plan generally are based on the same service and
compensation as used for the pension plan, except the benefits are calculated without regard to the limits set by the Internal
Revenue Code on compensation and benefits. The net benefit payable from the SERP is the difference between this gross benefit
and the benefit payable by the pension plan. The SERP II was adopted by the Company’s Board on May 21, 2020 and covers
certain executive officers that were not covered by the SERP.
116
The following table details on a consolidated basis the changes in benefit obligation, the funded status of the plan, components of
pension expense, amounts recognized in the Company’s Consolidated Statements of Financial Condition, and major assumptions
used to determine these amounts.
(Dollars in Thousands)
2025
2024
2023
Change in Projected Benefit Obligation:
Benefit Obligation at Beginning of Year
$
$
$
Service Cost
Interest Cost
Actuarial Loss
Plan Amendments
Net Settlements
(2,464 )
Projected Benefit Obligation at End of Year
$
$
$
Funded Status of Plan and Accrued Liability Recognized at End of Year:
Other Liabilities
$
$
$
Accumulated Benefit Obligation at End of Year
$
$
$
Components of Net Periodic Benefit Costs:
Service Cost
$
$
$
Interest Cost
Amortization of Prior Service Cost
Net Gain Amortization
(117 )
(281 )
(531 )
Net Gain Settlements
(291 )
Net Periodic Benefit Cost
$
$
$
(152 )
Weighted-Average Assumptions Used to Determine Benefit Obligation:
Discount Rate
Rate of Compensation Increase
(1)
Measurement Date
12/31/25
12/31/24
12/31/23
Weighted-Average Assumptions Used to Determine Benefit Cost:
Discount Rate
Rate of Compensation Increase
(1)
Amortization Amounts from Accumulated Other Comprehensive Loss:
Net Actuarial Loss
$
$
$
Prior Service (Cost) Benefit
(102 )
(151 )
Net Gain
Settlement Gain
Deferred Tax Benefit
(571 )
(183 )
(222 )
Other Comprehensive Loss, net of tax
$
$
$
Amounts Recognized in Accumulated Other Comprehensive Loss (Income):
Net Actuarial Loss (Gain)
$
$
(275 )
$
(753 )
Prior Service Cost
Deferred Tax (Benefit) Expense
(563 )
Accumulated Other Comprehensive Loss (Income), net of tax
$
$
(27 )
$
(562 )
(1)
The Company expects to recognize approximately $
comprehensive loss at December 31, 2025 as a component of net periodic benefit cost during 2026.
In June 2023, lump sum retirement distributions to two plan participants required the application of settlement accounting. The
amount of the settlement gain was $
117
Expected Benefit Payments
. As of December 31, expected benefit payments related to the SERP were as follows:
(Dollars in Thousands)
2025
2026
$
2027
2028
2029
2030
2031 through 2035
Total
$
401(k) Plan
The Company has a 401(k) Plan which enables CCB and CCBG associates to defer a portion of their salary on a pre-tax
basis. The plan covers substantially all associates of the Company who meet minimum age requirements. The plan is designed to
enable participants to contribute any amount, up to the maximum annual limit allowed by the IRS, of their compensation withheld
in any plan year placed in the 401(k) Plan trust account. Matching contributions of
% from the Company are made on
participant’s contributions for up to
% of eligible compensation for eligible associates. Further, in addition to the
% match, all
associates hired after December 31, 2019, will receive
% of their eligible compensation as a nonelective contribution on each
payroll period. For 2025, the Company made total 401(k) contributions of $
total 401(k) contributions of $
into thirty-two investment options available to 401(k) participants, including the Company’s common stock. A total of
shares of CCBG common stock have been reserved for issuance. Shares issued to participants have historically been purchased in
the open market.
Effective January 1, 2025, the Company amended its 401(k) Plan to merge and include associates of the CCHL 401(k) Plan, at
which time the CCHL 401(k) Plan was terminated. The CCHL 401(k) Plan was previously available to all associates employed
by CCHL. Prior to the termination, the plan allowed participants to contribute any amount, up to the maximum annual limit
allowed by the IRS, of their compensation withheld in any plan year placed in the 401(k) Plan trust account. A discretionary
matching contribution was determined annually by CCHL. For 2024 and 2023, matching contributions were made by CCHL up
to
% of eligible participant’s compensation totaling $
Other Plans
The Company has an Amended and Restated Dividend Reinvestment Plan (the “DRIP”). The DRIP is an “Open Market Only”
plan, which means that shares that participants receive under the DRIP will only be purchased by the plan agent in the open
market. The Company did
t issue any new shares under the DRIP in 2025, 2024 and 2023.
Note 16
EARNINGS PER SHARE
The following table sets forth the computation of basic and diluted earnings per share:
(Dollars and Per Share Data in Thousands)
2025
2024
2023
Numerator:
Net Income Attributable to Common Shareowners
$
$
$
Denominator:
Denominator for Basic Earnings Per Share Weighted -Average Shares
Effects of Dilutive Securities Stock Compensation Plans
Denominator for Diluted Earnings Per Share Adjusted Weighted -Average
Basic Earnings Per Share
$
$
$
Diluted Earnings Per Share
$
$
$
118
Note 17
REGULATORY MATTERS
Regulatory Capital Requirements
. The Company (on a consolidated basis) and the Bank are subject to various regulatory capital
requirements administered by the federal banking agencies. Failure to meet minimum capital requirements can initiate certain
mandatory and possible additional discretionary actions by regulators that, if undertaken, could have a direct material effect on
the Company and Bank’s financial statements. Under capital adequacy guidelines and the regulatory framework for prompt
corrective action
,
the Company and the Bank must meet specific capital guidelines that involve quantitative measures of their
assets, liabilities and certain off-balance sheet items as calculated under regulatory accounting practices. The capital amounts and
classification are also subject to qualitative judgments by the regulators about components, risk weightings, and other factors.
Prompt corrective action provisions are not applicable to bank holding companies. A detailed description of these regulatory
capital requirements is provided in the section captioned “Regulatory Considerations – Capital Regulations” section on page 14.
Management believes, at December 31, 2025 and 2024, that the Company and the Bank meet all capital adequacy requirements to
which they are subject. At December 31, 2025, the most recent notification from the Federal Deposit Insurance Corporation
categorized the Bank as well capitalized under the regulatory framework for prompt corrective action. To be categorized as well
capitalized, an institution must maintain minimum common equity Tier 1, total risk-based, Tier 1 risk based and Tier 1 leverage
ratios as set forth in the following tables. There are no conditions or events since the notification that management believes have
changed the Bank’s category. The Company and Bank’s actual capital amounts and ratios at December 31, 2025 and 2024 are
presented in the following table.
119
To Be Well -
Capitalized Under
Required
Prompt
For Capital
Corrective
Actual
Adequacy Purposes
Action Provisions
(Dollars in Thousands)
Amount
Ratio
Amount
Ratio
Amount
Ratio
2025
Common Equity Tier 1:
CCBG
$
$
*
*
CCB
$
Tier 1 Capital:
CCBG
*
*
CCB
Total Capital:
CCBG
*
*
CCB
Tier 1 Leverage:
CCBG
*
*
CCB
2024
Common Equity Tier 1:
CCBG
$
$
*
*
CCB
$
Tier 1 Capital:
CCBG
*
*
CCB
Total Capital:
CCBG
*
*
CCB
Tier 1 Leverage:
CCBG
*
*
CCB
* Not applicable to bank holding companies.
Dividend Restrictions
. In the ordinary course of business, the Company is dependent upon dividends from its banking subsidiary
to provide funds for the payment of dividends to shareowners and to provide for other cash requirements. Banking regulations
may limit the amount of dividends that may be paid. Approval by regulatory authorities is required if the effect of dividends
declared would cause the regulatory capital of the Company’s banking subsidiary to fall below specified minimum levels.
Approval is also required if dividends declared exceed the net profits of the banking subsidiary for that year combined with the
retained net profits for the preceding two years. In 2026, the bank subsidiary may declare dividends without regulatory approval
of $
such dividend declaration.
120
Note 18
ACCUMULATED OTHER COMPREHENSIVE LOSS
FASB Topic ASC 220, “Comprehensive Income” requires that certain transactions and other economic events that bypass the
Consolidated Statements of Income be displayed as other comprehensive income. Total comprehensive income is reported in
the Consolidated Statements of Comprehensive Income (net of tax) and Changes in Shareowners’ Equity (net of tax).
The following table shows the amounts allocated to accumulated other comprehensive loss.
Accumulated
Securities
Other
Available
Interest Rate
Retirement
Comprehensive
for Sale
Swap
Plans
Loss
Balance as of January 1, 2025
$
(20,179 )
$
$
$
(6,486 )
Other comprehensive income (loss) during the period
(1,295 )
(281 )
Balance as of December 31, 2025
$
(9,530 )
$
$
$
Balance as of January 1, 2024
$
(25,691 )
$
$
(425 )
$
(22,146 )
Other comprehensive income during the period
Balance as of December 31, 2024
$
(20,179 )
$
$
$
(6,486 )
Balance as of January 1, 2023
$
(37,349 )
$
$
(4,505 )
$
(37,229 )
Other comprehensive income (loss) during the period
(655 )
Balance as of December 31, 2023
$
(25,691 )
$
$
(425 )
$
(22,146 )
Note 19
RELATED PARTY TRANSACTIONS
At December 31, 2025 and 2024, certain officers and directors were indebted to the Bank in the aggregate amount of $
and $
repayments totaled $
Deposits from certain directors, executive officers, and their related interests totaled $
31, 2025 and 2024, respectively.
The Company leases land from a partnership (Smith Interests General Partnership L.L.P.) in which William G. Smith, Jr. has an
interest. The Company made lease payments totaling $
December 2023 the lease payments adjusted to $
Company. The payments under the lease agreement provide for annual lease payments of approximately $
through December 2033, and thereafter, increase by
% every
on reappraisal of the parcel rental value. The Company then has
with rental increases of
% at each extension. Further, in accordance with this lease agreement, the Company made payments of
$
development of subject property to support the construction of a new banking office by the Company.
William G. Smith, III, the son of our Chairman and Chief Executive Officer, William G. Smith, Jr., is employed as Chief Lending
Officer at Capital City Bank. In 2025, William G. Smith, III’s total compensation (consisting of annual base salary, annual
bonus, and stock-based compensation) was determined in accordance with the Company’s standard employment and
compensation practices applicable to associates with similar responsibilities and positions.
121
Note 20
OTHER NONINTEREST EXPENSE
Components of other noninterest expense in excess of
% of the sum of total interest income and noninterest income, which are
not disclosed separately elsewhere, are presented below for each of the respective years.
(Dollars in Thousands)
2025
2024
2023
Legal Fees
$
$
$
Professional Fees
Telephone
Advertising
Processing Services
Insurance – Other
Pension – Other
(3,489 )
(1,675 )
Pension – Settlement
(1,552 )
(291 )
Other
Total
$
Note 21
COMMITMENTS AND CONTINGENCIES
Lending Commitments
. The Company is a party to financial instruments with off-balance sheet risks in the normal course of
business to meet the financing needs of its clients. These financial instruments consist of commitments to extend credit and
standby letters of credit.
The Company’s maximum exposure to credit loss under standby letters of credit and commitments to extend credit is
represented by the contractual amount of those instruments. The Company uses the same credit policies in establishing
commitments and issuing letters of credit as it does for on-balance sheet instruments. At December 31, the amounts associated
with the Company’s off-balance sheet obligations were as follows:
2025
2024
(Dollars in Thousands)
Fixed
Variable
Total
Fixed
Variable
Total
Commitments to Extend Credit
(1)
$
$
$
$
$
$
Standby Letters of Credit
Total
$
$
$
$
$
$
(1)
Commitments to extend credit are agreements to lend to a client so long as there is no violation of any condition established in
the contract. Commitments generally have fixed expiration dates or other termination clauses and may require payment of a fee.
Since many of the commitments are expected to expire without being drawn upon, the total commitment amounts do not
necessarily represent future cash requirements.
Standby letters of credit are conditional commitments issued by the Company to guarantee the performance of a client to a third
party. The credit risk involved in issuing letters of credit is essentially the same as that involved in extending loan facilities. In
general, management does not anticipate any material losses as a result of participating in these types of transactions. However,
any potential losses arising from such transactions are reserved for in the same manner as management reserves for their other
credit facilities.
For both on- and off-balance sheet financial instruments, the Company requires collateral to support such instruments when it is
deemed necessary. The Company evaluates each client’s creditworthiness on a case-by-case basis. The amount of collateral
obtained upon extension of credit is based on management’s credit evaluation of the counterparty. Collateral held varies but
may include deposits held in financial institutions; U.S. Treasury securities; other marketable securities; real estate; accounts
receivable; property, plant and equipment; and inventory.
The allowance for credit losses for off-balance sheet credit commitments that are not unconditionally cancellable by the Bank is
adjusted as a provision for credit loss expense and is recorded in other liabilities. The following table shows the activity in the
allowance.
122
(Dollars in Thousands)
2025
2024
2023
Beginning Balance
$
$
$
Provision for Credit Losses
(48 )
(1,036 )
Ending Balance
$
$
$
Other Commitments
. In the normal course of business, the Company enters into lease commitments which are classified as
operating leases. See Note 7 – Leases for additional information on the maturity of the Company’s operating lease commitments.
The Company has an outstanding commitment of up to $
funding technology solutions for community banks. At December 31, 2025, the amount remaining to be funded for the bank tech
venture capital commitment was $
Contingencies
. The Company is a party to lawsuits and claims arising out of the normal course of business. In management’s
opinion, there are
material effect on the consolidated results of operations, financial position, or cash flows of the Company.
Indemnification Obligation
. The Company is a member of the Visa U.S.A. network. Visa U.S.A believes that its member banks
are required to indemnify it for potential future settlement of certain litigation (the “Covered Litigation”) that relates to several
antitrust lawsuits challenging the practices of Visa and MasterCard International. In 2008, the Company, as a member of the Visa
U.S.A. network, obtained Class B shares of Visa, Inc. upon its initial public offering. Since its initial public offering, Visa, Inc.
has funded a litigation reserve for the Covered Litigation resulting in a reduction in the Class B shares held by the Company.
During the first quarter of 2011, the Company sold its remaining Class B shares. Associated with this sale, the Company entered
into a swap contract with the purchaser of the shares that requires a payment to the counterparty in the event that Visa, Inc. makes
subsequent revisions to the conversion ratio for its Class B shares. Fixed charges included in the swap liability are payable
quarterly until the litigation reserve is fully liquidated and at which time the aforementioned swap contract will be terminated.
Conversion ratio payments and ongoing fixed quarterly charges are reflected in earnings in the period incurred. Quarterly fixed
payments totaled $
million in 2025 due to a revision to the share conversion rate related to additional funding by VISA of the merchant litigation
reserve. There was a $
conversion rate related to additional funding by VISA of the merchant litigation reserve. At December 31, 2024, there was
amounts payable.
Note 22
FAIR VALUE MEASUREMENTS
The fair value of an asset or liability is the exchange price that would be received were the Bank to sell that asset or paid to
transfer that liability (exit price) in an orderly transaction occurring in the principal market (or most advantageous market in the
absence of a principal market) for such asset or liability. In estimating fair value, the Company utilizes valuation techniques that
are consistent with the market approach, the income approach and/or the cost approach. Such valuation techniques are
consistently applied. Inputs to valuation techniques include the assumptions that market participants would use in pricing an asset
or liability. ASC Topic 820 establishes a fair value hierarchy for valuation inputs that gives the highest priority to quoted prices
in active markets for identical assets or liabilities and the lowest priority to unobservable inputs. The fair value hierarchy is as
follows:
●
Level 1 Inputs -
Unadjusted quoted prices in active markets for identical assets or liabilities that the reporting entity has
the ability to access at the measurement date
.
●
Level 2 Inputs -
Inputs other than quoted prices included in Level 1 that are observable for the asset or liability, either
directly or indirectly. These might include quoted prices for similar assets or liabilities in active markets, quoted prices
for identical or similar assets or liabilities in markets that are not active, inputs other than quoted prices that are
observable for the asset or liability (such as interest rates, volatilities, prepayment speeds, credit risks, etc.) or inputs that
are derived principally from, or corroborated, by market data by correlation or other means
.
●
Level 3 Inputs -
Unobservable inputs for determining the fair values of assets or liabilities that reflect an entity’s own
assumptions about the assumptions that market participants would use in pricing the assets or liabilities.
123
Assets and Liabilities Measured at Fair Value on a Recurring Basis
Securities Available for Sale.
U.S. Treasury securities are reported at fair value utilizing Level 1 inputs. Other securities
classified as AFS are reported at fair value utilizing Level 2 inputs. For these securities, the Company obtains fair value
measurements from an independent pricing service. The fair value measurements consider observable data that may include
dealer quotes, market spreads, cash flows, the U.S. Treasury yield curve, live trading levels, trade execution data, credit
information and the bond’s terms and conditions, among other things.
In general, the Company does not purchase securities that have a complicated structure. The Company’s entire portfolio consists
of traditional investments, nearly all of which are U.S. Treasury obligations, federal agency bullet or mortgage pass-through
securities, or general obligation or revenue based municipal bonds. Pricing for such instruments is easily obtained. At least
annually, the Company will validate prices supplied by the independent pricing service by comparing them to prices obtained
from an independent third-party source.
Equity Securities.
Investments securities classified as equity securities are carried at cost and the share of earnings or losses is
reported through net income as an adjustment to the investment balance. These securities are not readily marketable and therefore
are classified as a Level 3 input within the fair value hierarchy.
Loans Held for Sale
. The fair value of residential mortgage loans held for sale based on Level 2 inputs is determined, when
possible, using either quoted secondary-market prices or investor commitments. If no such quoted price exists, the fair value is
determined using quoted prices for a similar asset or assets, adjusted for the specific attributes of that loan, which would be used
by other market participants. The Company has elected the fair value option accounting for its held for sale loans.
Mortgage Banking Derivative Instruments.
The fair values of IRLCs are derived by valuation models incorporating market
pricing for instruments with similar characteristics, commonly referred to as best execution pricing, or investor commitment
prices for best effort IRLCs which have unobservable inputs, such as an estimate of the fair value of the servicing rights expected
to be recorded upon sale of the loans, net estimated costs to originate the loans, and the pull-through rate, and are therefore
classified as Level 3 within the fair value hierarchy. The fair value of forward sale commitments is based on observable market
pricing for similar instruments and are therefore classified as Level 2 within the fair value hierarchy.
Interest Rate Swap.
The Company’s derivative positions are classified as Level 2 within the fair value hierarchy and are valued
using models generally accepted in the financial services industry and that use actively quoted or observable market input values
from external market data providers. The fair value derivatives are determined using discounted cash flow models.
Fair Value Swap
. The Company entered into a stand-alone derivative contract with the purchaser of its Visa Class B shares. The
valuation represents the amount due and payable to the counterparty based upon the revised share conversion rate, if any, during
the period. There was $
December 31, 2024.
124
A summary of fair values for assets and liabilities at December 31 consisted of the following:
(Dollars in Thousands)
Level 1
Level 2
Level 3
Total Fair
Inputs
Inputs
Inputs
Value
2025
ASSETS:
Securities Available for Sale:
U.S. Government Treasury
$
$
$
$
U.S. Government Agency
States and Political Subdivisions
Mortgage-Backed Securities
Corporate Debt Securities
Equity Securities
Loans Held for Sale
Residential Mortgage Loan Commitments ("IRLC")
LIABILITIES:
Forward Sales Contracts
2024
ASSETS:
Securities Available for Sale:
U.S. Government Treasury
$
$
$
$
U.S. Government Agency
State and Political Subdivisions
Mortgage-Backed Securities
Corporate Debt Securities
Equity Securities
Loans Held for Sale
Interest Rate Swap Derivative
Forward Sales Contracts
Residential Mortgage Loan Commitments ("IRLC")
Mortgage Banking Activities.
The Company had Level 3 issuances and transfers related to mortgage banking activities of $
million and $
transfers related to mortgage banking activities of $
2024. Issuances are valued based on the change in fair value of the underlying mortgage loan from inception of the IRLC to the
statement of financial condition date, adjusted for pull-through rates and costs to originate. IRLCs transferred out of Level 3
represent IRLCs that were funded and moved to mortgage loans held for sale, at fair value.
Assets Measured at Fair Value on a Non-Recurring Basis
Certain assets are measured at fair value on a non-recurring basis (i.e., the assets are not measured at fair value on an ongoing
basis but are subject to fair value adjustments in certain circumstances). An example would be assets exhibiting evidence of
impairment. The following is a description of valuation methodologies used for assets measured on a non-recurring basis.
Collateral Dependent Loans
. Impairment for collateral dependent loans is measured using the fair value of the collateral less
selling costs. The fair value of collateral is determined by an independent valuation or professional appraisal in conformance with
banking regulations. Collateral values are estimated using Level 3 inputs due to the volatility in the real estate market, and the
judgment and estimation involved in the real estate appraisal process. Collateral dependent loans are reviewed and evaluated on
at least a quarterly basis for additional impairment and adjusted accordingly. Valuation techniques are consistent with those
techniques applied in prior periods. Collateral dependent loans had a carrying value of $
$
$
125
Other Real Estate Owned
. During 2025 and 2024, certain foreclosed assets, upon initial recognition, were measured and reported
at fair value through a charge-off to the allowance for credit losses based on the fair value of the foreclosed asset less estimated
cost to sell. At December 31, 2025 and 2024, these assets were recorded at fair value, which is determined by an independent
valuation or professional appraisal in conformance with banking regulations. On an ongoing basis, we obtain updated appraisals
on foreclosed assets and record valuation adjustments as necessary. The fair value of foreclosed assets is estimated using Level 3
inputs due to the judgment and estimation involved in the real estate valuation process.
Mortgage Servicing Rights
. Residential mortgage loan servicing rights are evaluated for impairment at each reporting period
based upon the fair value of the rights as compared to the carrying amount. Fair value is determined by a third-party valuation
model using estimated prepayment speeds of the underlying mortgage loans serviced and stratifications based on the risk
characteristics of the underlying loans (predominantly loan type and note interest rate). The fair value is estimated using Level 3
inputs, including a discount rate, weighted average prepayment speed, and the cost of loan servicing. Further detail on the key
inputs utilized are provided in Note 4 – Mortgage Banking Activities. At December 31, 2025 and 2024, there was
allowance for mortgage servicing rights.
Other Fair Value Disclosures
The Company is required to disclose the estimated fair value of financial instruments, both assets and liabilities, for which it is
practical to estimate fair value and the following is a description of valuation methodologies used for those assets and liabilities.
Cash and Short-Term Investments.
The carrying amount of cash and short-term investments is used to approximate fair value,
given the short time frame to maturity and as such assets do not present unanticipated credit concerns.
Securities Held to Maturity
. Securities held to maturity are valued in accordance with the methodology previously noted in the
caption “Assets and Liabilities Measured at Fair Value on a Recurring Basis – Securities Available for Sale”.
Other Equity Securities.
Other equity securities are accounted for under the equity method (Topic 323) and recorded at cost.
These securities are not readily marketable securities and are reflected in Other Assets on the Statement of Financial Condition.
Loans.
techniques based upon projected cash flows and estimated discount rates. Pursuant to the adoption of ASU 2016-01,
Recognition
and Measurement of Financial Assets and Financial Liabilities
, the values reported reflect the incorporation of a liquidity
discount to meet the objective of “exit price” valuation.
Deposits.
the amounts payable on demand at the reporting date. The fair value of fixed maturity certificates of deposit is estimated using
present value techniques and rates currently offered for deposits of similar remaining maturities.
Subordinated Notes Payable.
flows and estimated discount rates as well as rates being offered for similar obligations.
Short-Term and Long-Term Borrowings.
projected cash flows and estimated discount rates as well as rates being offered for similar debt.
126
A summary of estimated fair values of significant financial instruments at December 31 consisted of the following:
2025
(Dollars in Thousands)
Carrying
Level 1
Level 2
Level 3
Value
Inputs
Inputs
Inputs
ASSETS:
Cash
$
$
$
$
Fed Funds Sold and Interest Bearing Deposits
Investment Securities, Held to Maturity
Other Equity Securities
(1)
Mortgage Servicing Rights
Loans, Net of Allowance for Credit Losses
LIABILITIES:
Deposits
$
$
$
$
Short-Term Borrowings
Subordinated Notes Payable
Long-Term Borrowings
2024
(Dollars in Thousands)
Carrying
Level 1
Level 2
Level 3
Value
Inputs
Inputs
Inputs
ASSETS:
Cash
$
$
$
$
Short-Term Investments
Investment Securities, Held to Maturity
Other Equity Securities
(1)
Mortgage Servicing Rights
Loans, Net of Allowance for Credit Losses
LIABILITIES:
Deposits
$
$
$
$
Short-Term Borrowings
Subordinated Notes Payable
Long-Term Borrowings
(1)
Accounted for under the equity method – not readily marketable securities – reflected in other assets.
All non-financial instruments are excluded from the above table. The disclosures also do not include goodwill. Accordingly, the
aggregate fair value amounts presented do not represent the underlying value of the Company.
127
Note 23
PARENT COMPANY FINANCIAL INFORMATION
The following are condensed statements of financial condition of the parent company at December 31:
Parent Company Statements of Financial Condition
(Dollars in Thousands, Except Per Share Data)
2025
2024
ASSETS
Cash and Due From Subsidiary Bank
$
$
Equity Securities
Investment in Subsidiary Bank
Goodwill and Other Intangibles
Other Assets
Total Assets
$
$
LIABILITIES
Subordinated Notes Payable
$
$
Other Liabilities
Total Liabilities
SHAREOWNERS’ EQUITY
Common Stock, $
shares issued and outstanding at December 31, 2025 and 2024, respectively
Additional Paid-In Capital
Retained Earnings
Accumulated Other Comprehensive Income (Loss), Net of Tax
(6,486 )
Total Shareowners’ Equity
Total Liabilities and Shareowners’ Equity
$
$
128
The operating results of the parent company for the three years ended December 31 are shown below:
Parent Company Statements of Operations
(Dollars in Thousands)
2025
2024
2023
OPERATING INCOME
Income Received from Subsidiary Bank:
Administrative Fees
$
$
$
Dividends
Other Income
Total Operating Income
OPERATING EXPENSE
Salaries and Associate Benefits
Interest on Subordinated Notes Payable
Professional Fees
Advertising
Legal Fees
Other
Total Operating Expense
Earnings Before Income Taxes and Equity in Undistributed
Earnings of Subsidiary Bank
Income Tax Benefit
(234 )
(828 )
(650 )
Earnings Before Equity in Undistributed Earnings of Subsidiary Bank
Equity in Undistributed Earnings of Subsidiary Bank
Net Income Attributable to Common Shareowners
$
$
$
129
The cash flows for the parent company for the three years ended December 31 were as follows:
Parent Company Statements of Cash Flows
(Dollars in Thousands)
2025
2024
2023
CASH FLOWS FROM OPERATING ACTIVITIES:
Net Income Attributable to Common Shareowners
$
$
$
Adjustments to Reconcile Net Income to Net Cash Provided By
Equity in Undistributed Earnings of Subsidiary Bank
(26,917 )
(22,867 )
(24,898 )
Gain on sale of subsidiary
(773 )
Stock Compensation
Amortization of Intangible Asset
Increase in Other Assets
(117 )
Increase in Other Liabilities
(5,016 )
(6,191 )
(1,557 )
Net Cash Provided By Operating Activities
$
CASH FROM INVESTING ACTIVITIES:
Purchase of Equity Securities
$
$
(52 )
(369 )
Decrease in Investment in Subsidiaries
Net Cash Received for Divestitures
Net Cash (Used in) Provided by Investing Activities
$
$
(52 )
$
(369 )
CASH FROM FINANCING ACTIVITIES:
Principal Payments of Subordinated Notes
(10,305 )
Dividends Paid
(17,063 )
(14,906 )
(12,905 )
Issuance of Common Stock Under Compensation Plans
Payments to Repurchase Common Stock
(2,330 )
(3,710 )
Net Cash Used In Financing Activities
$
(26,027 )
$
(15,735 )
$
(15,678 )
Net Increase in Cash and Due from Subsidiary Bank
Cash and Due from Subsidiary Bank at Beginning of Year
Cash and Due from Subsidiary Bank at End of Year
$
$
$
Note 24
SEGMENT REPORTING
The Company operates a single reportable business segment that is comprised of commercial banking within the states of Florida,
Georgia, and Alabama. The Company’s CEO is deemed the Chief Operating Decision Maker (“CODM”). The CODM evaluates
the financial performance of the Company by evaluating revenue streams, significant expenses, and budget to actual results in
assessing the Company’s single reporting segment and in the determination of allocating resources. The CODM uses consolidated
net income to benchmark the Company against peers and to evaluate performance and allocate resources. Significant revenue and
expense categories evaluated by the CODM are consistent with the presentation of the Consolidated Statement of Income and
components of other noninterest expense as presented in Note 20.
130
Item 9.
Changes in and Disagreements with Accountants on Accounting and Financial Disclosure
None.
Item 9A. Controls and Procedures
Evaluation of Disclosure Controls and Procedures for 2025.
At December 31, 2025, the end of the period covered by this
Annual Report on Form 10-K, our management, including our Chief Executive Officer and Chief Financial Officer, evaluated the
effectiveness of our disclosure controls and procedures (as defined in Rule 13a-15(e) under the Securities Exchange Act of 1934).
Based upon that evaluation, our Chief Executive Officer and Chief Financial Officer each concluded that our disclosure controls
and procedures were effective as of December 31, 202 5.
Management’s Report on Internal Control Over Financial Reporting.
Our management is responsible for establishing and
maintaining effective internal control over financial reporting (as such term is defined in Rule 13a-15(f) under the Securities
Exchange Act of 1934). Internal control over financial reporting is a process designed to provide reasonable assurance regarding
the reliability of financial reporting and the preparation of financial statements for external purposes in accordance with U.S.
generally accepted accounting principles.
Internal control over financial reporting cannot provide absolute assurance of achieving financial reporting objectives because of
its inherent limitations. Internal control over financial reporting is a process that involves human diligence and compliance and is
subject to lapses in judgment and breakdowns resulting from human failures. Internal control over financial reporting can also be
circumvented by collusion or improper management override. Because of such limitations, there is a risk that material
misstatements may not be prevented or detected on a timely basis by internal control over financial reporting. However, these
inherent limitations are known features of the financial reporting process. Therefore, it is possible to design into the process
safeguards to reduce, though not eliminate, this risk.
Management is also responsible for the preparation and fair presentation of the consolidated financial statements and other
financial information contained in this report. The accompanying consolidated financial statements were prepared in conformity
with U.S. generally accepted accounting principles and include, as necessary, best estimates and judgments by management.
Under the supervision and with the participation of management, including the Chief Executive Officer and Chief Financial
Officer, we conducted an evaluation of the effectiveness of internal control over financial reporting based on the framework in
Internal Control—Integrated Framework issued by the Committee of Sponsoring Organizations of the Treadway Commission
(2013 framework) (the COSO criteria). Based on this evaluation under the framework in Internal Control - Integrated
Framework, our management has concluded that our internal control over financial reporting, as such term is defined in Exchange
Act Rule 13a-15(f), was effective as of December 31, 2025.
Forvis Mazars, LLP, an independent registered public accounting firm, has audited our consolidated financial statements as of and
for the year ended December 31, 2025, and opined as to the effectiveness of internal control over financial reporting at December
31, 2025, as stated in its report, which is included herein on page 131.
Change in Internal Control.
There have been no changes in our internal control during our most recently completed fiscal quarter
that materially affected, or are likely to materially affect, our internal control over financial reporting.
131
Report of Independent Registered Public Accounting Firm
Shareowners, Board of Directors, and Audit Committee
Capital City Bank Group, Inc.
Tallahassee, Florida
Opinion on the Internal Control Over Financial Reporting
We have audited Capital City Bank Group, Inc.’s (Company) internal control over financial reporting as of December 31, 2025
based on criteria established in Internal Control – Integrated Framework: (2013) issued by the Committee of Sponsoring
Organizations of the Treadway Commission (COSO). In our opinion, the Company maintained, in all material respects, effective
internal control over financial reporting as of December 31, 2025, based on criteria established in Internal Control – Integrated
Framework: (2013) issued by the Committee of Sponsoring Organizations of the Treadway Commission (COSO).
We also have audited, in accordance with the standards of the Public Company Accounting Oversight Board (United States)
(“PCAOB”), the consolidated financial statements of the Company as of December 31, 2025 and 2024, and for each of the three
years in the period ended December 31, 2025, and our report dated February 27, 2026 expressed an unqualified opinion on those
consolidated financial statements.
Basis for Opinion
The Company’s management is responsible for maintaining effective internal control over financial reporting and for its
assessment of the effectiveness of internal control over financial reporting, included in the accompanying Management’s Report
on Internal Control Over Financial Reporting. Our responsibility is to express an opinion on the Company’s internal control over
financial reporting based on our audit.
We are a public accounting firm registered with the PCAOB and are required to be independent with respect to the Company in
accordance with the U.S. federal securities laws and the applicable rules and regulations of the Securities and Exchange
Commission and the PCAOB.
We conducted our audit in accordance with the standards of the PCAOB. Those standards require that we plan and perform the
audit to obtain reasonable assurance about whether effective internal control over financial reporting was maintained in all
material respects. Our audit included obtaining an understanding of internal control over financial reporting, assessing the risk
that a material weakness exists, and testing and evaluating the design and operating effectiveness of internal control based on the
assessed risk. Our audit also included performing such other procedures as we considered necessary in the circumstances. We
believe that our audit provides a reasonable basis for our opinion.
Definitions and Limitations of Internal Control Over Financial Reporting
A company’s internal control over financial reporting is a process designed to provide reasonable assurance regarding the
reliability of financial reporting and the preparation of reliable consolidated financial statements in accordance with accounting
principles generally accepted in the United States of America. A company’s internal control over financial reporting includes
those policies and procedures that (1) pertain to the maintenance of records that, in reasonable detail, accurately and fairly reflect
the transactions and dispositions of the assets of the company; (2) provide reasonable assurance that transactions are recorded as
necessary to permit preparation of consolidated financial statements in accordance with accounting principles generally accepted
in the United States of America, and that receipts and expenditures of the company are being made only in accordance with
authorizations of management and directors of the company; and (3) provide reasonable assurance regarding prevention, or timely
detection and correction of unauthorized acquisition, use, or disposition of the company’s assets that could have a material effect
on the consolidated financial statements.
Because of its inherent limitations, internal control over financial reporting may not prevent or detect misstatements. Also,
projections of any evaluation of effectiveness to future periods are subject to the risk that controls may become inadequate
because of changes in conditions or that the degree of compliance with the policies or procedures may deteriorate.
/s/ Forvis Mazars, LLP
Little Rock, Arkansas
February 27, 2026
132
Item 9B. Other Information
During the three months ended December 31, 2025,
Exchange Act) adopted or
intended to satisfy the affirmative defense conditions of Rule 10b5-1(c) under the Exchange Act or
arrangement” as defined in Item 408(c) of Regulation S-K.
Item 9C. Disclosure Regarding Foreign Jurisdictions that Prevent Inspections
None.
133
Part III
Item 10. Directors, Executive Officers, and Corporate Governance
The information required by this item is incorporated herein by reference to the Proxy Statement for the Registrant’s 2026 Annual
Meeting of Shareowners, which will be filed with the SEC no later than 120 days after December 31, 2025.
Insider Trading Policy
The Company has
Company’s securities by directors, officers, associates, and agents, or the Company itself, that are reasonably designed to promote
compliance with insider training laws, rules and regulations, and any listing standards applicable to the Company. A copy of the
Company’s Insider Trading Policy has been filed as Exhibit 19 to this Annual Report on Form 10-K.
Item 11. Executive Compensation
The information required by this item is incorporated herein by reference to the Proxy Statement for the Registrant’s 2026 Annual
Meeting of Shareowners, which will be filed with the SEC no later than 120 days after December 31, 2025.
Item 12. Security Ownership of Certain Beneficial Owners and Management and Related Shareowners Matters.
The information required by this item is incorporated herein by reference to the Proxy Statement for the Registrant’s 2026 Annual
Meeting of Shareowners, which will be filed with the SEC no later than 120 days after December 31, 2025.
Item 13.
Certain Relationships and Related Transactions, and Director Independence
The information required by this item is incorporated herein by reference to the Proxy Statement for the Registrant’s 2026 Annual
Meeting of Shareowners, which will be filed with the SEC no later than 120 days after December 31, 2025.
Item 14.
Principal Accountant Fees and Services
The information required by this item is incorporated herein by reference to the Proxy Statement for the Registrant’s 2026 Annual
Meeting of Shareowners, which will be filed with the SEC no later than 120 days after December 31, 2025.
134
PART IV
Item 15. Exhibits and Financial Statement Schedules
The following documents are filed as part of this report
Consolidated Statements of Changes in Shareowners’ Equity for Fiscal Years 2025, 2024, and 2023
Other schedules and exhibits are omitted because the required information either is not applicable or is shown in the
financial statements or the notes thereto.
Reg. S-K
Exhibit
Table
Item No. Description of Exhibit
3.1
3.2
4.1 See Exhibits 3.1 and 3.2 for provisions of Amended and Restated Articles of Incorporation and
Amended and Restated Bylaws, which define the rights of the Registrant’s shareowners.
4.2
4.3
4.4
4.5 In accordance with Regulation S-K, Item 601(b)(4)(iii)(A) certain instruments defining the rights of
holders of long-term debt of Capital City Bank Group, Inc. not exceeding 10% of the total assets of
Capital City Bank Group, Inc. and its consolidated subsidiaries have been omitted. The Registrant
agrees to furnish a copy of any such instruments to the Commission upon request.
10.1
10.2
10.3
10.4
10.5
135
10.6
19
21
23
31.1
31.2
32.1
32.2
97
101.SCH XBRL Taxonomy Extension Schema Document*
101.CAL XBRL Taxonomy Extension Calculation Linkbase Document*
101.LAB XBRL Taxonomy Extension Label Linkbase Document*
101.PRE XBRL Taxonomy Extension Presentation Linkbase Document*
101.DEF XBRL Taxonomy Extension Definition Linkbase Document*
104 Cover Page Interactive Data File (formatted as Inline XBRL and contained in Exhibit 101)
*
Filed electronically herewith.
Item 16. Form 10-K Summary
None.
136
Signatures
Pursuant to the requirements of Section 13 or 15(d) of the Securities Exchange Act of 1934, the registrant has duly caused this
report to be signed on February 27, 2026, on its behalf by the undersigned, thereunto duly authorized.
CAPITAL CITY BANK GROUP, INC.
/s/ William G. Smith, Jr.
William G. Smith, Jr.
Chairman and Chief Executive Officer
(Principal Executive Officer)
Pursuant to the requirements of the Securities Exchange Act of 1934, this report has been signed on February 27, 2026 by the
following persons in the capacities indicated.
/s/ William G. Smith, Jr.
William G. Smith, Jr.
Chairman and Chief Executive Officer
(Principal Executive Officer)
/s/ Jeptha E. Larkin
Jeptha E. Larkin
Executive Vice President and Chief Financial Officer
(Principal Financial and Accounting Officer)
137
Pursuant to the requirements of Section 13 or 15(d) of the Securities Exchange Act of 1934, the registrant has duly caused this
report to be signed on February 27, 2026, on its behalf by the undersigned, thereunto duly authorized.
Directors:
/s/ Robert Antoine
/s/ Bonnie J. Davenport
/s/ Thomas A. Barron
/s/ William Eric Grant
William Eric Grant
/s/ William F. Butler
/s/ Laura L. Johnson
/s/ Stanley W. Connally, Jr.
/s/ John G. Sample, Jr.
/s/ Marshall M. Criser III
/s/ William G. Smith, Jr.
/s/ Kimberly A. Crowell
/s/ Ashbel C. Williams