NASDAQ:CCBG Investor Presentation First Quarter 2019
Forward - Looking Statement 2 This presentation includes forward - looking statements, including statements about future results. These statements are subject to uncertainties and risks, which could cause the Company’s future results to differ materially. The following factors, among others, could cause the Company’s actual results to differ : Our ability to successfully manage interest rate risk, liquidity risk, and other risks inherent to our industry; legislative or regulator y c hanges, including the Dodd - Frank Act, Basel III, and the ability to repay and qualified mortgage standards; the effects of security breaches and c omputer viruses that may affect our computer systems or fraud related to debit card products; the accuracy of our financial statement es timates and assumptions, including the estimates used for our loan loss provision, deferred tax asset valuation and pension plan; the fr equency and magnitude of foreclosure of our loans; the effects of our lack of a diversified loan portfolio, including the risks of ge ogr aphic and industry concentrations; the strength of the United States economy in general and the strength of the local economies in whic h w e conduct operations; our ability to declare and pay dividends, the payment of which is now subject to our compliance with real es tate markets; changes in monetary and fiscal policies of the U.S. Government; inflation, interest rate, market and monetary fluctu ati ons; the effects of harsh weather conditions, including hurricanes, and man - made disasters; our ability to comply with the extensive laws and regulations to which we are subject, including the laws for each jurisdiction where we operate; the willingness of clients to ac cept third - party products and services rather than our products and services and vice versa; increased competition and its effect on pri cin g; technological changes; negative publicity and the impact on our reputation; changes in consumer spending and saving habits; g row th and profitability of our noninterest income; changes in accounting principles, policies, practices or guidelines; the limited tra din g activity of our common stock; the concentration of ownership of our common stock; anti - takeover provisions under federal and state law as well a s our Articles of Incorporation and our Bylaws; other risksdescribed from time to time in our filings with the Securities and Exchange Commission; and our ability to manage the risks involved in the foregoing. Additional factors can be found in the Company’s Annual Report on Form 10 - K for the fiscal year ended December 31, 2018, and the Company ’ others filings with the SEC, which are available at the SEC’s internet site ( http://www.sec.gov ). Forward - looking statements in this presentation speak only as of the date of this presentation. The Company assumes no obligation to Update forward - looking statements or the reasons why actual results could differ.
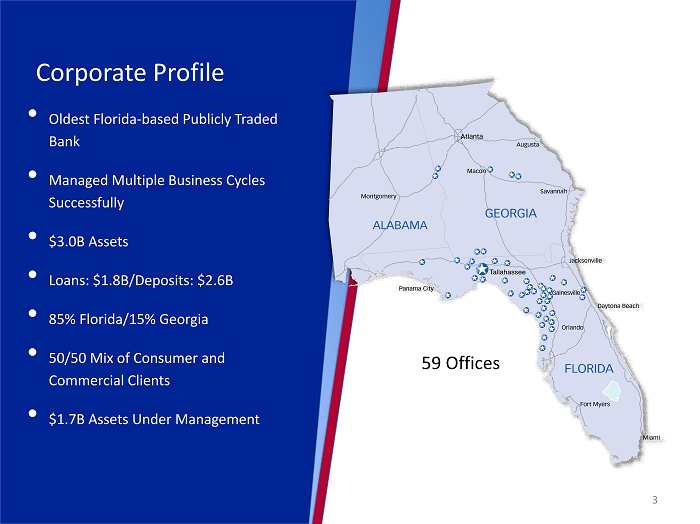
• Oldest Florida - based Publicly Traded Bank • Managed Multiple Business Cycles Successfully • $3.0B Assets • Loans: $ 1.8B/Deposits : $ 2.6B • 85% Florida/15% Georgia • 50/50 Mix of Consumer and Commercial Clients • $1.7B Assets Under Management 59 Offices Corporate Profile 3
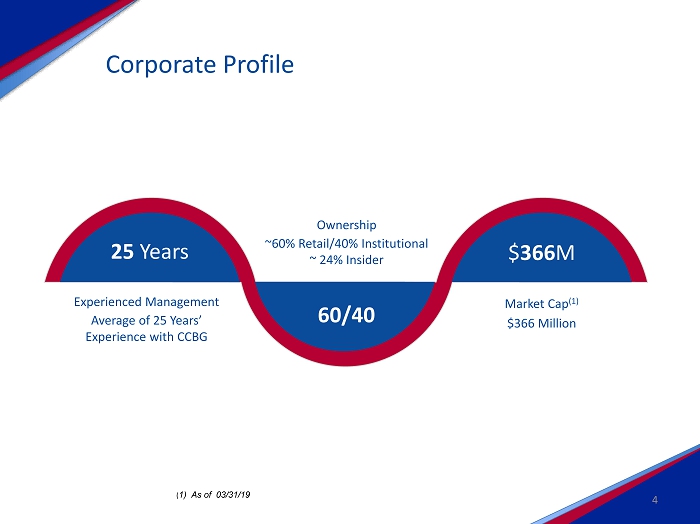
Market Cap (1) $366 Million 25 Years 60/40 Experienced Management Average of 25 Years’ Experience with CCBG Ownership ~60% Retail/40% Institutional ~ 24% Insider $ 366 M Corporate Profile 4 ( 1) As of 03/31/19
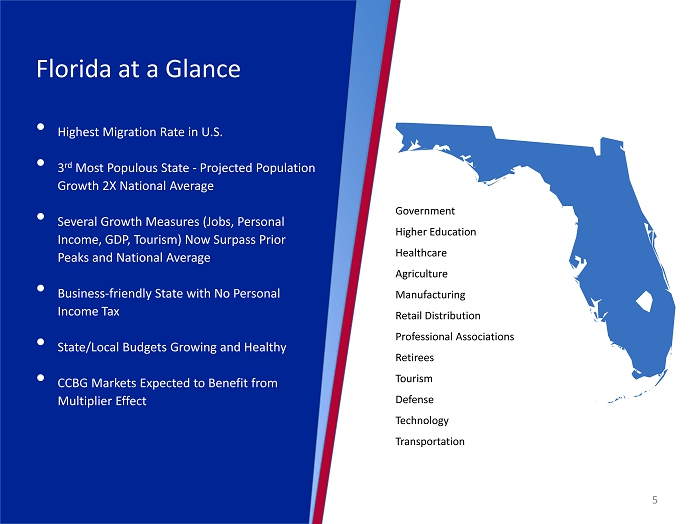
• Highest Migration Rate in U.S. • 3 rd Most Populous State - Projected Population Growth 2X National Average • Several Growth Measures (Jobs, Personal Income, GDP, Tourism) Now Surpass Prior Peaks and National Average • Business - friendly State with No Personal Income Tax • State /Local Budgets Growing and Healthy • CCBG Markets Expected to Benefit from Multiplier Effect Florida at a Glance 5 Government Higher Education Healthcare Agriculture Manufacturing Retail Distribution Professional Associations Retirees Tourism Defense Technology Transportation
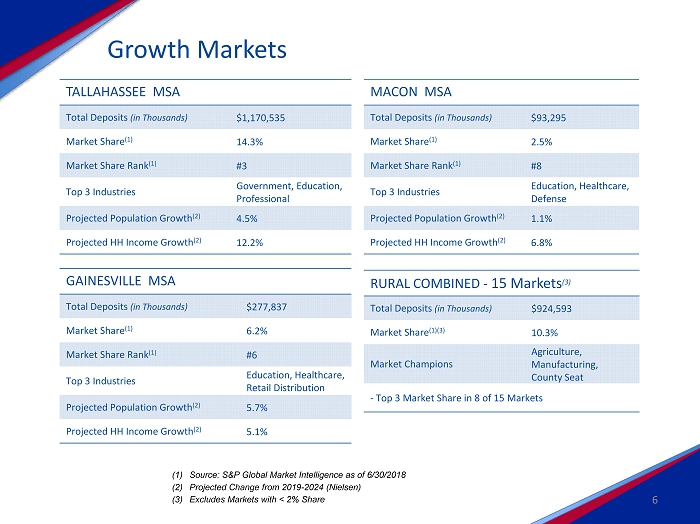
Growth Markets TALLAHASSEE MSA Total Deposits (in Thousands) $1,170,535 Market Share (1) 14.3% Market Share Rank (1) #3 Top 3 Industries Government, Education, Professional Projected Population Growth (2) 4.5% Projected HH Income Growth (2) 12.2% GAINESVILLE MSA Total Deposits (in Thousands) $277,837 Market Share (1) 6.2% Market Share Rank (1) #6 Top 3 Industries Education, Healthcare, Retail Distribution Projected Population Growth (2) 5.7% Projected HH Income Growth (2) 5.1% MACON MSA Total Deposits (in Thousands) $93,295 Market Share (1) 2.5% Market Share Rank (1) #8 Top 3 Industries Education, Healthcare, Defense Projected Population Growth (2) 1.1% Projected HH Income Growth (2) 6.8% RURAL COMBINED - 15 Markets (3) Total Deposits (in Thousands) $924,593 Market Share (1)(3) 10.3% Market Champions Agriculture, Manufacturing, County Seat - Top 3 Market Share in 8 of 15 Markets 6 (1) Source: S&P Global Market Intelligence as of 6/30/2018 (2) Projected Change from 2019 - 2024 (Nielsen) (3) Excludes Markets with < 2% Share
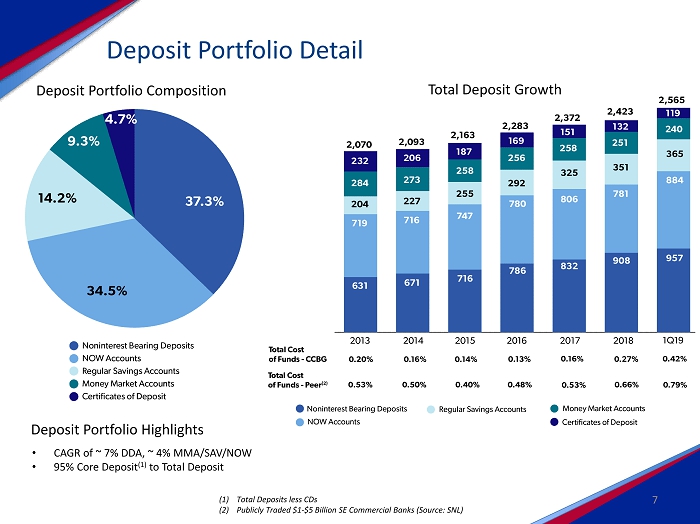
Deposit Portfolio Detail Deposit Portfolio Composition Total Deposit Growth Deposit Portfolio Highlights (1) Total Deposits less CDs (2) Publicly Traded $1 - $5 Billion SE Commercial Banks (Source: SNL) • CAGR of ~ 7% DDA, ~ 4% MMA/SAV/ NOW • 95% Core Deposit (1) to Total Deposit 7
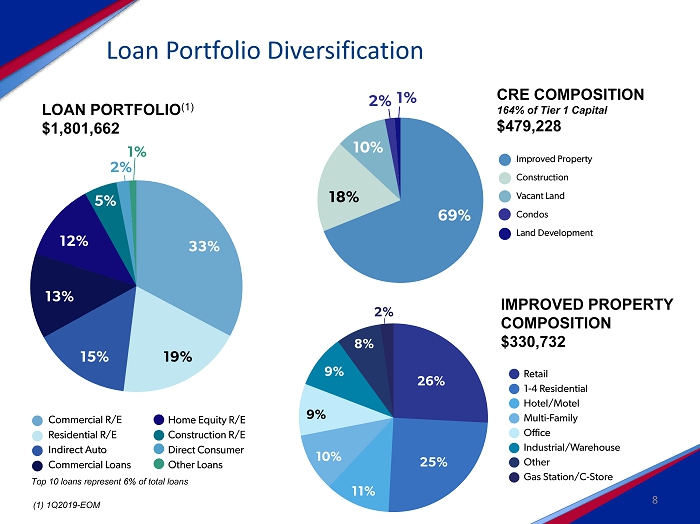
Loan Portfolio Diversification CRE COMPOSITION 164% of Tier 1 Capital $479,228 8 (1 ) 1Q2019 - EOM IMPROVED PROPERTY COMPOSITION $330,732 LOAN PORTFOLIO (1) $1,801,662 Top 10 loans represent 6% of total loans
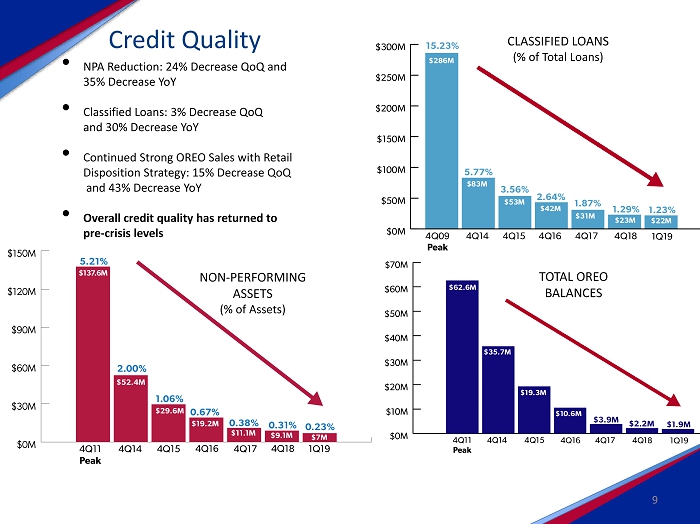
Credit Quality NON - PERFORMING ASSETS (% of Assets) CLASSIFIED LOANS (% of Total Loans) TOTAL OREO BALANCES • NPA Reduction: 24% Decrease QoQ and 35% Decrease YoY • Classified Loans: 3% De c rease QoQ and 30% Decrease YoY • Continued Strong OREO Sales with Retail Disposition Strategy: 15 % Decrease QoQ and 43% Decrease YoY • Overall credit quality has returned to pre - crisis levels 9
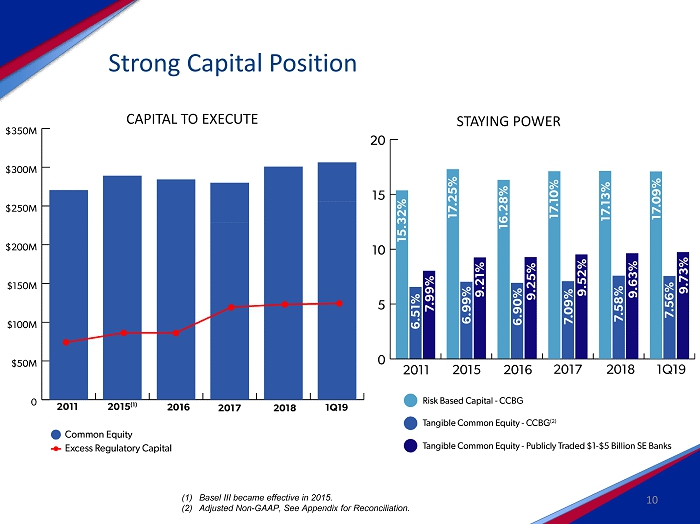
Strong Capital Position CAPITAL TO EXECUTE STAYING POWER (1) Basel III became effective in 2015. (2) Adjusted Non - GAAP, See A ppendix for Reconciliation. 10
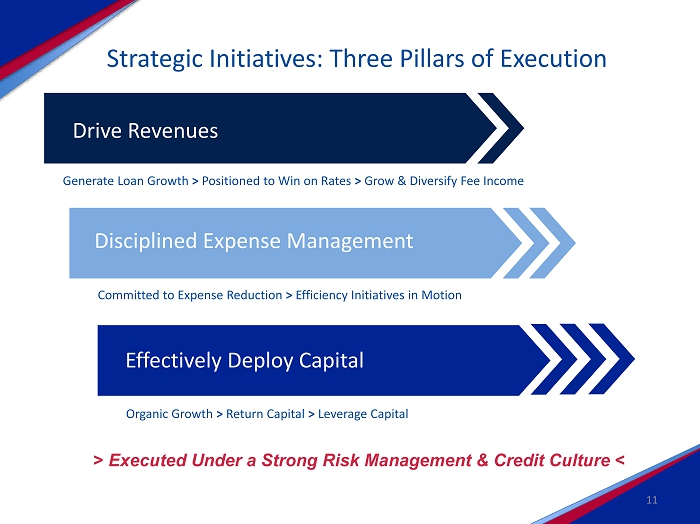
Strategic Initiatives: Three Pillars of Execution Drive Revenues Generate Loan Growth > Positioned to Win on Rates > Grow & Diversify Fee Income Disciplined Expense Management Committed to Expense Reduction > Efficiency Initiatives in Motion Effectively Deploy Capital Organic Growth > Return Capital > Leverage Capital 11 > Executed Under a Strong Risk Management & Credit Culture <
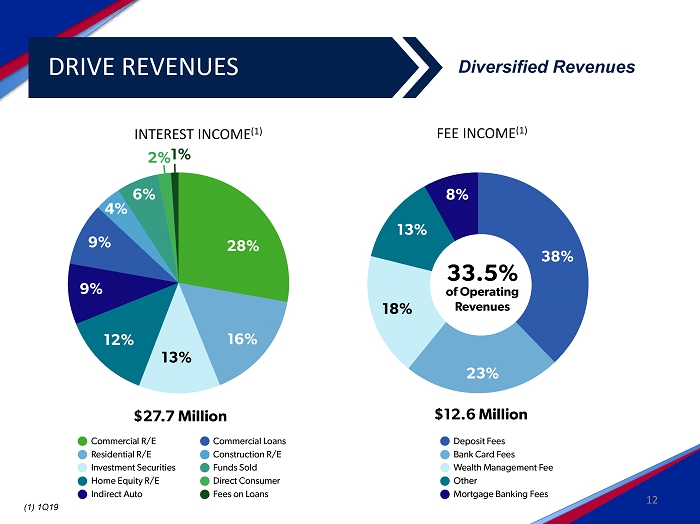
DRIVE REVENUES INTEREST INCOME (1) FEE INCOME (1) 12 ( 1) 1Q19 Diversified Revenues
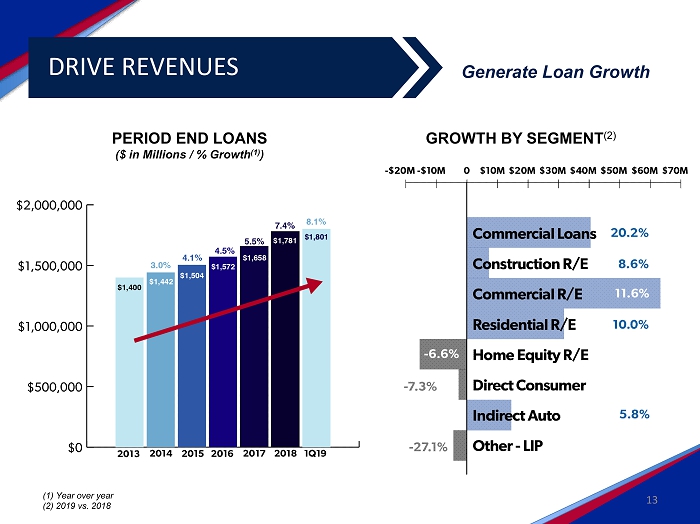
PERIOD END LOANS ($ in Millions / % Growth (1) ) GROWTH BY SEGMENT (2) 13 (1) Year over year ( 2 ) 2019 vs. 2018 DRIVE REVENUES Generate Loan Growth
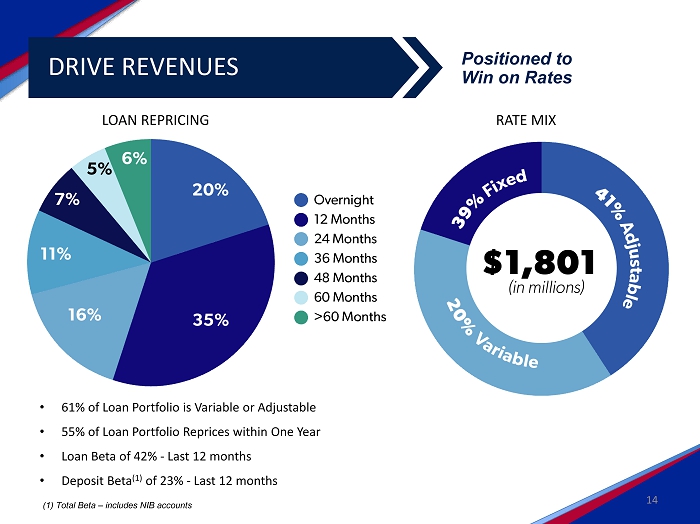
LOAN REPRICING • 61% of Loan Portfolio is Variable or Adjustable • 55% of Loan Portfolio Reprices within One Year • Loan Beta of 42% - Last 12 months • Deposit Beta (1) of 23% - Last 12 months 14 DRIVE REVENUES Positioned to Win on Rates RATE MIX (1) Total Beta – includes NIB accounts
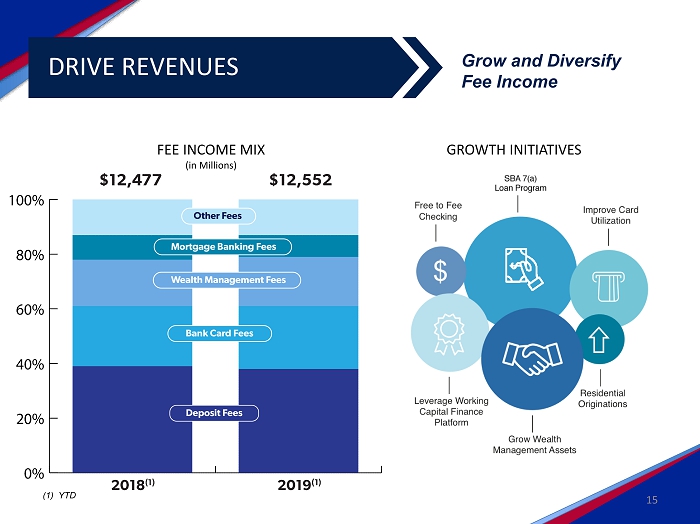
FEE INCOME MIX (in Millions) GROWTH INITIATIVES 15 DRIVE REVENUES Grow and Diversify Fee Income (1) YTD
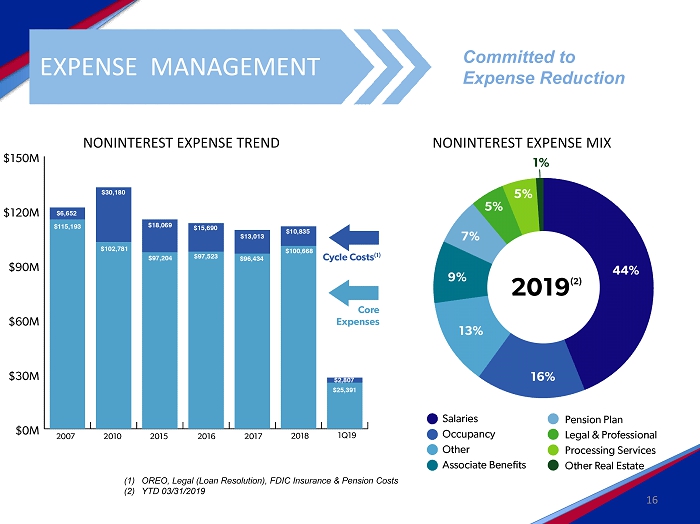
NONINTEREST EXPENSE TREND NONINTEREST EXPENSE MIX 16 (1) OREO, Legal (Loan Resolution), FDIC Insurance & Pension Costs (2) YTD 03/31/2019 EXPENSE MANAGEMENT Committed to Expense Reduction
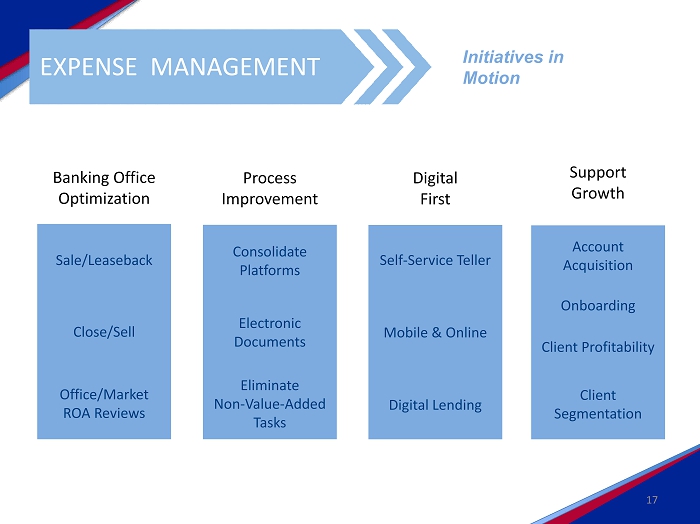
Support Growth Account Acquisition Onboarding Client Profitability Client Segmentation Digital First Self - Service Teller Mobile & Online Digital Lending Banking Office Optimization Sale/Leaseback Close/Sell Office/Market ROA Reviews Process Improvement Consolidate Platforms Electronic Documents Eliminate Non - Value - Added Tasks 17 Initiatives in Motion EXPENSE MANAGEMENT
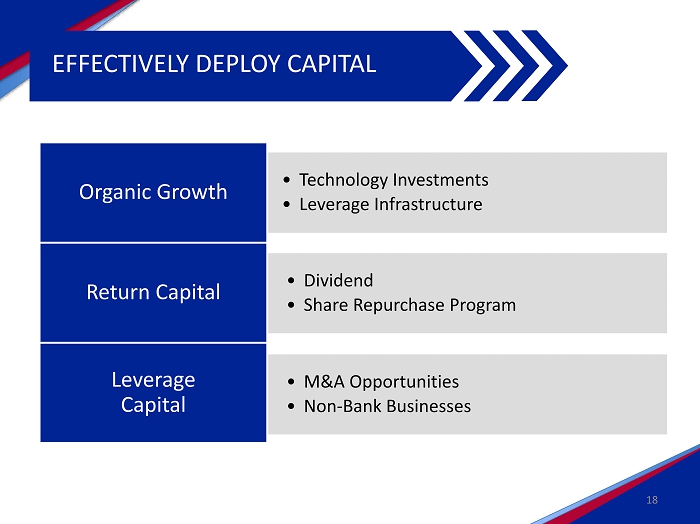
• Technology Investments • Leverage Infrastructure Organic Growth • Dividend • Share Repurchase Program Return Capital • M&A Opportunities • Non - Bank Businesses Leverage Capital 18 EFFECTIVELY DEPLOY CAPITAL
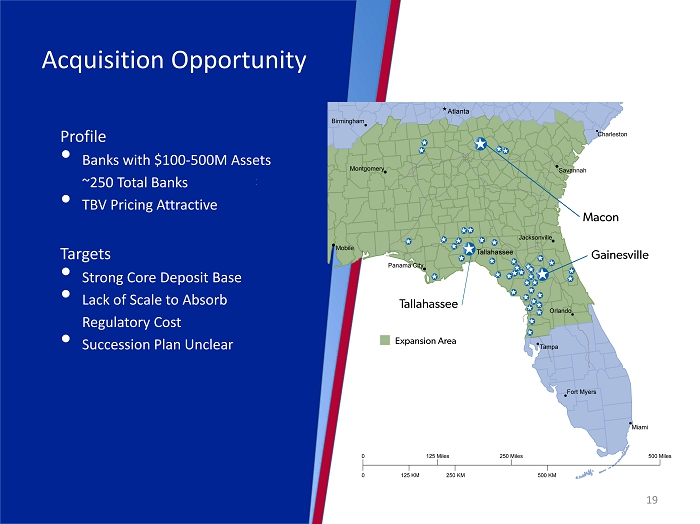
Acquisition Opportunity 19 Profile • Banks with $100 - 500M Assets ~250 Total Banks • TBV Pricing Attractive Targets • Strong Core Deposit Base • Lack of Scale to Absorb Regulatory Cost • Succession Plan Unclear
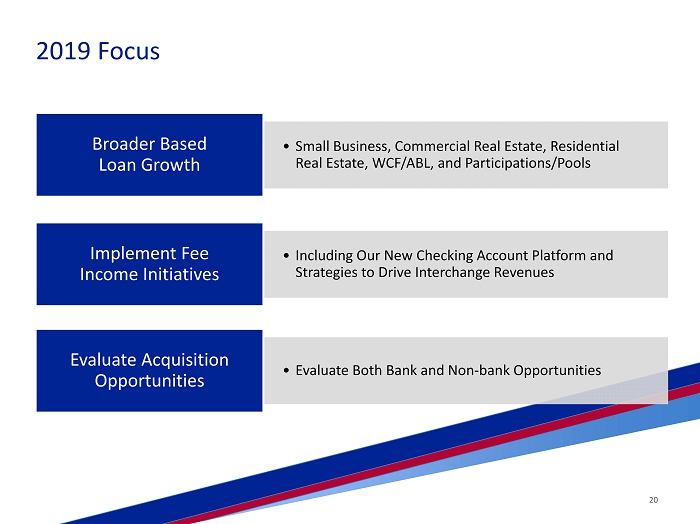
20 2019 Focus • Small Business, Commercial Real Estate, Residential Real Estate, WCF/ABL, and Participations/Pools Broader Based Loan Growth • Including Our New Checking Account Platform and Strategies to Drive Interchange Revenues Implement Fee Income Initiatives • Evaluate Both Bank and Non - bank Opportunities Evaluate Acquisition Opportunities
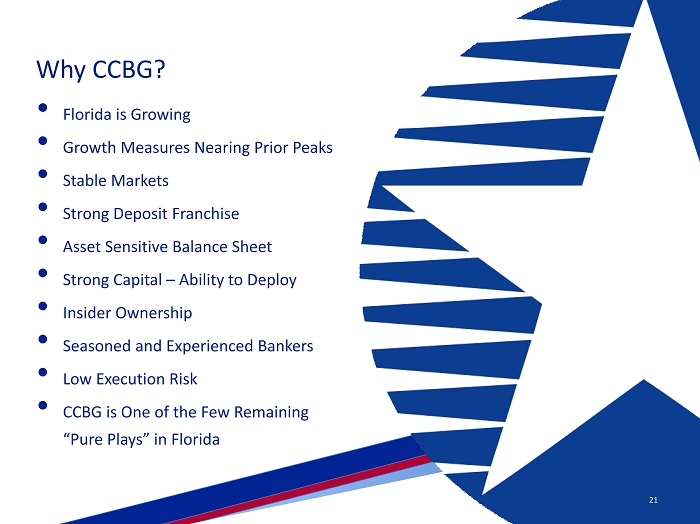
Why CCBG? • Florida is Growing • Growth Measures Nearing Prior Peaks • Stable Markets • Strong Deposit Franchise • Asset Sensitive Balance Sheet • Strong Capital – Ability to Deploy • Insider Ownership • Seasoned and Experienced Bankers • Low Execution Risk • CCBG is One of the Few Remaining “Pure Plays” in Florida 21
22

Appendix
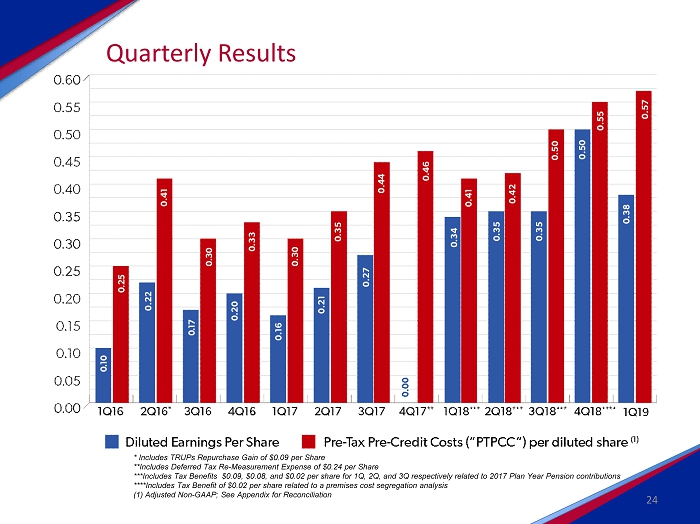
Quarterly Results 24 * Includes TRUPs Repurchase G ain of $0.09 per Share **Includes Deferred Tax Re - Measurement Expense of $0.24 per Share ***Includes Tax Benefits $0.09, $0.08, and $0.02 per share for 1Q, 2Q, and 3Q respectively related to 2017 Plan Year Pension co ntributions * ***Includes Tax Benefit of $0.02 per share related to a premises cost segregation analysis (1) Adjusted Non - GAAP; See A ppendix for Reconciliation
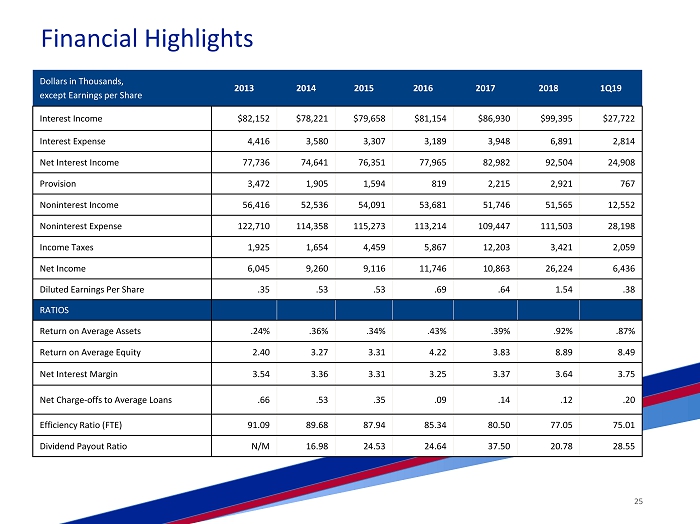
Financial Highlights Dollars in Thousands, except Earnings per Share 2013 2014 2015 2016 2017 2018 1Q19 Interest Income $82,152 $78,221 $79,658 $81,154 $86,930 $99,395 $27,722 Interest Expense 4,416 3,580 3,307 3,189 3,948 6,891 2,814 Net Interest Income 77,736 74,641 76,351 77,965 82,982 92,504 24,908 Provision 3,472 1,905 1,594 819 2,215 2,921 767 Noninterest Income 56,416 52,536 54,091 53,681 51,746 51,565 12,552 Noninterest Expense 122,710 114,358 115,273 113,214 109,447 111,503 28,198 Income Taxes 1,925 1,654 4,459 5,867 12,203 3,421 2,059 Net Income 6,045 9,260 9,116 11,746 10,863 26,224 6,436 Diluted Earnings Per Share .35 .53 .53 .69 .64 1.54 .38 RATIOS Return on Average Assets .24% .36% .34% .43% .39% .92% .87% Return on Average Equity 2.40 3.27 3.31 4.22 3.83 8.89 8.49 Net Interest Margin 3.54 3.36 3.31 3.25 3.37 3.64 3.75 Net Charge - offs to Average Loans .66 .53 .35 .09 .14 .12 .20 Efficiency Ratio (FTE) 91.09 89.68 87.94 85.34 80.50 77.05 75.01 Dividend Payout Ratio N/M 16.98 24.53 24.64 37.50 20.78 28.55 25
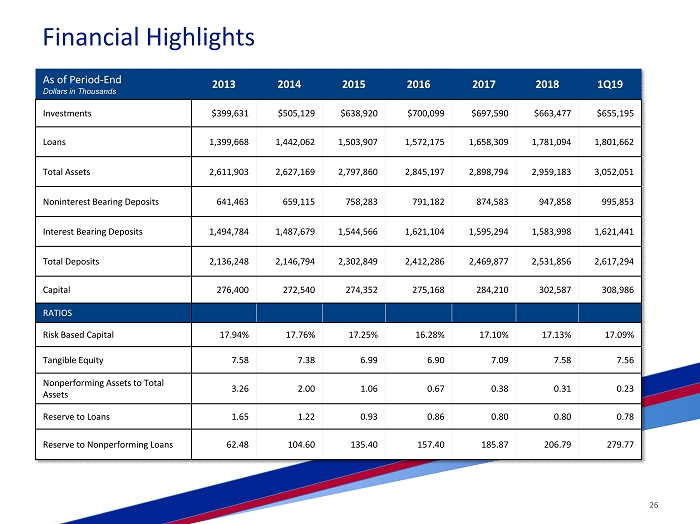
As of Period - End Dollars in Thousands 2013 2014 2015 2016 2017 2018 1Q19 Investments $399,631 $505,129 $638,920 $700,099 $697,590 $663,477 $655,195 Loans 1,399,668 1,442,062 1,503,907 1,572,175 1,658,309 1,781,094 1,801,662 Total Assets 2,611,903 2,627,169 2,797,860 2,845,197 2,898,794 2,959,183 3,052,051 Noninterest Bearing Deposits 641,463 659,115 758,283 791,182 874,583 947,858 995,853 Interest Bearing Deposits 1,494,784 1,487,679 1,544,566 1,621,104 1,595,294 1,583,998 1,621,441 Total Deposits 2,136,248 2,146,794 2,302,849 2,412,286 2,469,877 2,531,856 2,617,294 Capital 276,400 272,540 274,352 275,168 284,210 302,587 308,986 RATIOS Risk Based Capital 17.94% 17.76% 17.25% 16.28% 17.10% 17.13% 17.09% Tangible Equity 7.58 7.38 6.99 6.90 7.09 7.58 7.56 Nonperforming Assets to Total Assets 3.26 2.00 1.06 0.67 0.38 0.31 0.23 Reserve to Loans 1.65 1.22 0.93 0.86 0.80 0.80 0.78 Reserve to Nonperforming Loans 62.48 104.60 135.40 157.40 185.87 206.79 279.77 26 Financial Highlights
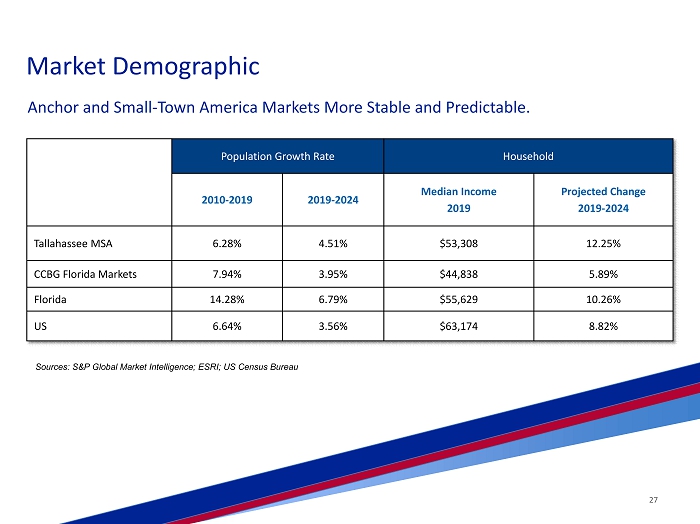
NASDAQ: CCBG Population Growth Rate Household 2010 - 2019 2019 - 2024 Median Income 2019 Projected Change 2019 - 2024 Tallahassee MSA 6.28% 4.51% $53,308 12.25% CCBG Florida Markets 7.94% 3.95% $44,838 5.89% Florida 14.28% 6.79% $55,629 10.26% US 6.64% 3.56% $63,174 8.82% Sources: S&P Global Market Intelligence; ESRI; US Census Bureau Anchor and Small - Town America Markets More Stable and Predictable. 27 Market Demographic
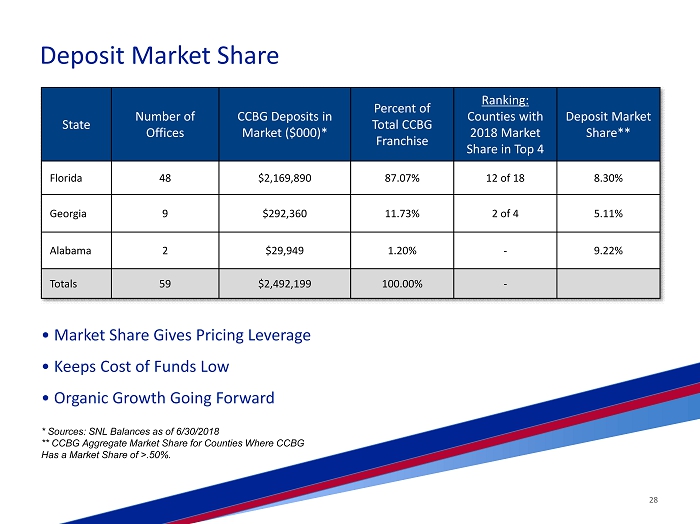
NSDAQ : CCBG State Number of Offices CCBG Deposits in Market ($000)* Percent of Total CCBG Franchise Ranking: Counties with 2018 Market Share in Top 4 Deposit Market Share** Florida 48 $2,169,890 87.07% 12 of 18 8.30% Georgia 9 $292,360 11.73% 2 of 4 5.11% Alabama 2 $29,949 1.20% - 9.22% Totals 59 $2,492,199 100.00% - * Sources: SNL Balances as of 6/30/ 2018 ** CCBG Aggregate Market Share for Counties Where CCBG Has a Market Share of >.50% . • Market Share Gives Pricing Leverage • Keeps Cost of Funds L ow • Organic Growth G oing F orward 28 Deposit Market Share
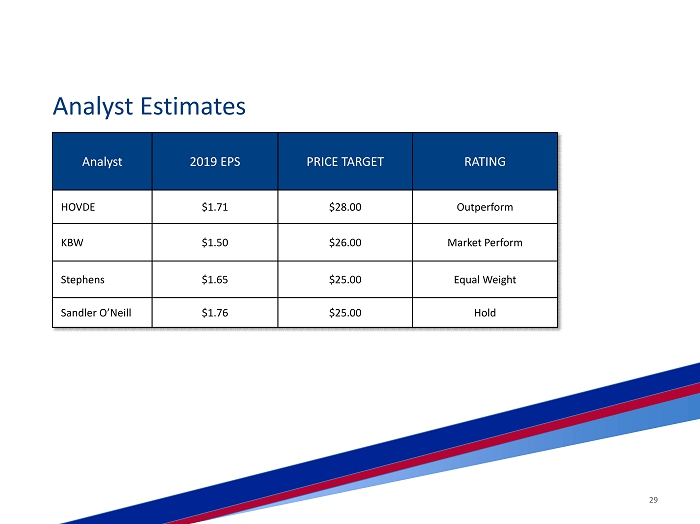
Analyst Estimates Analyst 2019 EPS PRICE TARGET RATING HOVDE $1.71 $28.00 Outperform KBW $1.50 $26.00 Market Perform Stephens $1.65 $25.00 Equal Weight Sandler O’Neill $1.76 $25.00 Hold 29
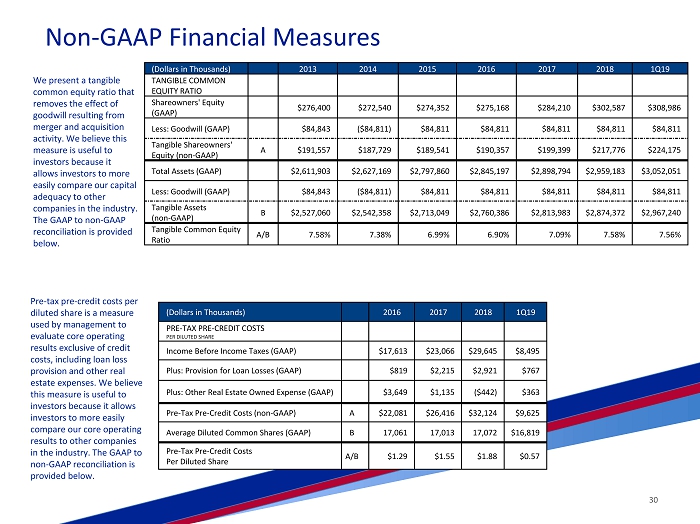
30 (Dollars in Thousands) 2013 2014 2015 2016 2017 2018 1Q19 TANGIBLE COMMON EQUITY RATIO Shareowners' Equity (GAAP) $ 276,400 $272,540 $ 274,352 $ 275,168 $ 284,210 $302,587 $308,986 Less: Goodwill (GAAP) $ 8 4,843 ($84,811) $84,811 $84,811 $84,811 $84,811 $84,811 Tangible Shareowners' Equity (non - GAAP) A $191,557 $187,729 $189,541 $190,357 $199,399 $ 217,776 $224,175 Total Assets (GAAP) $2,611,903 $2,627,169 $2,797,860 $2,845,197 $2,898,794 $ 2,959,183 $3,052,051 Less: Goodwill (GAAP) $ 8 4,843 ($84,811) $84,811 $84,811 $84,811 $ 84,811 $84,811 Tangible Assets ( non - GAAP) B $ 2,527,060 $2,542,358 $ 2,713,049 $ 2,760,386 $2,813,983 $ 2,874,372 $2,967,240 Tangible Common Equity Ratio A/B 7.58% 7.38% 6.99% 6.90% 7.09% 7.58% 7.56% (Dollars in Thousands) 2016 2017 2018 1Q19 PRE - TAX PRE - CREDIT COSTS PER DILUTED SHARE Income Before Income Taxes (GAAP) $ 17,613 $23,066 $29,645 $8,495 Plus: Provision for Loan Losses (GAAP) $819 $2,215 $2,921 $767 Plus: Other Real Estate Owned Expense (GAAP) $3,649 $1,135 ($442) $363 Pre - Tax Pre - Credit Costs (non - GAAP) A $22,081 $26,416 $32,124 $9,625 Average Diluted Common Shares (GAAP) B 17,061 17,013 17,072 $16,819 Pre - Tax Pre - Credit Costs Per Diluted Share A/B $ 1.29 $1.55 $1.88 $0.57 We present a tangible common equity ratio that removes the effect of goodwill resulting from merger and acquisition activity . We believe this measure is useful to investors because it allows investors to more easily compare our capital adequacy to other companies in the industry. The GAAP to non - GAAP reconciliation is provided below. Pre - tax pre - credit costs per diluted share is a measure used by management to evaluate core operating results exclusive of credit costs, including loan loss provision and other real estate expenses . We believe this measure is useful to investors because it allows investors to more easily compare our core operating results to other companies in the industry . The GAAP to non - GAAP reconciliation is provided below. Non - GAAP Financial Measures

31
Corporate Headquarters 217 North Monroe Street Tallahassee, FL 32301 www.ccbg.com 32 William G. Smith, CEO smith.bill@ccbg.com J. Kimbrough Davis, CFO d avis.kim@ccbg.com Jep Larkin, Controller l arkin.jep@ccbg.com